Cities with the Highest Percentage of Population Employed in Arts, Entertainment & Recreation in Alabama
RELATED REPORTS & OPTIONS
Arts, Entertainment & Recreation
Alabama
Compare Cities
Map of Cities with the Highest Percentage of Population Employed in Arts, Entertainment & Recreation in Alabama
0.0%
25.0%
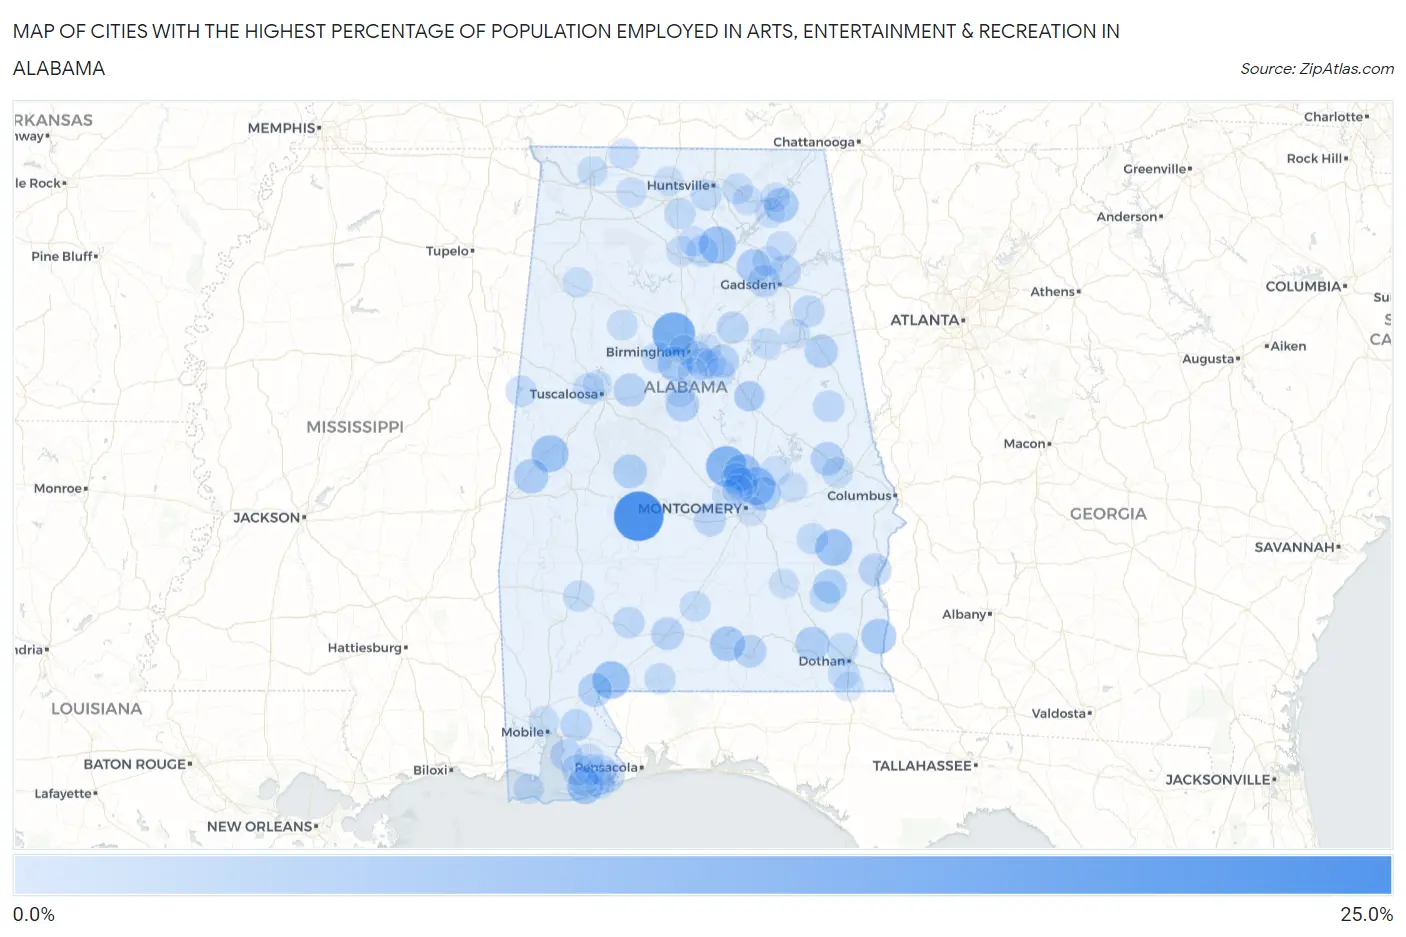
Cities with the Highest Percentage of Population Employed in Arts, Entertainment & Recreation in Alabama
| City | % Employed | vs State | vs National | |
| 1. | Orrville | 21.4% | 1.4%(+20.1)#1 | 2.1%(+19.3)#232 |
| 2. | Cardiff | 14.3% | 1.4%(+12.9)#2 | 2.1%(+12.2)#511 |
| 3. | Marbury | 12.0% | 1.4%(+10.7)#3 | 2.1%(+9.94)#666 |
| 4. | Wetumpka | 9.5% | 1.4%(+8.13)#4 | 2.1%(+7.41)#998 |
| 5. | Atmore | 9.1% | 1.4%(+7.70)#5 | 2.1%(+6.99)#1,061 |
| 6. | Joppa | 8.7% | 1.4%(+7.31)#6 | 2.1%(+6.59)#1,139 |
| 7. | Holtville | 8.6% | 1.4%(+7.24)#7 | 2.1%(+6.52)#1,156 |
| 8. | Boligee | 8.5% | 1.4%(+7.14)#8 | 2.1%(+6.43)#1,184 |
| 9. | Midway | 8.3% | 1.4%(+6.97)#9 | 2.1%(+6.25)#1,213 |
| 10. | Gulf Shores | 7.5% | 1.4%(+6.10)#10 | 2.1%(+5.38)#1,467 |
| 11. | Lipscomb | 6.6% | 1.4%(+5.26)#11 | 2.1%(+4.54)#1,715 |
| 12. | Heath | 6.6% | 1.4%(+5.23)#12 | 2.1%(+4.51)#1,729 |
| 13. | Haleburg | 6.6% | 1.4%(+5.19)#13 | 2.1%(+4.47)#1,744 |
| 14. | Section | 6.2% | 1.4%(+4.86)#14 | 2.1%(+4.15)#1,889 |
| 15. | Livingston | 6.2% | 1.4%(+4.79)#15 | 2.1%(+4.07)#1,916 |
| 16. | New Union | 5.8% | 1.4%(+4.47)#16 | 2.1%(+3.75)#2,071 |
| 17. | Fort Rucker | 5.7% | 1.4%(+4.33)#17 | 2.1%(+3.62)#2,146 |
| 18. | Redland | 5.7% | 1.4%(+4.31)#18 | 2.1%(+3.59)#2,160 |
| 19. | Marion | 5.5% | 1.4%(+4.13)#19 | 2.1%(+3.41)#2,266 |
| 20. | Perdido | 5.4% | 1.4%(+4.07)#20 | 2.1%(+3.36)#2,301 |
| 21. | Louisville | 5.3% | 1.4%(+3.96)#21 | 2.1%(+3.24)#2,371 |
| 22. | Waverly | 5.1% | 1.4%(+3.76)#22 | 2.1%(+3.05)#2,506 |
| 23. | Montevallo | 5.1% | 1.4%(+3.75)#23 | 2.1%(+3.03)#2,518 |
| 24. | Hollis Crossroads | 5.0% | 1.4%(+3.65)#24 | 2.1%(+2.94)#2,583 |
| 25. | Vandiver | 4.8% | 1.4%(+3.39)#25 | 2.1%(+2.68)#2,780 |
| 26. | Brookwood | 4.7% | 1.4%(+3.33)#26 | 2.1%(+2.61)#2,841 |
| 27. | Elmore | 4.5% | 1.4%(+3.17)#27 | 2.1%(+2.45)#2,995 |
| 28. | Evergreen | 4.5% | 1.4%(+3.10)#28 | 2.1%(+2.39)#3,067 |
| 29. | Opp | 4.4% | 1.4%(+2.99)#29 | 2.1%(+2.27)#3,196 |
| 30. | Eufaula | 4.3% | 1.4%(+2.94)#30 | 2.1%(+2.22)#3,262 |
| 31. | Ivalee | 4.2% | 1.4%(+2.80)#31 | 2.1%(+2.08)#3,414 |
| 32. | Mountain Brook | 4.2% | 1.4%(+2.79)#32 | 2.1%(+2.07)#3,434 |
| 33. | Lookout Mountain | 4.0% | 1.4%(+2.60)#33 | 2.1%(+1.88)#3,682 |
| 34. | Lowndesboro | 3.9% | 1.4%(+2.55)#34 | 2.1%(+1.84)#3,737 |
| 35. | Brook Highland | 3.9% | 1.4%(+2.49)#35 | 2.1%(+1.77)#3,811 |
| 36. | Fairhope | 3.9% | 1.4%(+2.49)#36 | 2.1%(+1.77)#3,812 |
| 37. | Odenville | 3.8% | 1.4%(+2.44)#37 | 2.1%(+1.72)#3,893 |
| 38. | Stapleton | 3.7% | 1.4%(+2.31)#38 | 2.1%(+1.59)#4,115 |
| 39. | Mount Olive Cdp Jefferson County | 3.6% | 1.4%(+2.25)#39 | 2.1%(+1.54)#4,187 |
| 40. | Perdido Beach | 3.6% | 1.4%(+2.24)#40 | 2.1%(+1.53)#4,201 |
| 41. | Jacksonville | 3.5% | 1.4%(+2.17)#41 | 2.1%(+1.46)#4,315 |
| 42. | Fairview | 3.5% | 1.4%(+2.17)#42 | 2.1%(+1.46)#4,318 |
| 43. | Wadley | 3.4% | 1.4%(+2.04)#43 | 2.1%(+1.33)#4,566 |
| 44. | Monroeville | 3.4% | 1.4%(+2.02)#44 | 2.1%(+1.31)#4,605 |
| 45. | Magnolia Springs | 3.3% | 1.4%(+1.93)#45 | 2.1%(+1.22)#4,782 |
| 46. | Union Springs | 3.3% | 1.4%(+1.90)#46 | 2.1%(+1.19)#4,840 |
| 47. | Napier Field | 3.3% | 1.4%(+1.89)#47 | 2.1%(+1.18)#4,858 |
| 48. | Deatsville | 3.3% | 1.4%(+1.89)#48 | 2.1%(+1.17)#4,870 |
| 49. | Rehobeth | 3.2% | 1.4%(+1.87)#49 | 2.1%(+1.15)#4,893 |
| 50. | Redstone Arsenal | 3.2% | 1.4%(+1.80)#50 | 2.1%(+1.08)#5,036 |
| 51. | Coker | 3.1% | 1.4%(+1.78)#51 | 2.1%(+1.06)#5,072 |
| 52. | Priceville | 3.1% | 1.4%(+1.76)#52 | 2.1%(+1.05)#5,103 |
| 53. | Clio | 3.1% | 1.4%(+1.68)#53 | 2.1%(+0.969)#5,293 |
| 54. | Pickensville | 3.1% | 1.4%(+1.68)#54 | 2.1%(+0.968)#5,295 |
| 55. | East Brewton | 3.0% | 1.4%(+1.62)#55 | 2.1%(+0.904)#5,420 |
| 56. | Rock Creek | 3.0% | 1.4%(+1.61)#56 | 2.1%(+0.896)#5,437 |
| 57. | Foley | 3.0% | 1.4%(+1.61)#57 | 2.1%(+0.893)#5,447 |
| 58. | Grove Hill | 3.0% | 1.4%(+1.60)#58 | 2.1%(+0.886)#5,462 |
| 59. | Georgiana | 2.9% | 1.4%(+1.49)#59 | 2.1%(+0.775)#5,741 |
| 60. | Lincoln | 2.8% | 1.4%(+1.40)#60 | 2.1%(+0.682)#5,997 |
| 61. | Prattville | 2.7% | 1.4%(+1.37)#61 | 2.1%(+0.659)#6,061 |
| 62. | Auburn | 2.6% | 1.4%(+1.27)#62 | 2.1%(+0.558)#6,367 |
| 63. | Mccalla | 2.6% | 1.4%(+1.25)#63 | 2.1%(+0.538)#6,430 |
| 64. | Gurley | 2.6% | 1.4%(+1.23)#64 | 2.1%(+0.515)#6,486 |
| 65. | Sardis City | 2.6% | 1.4%(+1.19)#65 | 2.1%(+0.478)#6,604 |
| 66. | Elberta | 2.5% | 1.4%(+1.17)#66 | 2.1%(+0.450)#6,699 |
| 67. | Oakman | 2.5% | 1.4%(+1.09)#67 | 2.1%(+0.376)#6,958 |
| 68. | Mignon | 2.5% | 1.4%(+1.09)#68 | 2.1%(+0.374)#6,965 |
| 69. | Lexington | 2.4% | 1.4%(+0.993)#69 | 2.1%(+0.277)#7,294 |
| 70. | Florence | 2.3% | 1.4%(+0.976)#70 | 2.1%(+0.261)#7,351 |
| 71. | West End Cobb Town | 2.3% | 1.4%(+0.970)#71 | 2.1%(+0.254)#7,368 |
| 72. | South Vinemont | 2.3% | 1.4%(+0.925)#72 | 2.1%(+0.210)#7,535 |
| 73. | Dauphin Island | 2.3% | 1.4%(+0.920)#73 | 2.1%(+0.204)#7,554 |
| 74. | Eclectic | 2.3% | 1.4%(+0.910)#74 | 2.1%(+0.195)#7,573 |
| 75. | Millbrook | 2.2% | 1.4%(+0.851)#75 | 2.1%(+0.136)#7,798 |
| 76. | Eagle Point | 2.2% | 1.4%(+0.850)#76 | 2.1%(+0.135)#7,801 |
| 77. | Brilliant | 2.2% | 1.4%(+0.849)#77 | 2.1%(+0.134)#7,805 |
| 78. | Irondale | 2.2% | 1.4%(+0.849)#78 | 2.1%(+0.133)#7,807 |
| 79. | Summerdale | 2.2% | 1.4%(+0.822)#79 | 2.1%(+0.106)#7,893 |
| 80. | Westover | 2.2% | 1.4%(+0.816)#80 | 2.1%(+0.101)#7,913 |
| 81. | Eva | 2.2% | 1.4%(+0.813)#81 | 2.1%(+0.097)#7,935 |
| 82. | North Courtland | 2.2% | 1.4%(+0.807)#82 | 2.1%(+0.091)#7,965 |
| 83. | Orange Beach | 2.2% | 1.4%(+0.806)#83 | 2.1%(+0.091)#7,984 |
| 84. | Brantleyville | 2.2% | 1.4%(+0.799)#84 | 2.1%(+0.084)#8,010 |
| 85. | Bon Secour | 2.2% | 1.4%(+0.794)#85 | 2.1%(+0.078)#8,031 |
| 86. | Langston | 2.2% | 1.4%(+0.784)#86 | 2.1%(+0.068)#8,066 |
| 87. | Crossville | 2.1% | 1.4%(+0.768)#87 | 2.1%(+0.053)#8,134 |
| 88. | Tallassee | 2.1% | 1.4%(+0.754)#88 | 2.1%(+0.038)#8,202 |
| 89. | Chickasaw | 2.1% | 1.4%(+0.687)#89 | 2.1%(-0.028)#8,485 |
| 90. | Woodville | 2.0% | 1.4%(+0.679)#90 | 2.1%(-0.037)#8,513 |
| 91. | Troy | 2.0% | 1.4%(+0.635)#91 | 2.1%(-0.080)#8,691 |
| 92. | Athens | 1.9% | 1.4%(+0.566)#92 | 2.1%(-0.150)#8,972 |
| 93. | Birmingham | 1.9% | 1.4%(+0.553)#93 | 2.1%(-0.163)#9,033 |
| 94. | Montgomery | 1.9% | 1.4%(+0.538)#94 | 2.1%(-0.178)#9,107 |
| 95. | Shoal Creek | 1.9% | 1.4%(+0.532)#95 | 2.1%(-0.184)#9,142 |
| 96. | Sylacauga | 1.9% | 1.4%(+0.492)#96 | 2.1%(-0.223)#9,311 |
| 97. | Scottsboro | 1.9% | 1.4%(+0.484)#97 | 2.1%(-0.232)#9,356 |
| 98. | Hoover | 1.8% | 1.4%(+0.479)#98 | 2.1%(-0.237)#9,372 |
| 99. | Northport | 1.8% | 1.4%(+0.474)#99 | 2.1%(-0.242)#9,401 |
| 100. | Madrid | 1.8% | 1.4%(+0.451)#100 | 2.1%(-0.264)#9,513 |
Common Questions
What are the Top 10 Cities with the Highest Percentage of Population Employed in Arts, Entertainment & Recreation in Alabama?
Top 10 Cities with the Highest Percentage of Population Employed in Arts, Entertainment & Recreation in Alabama are:
What city has the Highest Percentage of Population Employed in Arts, Entertainment & Recreation in Alabama?
Orrville has the Highest Percentage of Population Employed in Arts, Entertainment & Recreation in Alabama with 21.4%.
What is the Percentage of Population Employed in Arts, Entertainment & Recreation in the State of Alabama?
Percentage of Population Employed in Arts, Entertainment & Recreation in Alabama is 1.4%.
What is the Percentage of Population Employed in Arts, Entertainment & Recreation in the United States?
Percentage of Population Employed in Arts, Entertainment & Recreation in the United States is 2.1%.