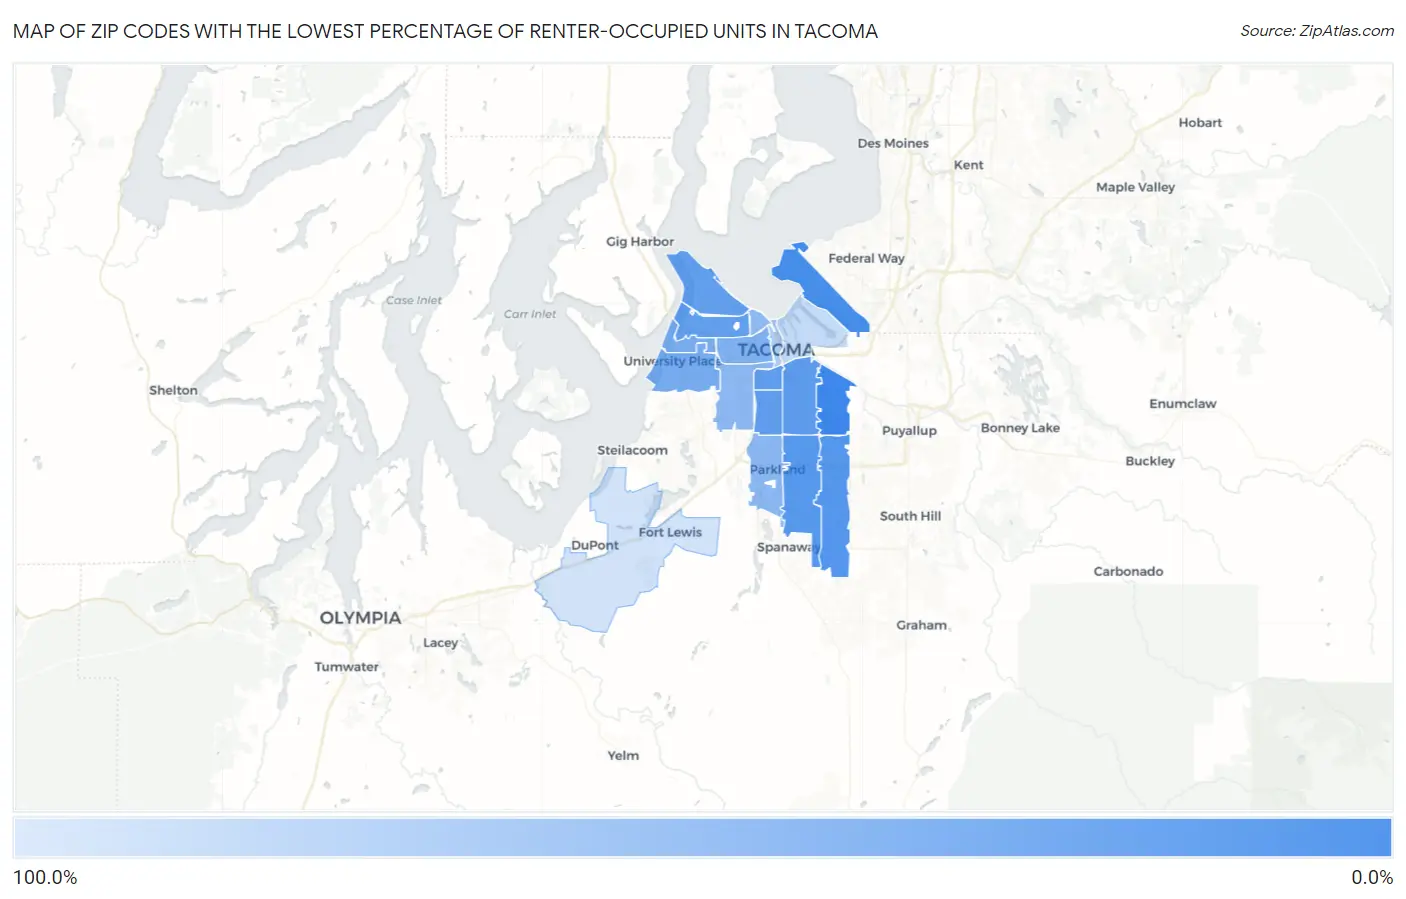
Zip Codes with the Lowest Percentage of Renter-Occupied Units in Tacoma, WA
RELATED REPORTS & OPTIONS
Lowest Renter-Occupied
Tacoma
Compare Zip Codes
Map of Zip Codes with the Lowest Percentage of Renter-Occupied Units in Tacoma
98.9%
17.2%
Zip Codes with the Lowest Percentage of Renter-Occupied Units in Tacoma, WA
| Zip Code | % Renter-Occupied | vs State | vs National | |
| 1. | 98443 | 17.2% | 36.2%(-19.0)#137 | 35.2%(-18.0)#10,140 |
| 2. | 98422 | 21.7% | 36.2%(-14.5)#198 | 35.2%(-13.4)#14,509 |
| 3. | 98446 | 28.3% | 36.2%(-7.93)#290 | 35.2%(-6.89)#19,927 |
| 4. | 98445 | 29.0% | 36.2%(-7.20)#302 | 35.2%(-6.17)#20,416 |
| 5. | 98404 | 32.8% | 36.2%(-3.37)#355 | 35.2%(-2.34)#22,692 |
| 6. | 98408 | 33.5% | 36.2%(-2.74)#365 | 35.2%(-1.71)#23,034 |
| 7. | 98418 | 34.0% | 36.2%(-2.22)#371 | 35.2%(-1.18)#23,255 |
| 8. | 98407 | 34.7% | 36.2%(-1.49)#381 | 35.2%(-0.454)#23,617 |
| 9. | 98406 | 35.0% | 36.2%(-1.17)#385 | 35.2%(-0.141)#23,765 |
| 10. | 98466 | 45.3% | 36.2%(+9.06)#468 | 35.2%(+10.1)#27,110 |
| 11. | 98465 | 47.3% | 36.2%(+11.1)#479 | 35.2%(+12.1)#27,513 |
| 12. | 98405 | 49.3% | 36.2%(+13.0)#490 | 35.2%(+14.1)#27,888 |
| 13. | 98444 | 55.5% | 36.2%(+19.3)#511 | 35.2%(+20.3)#28,834 |
| 14. | 98409 | 56.1% | 36.2%(+19.9)#513 | 35.2%(+20.9)#28,907 |
| 15. | 98403 | 58.7% | 36.2%(+22.5)#519 | 35.2%(+23.5)#29,183 |
| 16. | 98402 | 77.8% | 36.2%(+41.6)#542 | 35.2%(+42.7)#30,356 |
| 17. | 98421 | 89.1% | 36.2%(+52.9)#546 | 35.2%(+53.9)#30,612 |
| 18. | 98433 | 98.9% | 36.2%(+62.7)#549 | 35.2%(+63.8)#30,771 |
1
Common Questions
What are the Top 10 Zip Codes with the Lowest Percentage of Renter-Occupied Units in Tacoma, WA?
Top 10 Zip Codes with the Lowest Percentage of Renter-Occupied Units in Tacoma, WA are:
What zip code has the Lowest Percentage of Renter-Occupied Units in Tacoma, WA?
98443 has the Lowest Percentage of Renter-Occupied Units in Tacoma, WA with 17.2%.
What is the Percentage of Renter-Occupied Units in Tacoma, WA?
Percentage of Renter-Occupied Units in Tacoma is 43.2%.
What is the Percentage of Renter-Occupied Units in Washington?
Percentage of Renter-Occupied Units in Washington is 36.2%.
What is the Percentage of Renter-Occupied Units in the United States?
Percentage of Renter-Occupied Units in the United States is 35.2%.