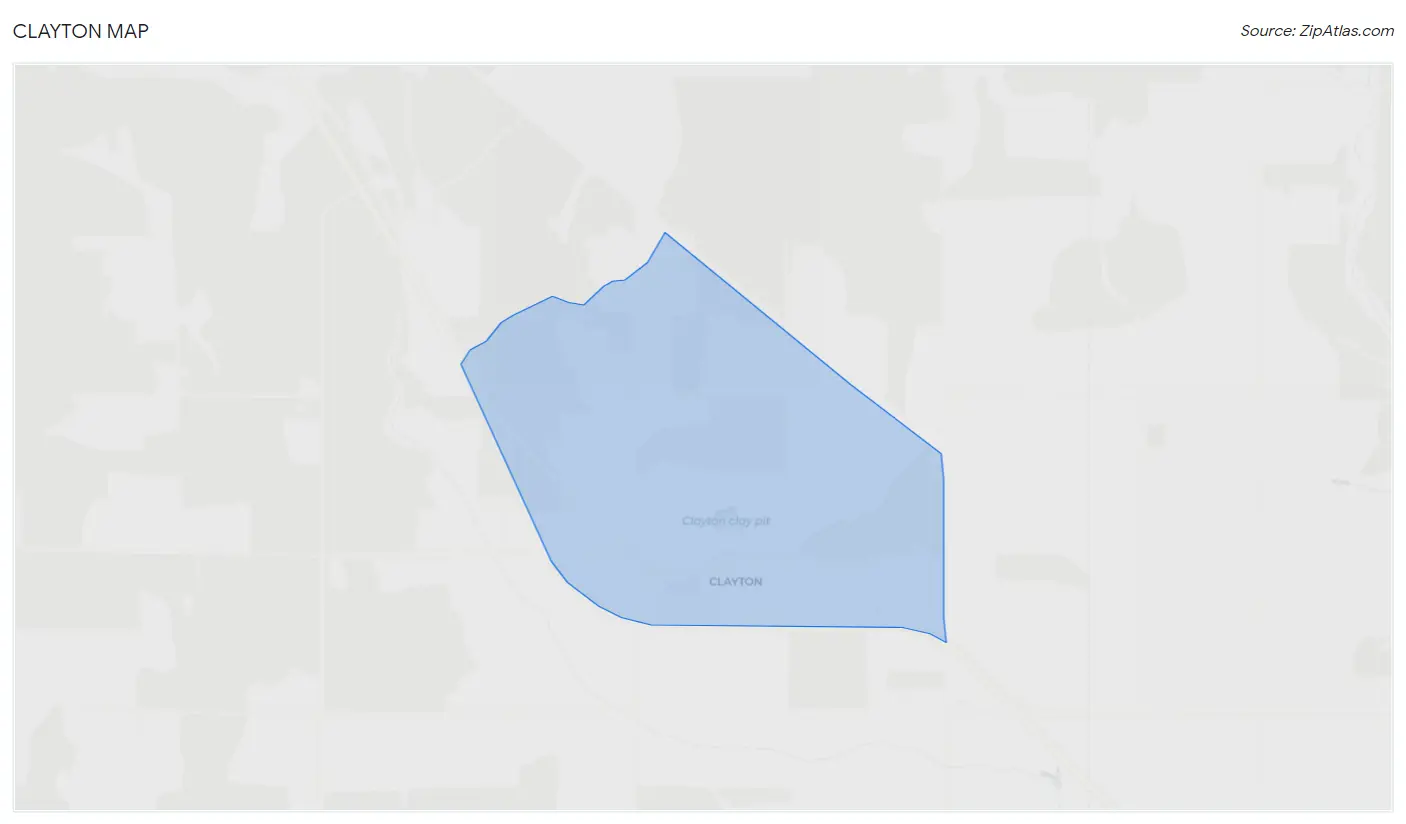
Clayton, WA Map & Demographics
Clayton Map
Clayton Overview
$23,464
PER CAPITA INCOME
$46,667
AVG FAMILY INCOME
$46,667
AVG HOUSEHOLD INCOME
26.7%
WAGE / INCOME GAP [ % ]
73.3¢/ $1
WAGE / INCOME GAP [ $ ]
0.09
INEQUALITY / GINI INDEX
127
TOTAL POPULATION
22
MALE POPULATION
105
FEMALE POPULATION
20.95
MALES / 100 FEMALES
477.27
FEMALES / 100 MALES
36.9
MEDIAN AGE
2.4
AVG FAMILY SIZE
2.4
AVG HOUSEHOLD SIZE
75
LABOR FORCE [ PEOPLE ]
63.6%
PERCENT IN LABOR FORCE
Clayton Zip Codes
Clayton Area Codes
Income in Clayton
Income Overview in Clayton
Per Capita Income in Clayton is $23,464, while median incomes of families and households are $46,667 and $46,667 respectively.
| Characteristic | Number | Measure |
| Per Capita Income | 127 | $23,464 |
| Median Family Income | 52 | $46,667 |
| Mean Family Income | 52 | $51,140 |
| Median Household Income | 52 | $46,667 |
| Mean Household Income | 52 | $51,140 |
| Income Deficit | 52 | $0 |
| Wage / Income Gap (%) | 127 | 26.68% |
| Wage / Income Gap ($) | 127 | 73.32¢ per $1 |
| Gini / Inequality Index | 127 | 0.09 |
Earnings by Sex in Clayton
Average Earnings in Clayton are $33,352, $45,375 for men and $33,267 for women, a difference of 26.7%.
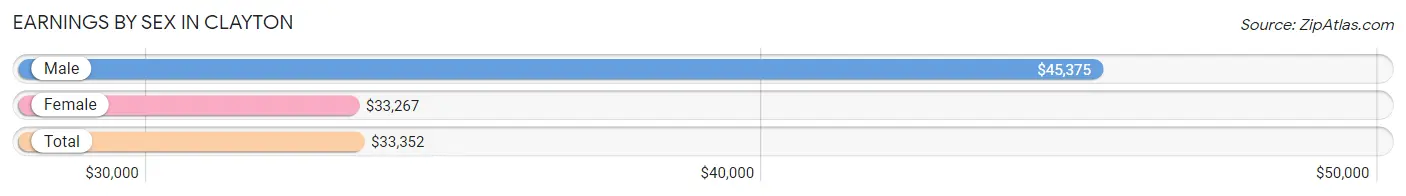
| Sex | Number | Average Earnings |
| Male | 19 (23.7%) | $45,375 |
| Female | 61 (76.2%) | $33,267 |
| Total | 80 (100.0%) | $33,352 |
Earnings by Sex by Income Bracket in Clayton
The most common earnings brackets in Clayton are $45,000 to $49,999 for men (10 | 52.6%) and $30,000 to $34,999 for women (44 | 72.1%).
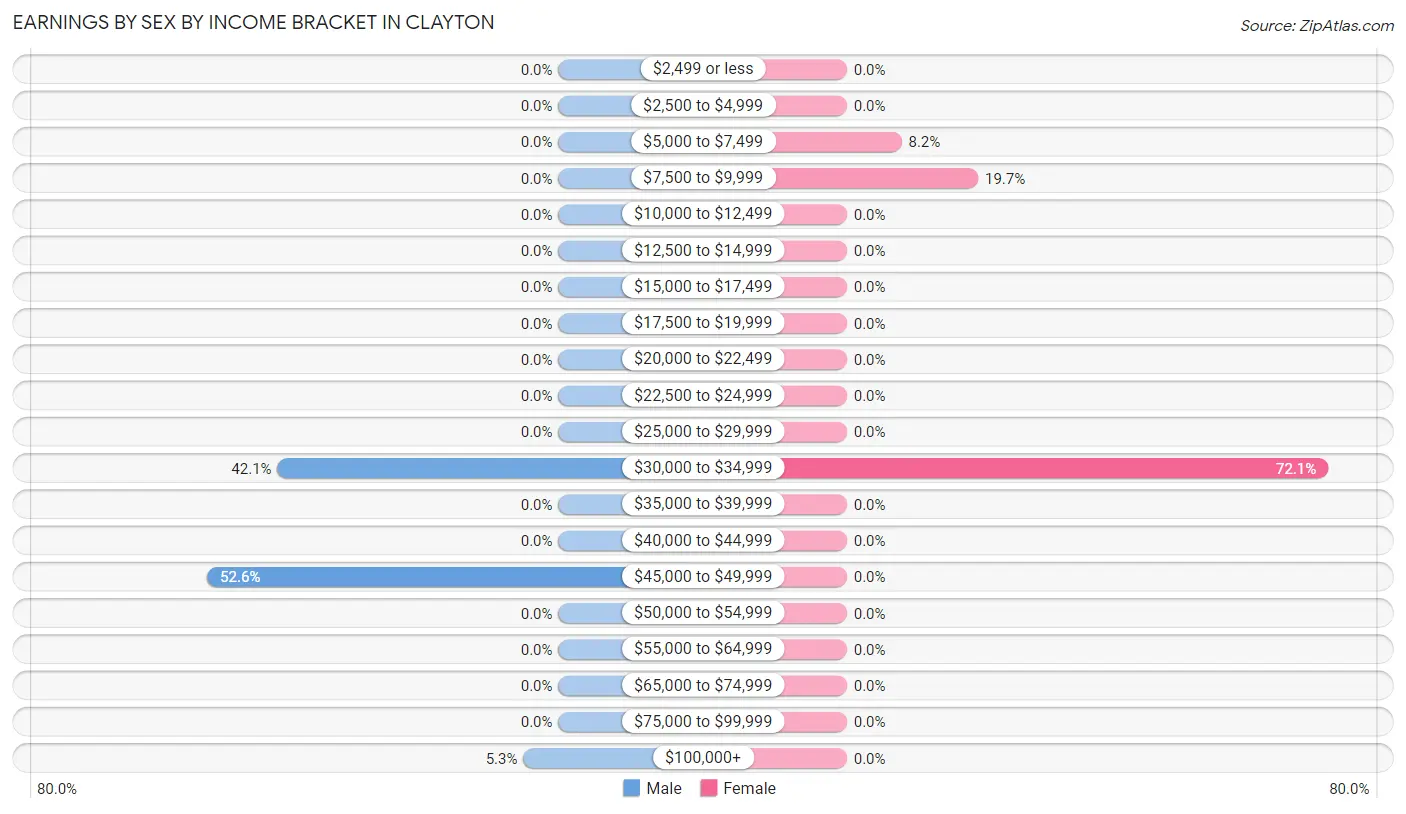
| Income | Male | Female |
| $2,499 or less | 0 (0.0%) | 0 (0.0%) |
| $2,500 to $4,999 | 0 (0.0%) | 0 (0.0%) |
| $5,000 to $7,499 | 0 (0.0%) | 5 (8.2%) |
| $7,500 to $9,999 | 0 (0.0%) | 12 (19.7%) |
| $10,000 to $12,499 | 0 (0.0%) | 0 (0.0%) |
| $12,500 to $14,999 | 0 (0.0%) | 0 (0.0%) |
| $15,000 to $17,499 | 0 (0.0%) | 0 (0.0%) |
| $17,500 to $19,999 | 0 (0.0%) | 0 (0.0%) |
| $20,000 to $22,499 | 0 (0.0%) | 0 (0.0%) |
| $22,500 to $24,999 | 0 (0.0%) | 0 (0.0%) |
| $25,000 to $29,999 | 0 (0.0%) | 0 (0.0%) |
| $30,000 to $34,999 | 8 (42.1%) | 44 (72.1%) |
| $35,000 to $39,999 | 0 (0.0%) | 0 (0.0%) |
| $40,000 to $44,999 | 0 (0.0%) | 0 (0.0%) |
| $45,000 to $49,999 | 10 (52.6%) | 0 (0.0%) |
| $50,000 to $54,999 | 0 (0.0%) | 0 (0.0%) |
| $55,000 to $64,999 | 0 (0.0%) | 0 (0.0%) |
| $65,000 to $74,999 | 0 (0.0%) | 0 (0.0%) |
| $75,000 to $99,999 | 0 (0.0%) | 0 (0.0%) |
| $100,000+ | 1 (5.3%) | 0 (0.0%) |
| Total | 19 (100.0%) | 61 (100.0%) |
Earnings by Sex by Educational Attainment in Clayton
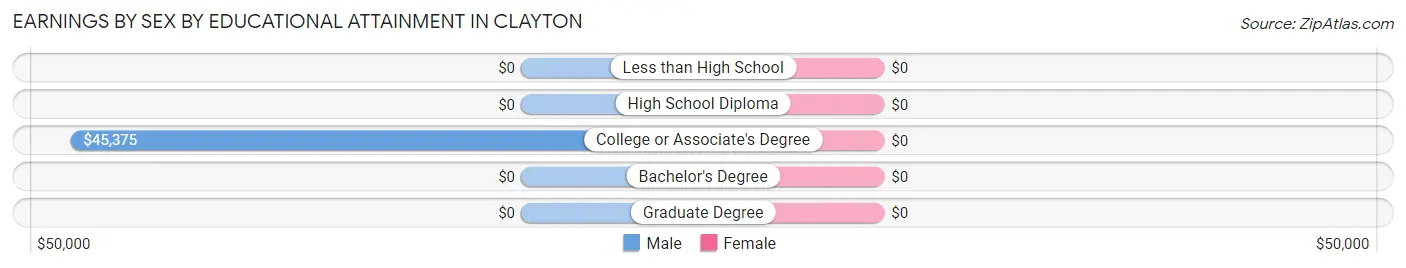
| Educational Attainment | Male Income | Female Income |
| Less than High School | - | - |
| High School Diploma | - | - |
| College or Associate's Degree | $45,375 | $0 |
| Bachelor's Degree | - | - |
| Graduate Degree | - | - |
| Total | $45,375 | $33,267 |
Family Income in Clayton
Family Income Brackets in Clayton
According to the Clayton family income data, there are 39 families falling into the $35,000 to $49,999 income range, which is the most common income bracket and makes up 75.0% of all families.
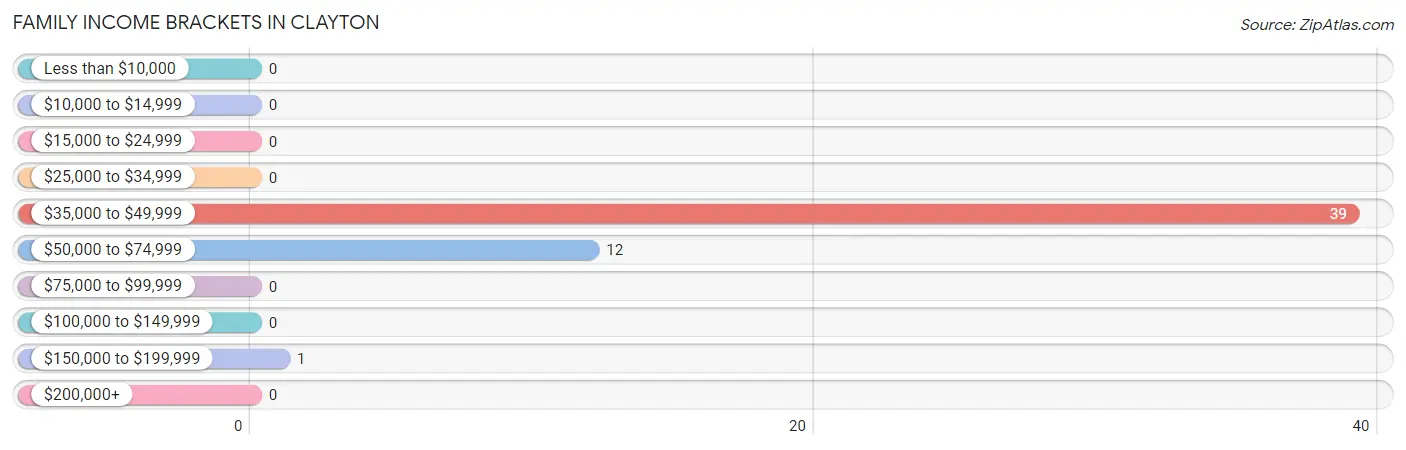
| Income Bracket | # Families | % Families |
| Less than $10,000 | 0 | 0.0% |
| $10,000 to $14,999 | 0 | 0.0% |
| $15,000 to $24,999 | 0 | 0.0% |
| $25,000 to $34,999 | 0 | 0.0% |
| $35,000 to $49,999 | 39 | 75.0% |
| $50,000 to $74,999 | 12 | 23.1% |
| $75,000 to $99,999 | 0 | 0.0% |
| $100,000 to $149,999 | 0 | 0.0% |
| $150,000 to $199,999 | 1 | 1.9% |
| $200,000+ | 0 | 0.0% |
Family Income by Famaliy Size in Clayton
| Income Bracket | # Families | Median Income |
| 2-Person Families | 46 (88.5%) | $0 |
| 3-Person Families | 0 (0.0%) | $0 |
| 4-Person Families | 5 (9.6%) | $0 |
| 5-Person Families | 0 (0.0%) | $0 |
| 6-Person Families | 0 (0.0%) | $0 |
| 7+ Person Families | 1 (1.9%) | $0 |
| Total | 52 (100.0%) | $46,667 |
Family Income by Number of Earners in Clayton
| Number of Earners | # Families | Median Income |
| No Earners | 0 (0.0%) | $0 |
| 1 Earner | 34 (65.4%) | $0 |
| 2 Earners | 18 (34.6%) | $0 |
| 3+ Earners | 0 (0.0%) | $0 |
| Total | 52 (100.0%) | $46,667 |
Household Income in Clayton
Household Income Brackets in Clayton
With 39 households falling in the category, the $35,000 to $49,999 income range is the most frequent in Clayton, accounting for 75.0% of all households.
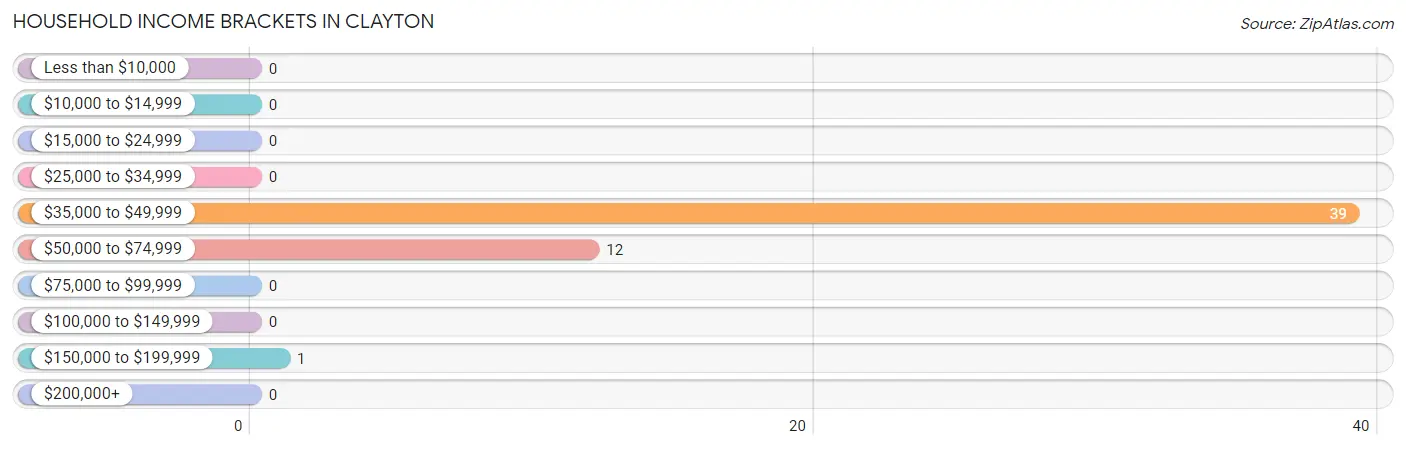
| Income Bracket | # Households | % Households |
| Less than $10,000 | 0 | 0.0% |
| $10,000 to $14,999 | 0 | 0.0% |
| $15,000 to $24,999 | 0 | 0.0% |
| $25,000 to $34,999 | 0 | 0.0% |
| $35,000 to $49,999 | 39 | 75.0% |
| $50,000 to $74,999 | 12 | 23.1% |
| $75,000 to $99,999 | 0 | 0.0% |
| $100,000 to $149,999 | 0 | 0.0% |
| $150,000 to $199,999 | 1 | 1.9% |
| $200,000+ | 0 | 0.0% |
Household Income by Householder Age in Clayton
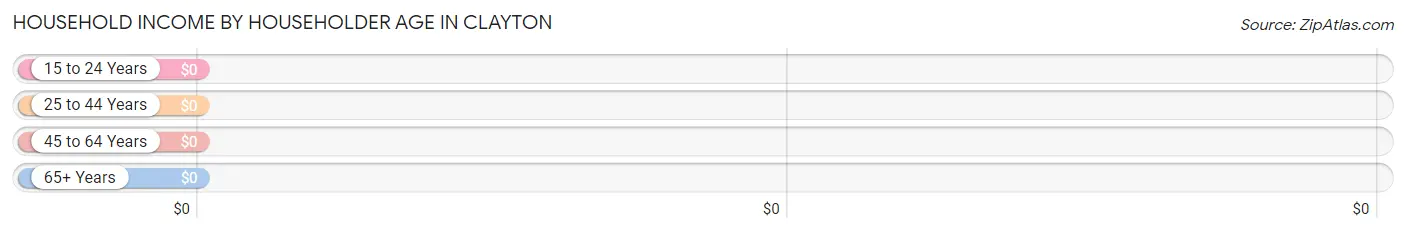
| Income Bracket | # Households | Median Income |
| 15 to 24 Years | 0 (0.0%) | $0 |
| 25 to 44 Years | 5 (9.6%) | $0 |
| 45 to 64 Years | 1 (1.9%) | $0 |
| 65+ Years | 46 (88.5%) | $0 |
| Total | 52 (100.0%) | $46,667 |
Poverty in Clayton
Income Below Poverty by Sex and Age in Clayton
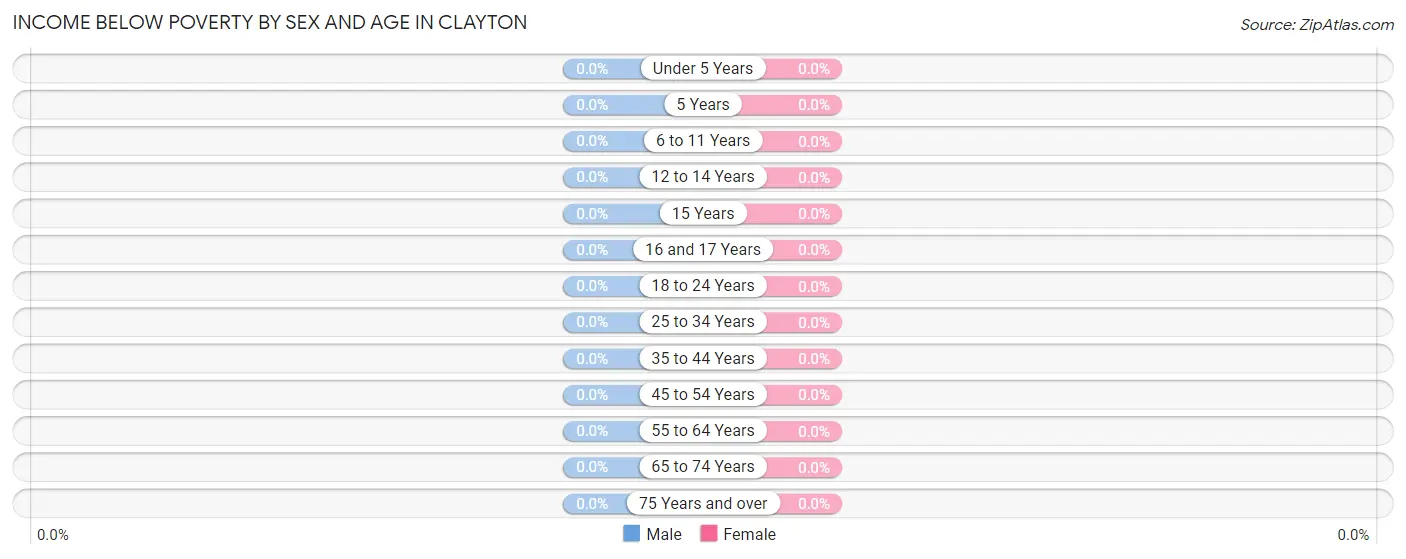
| Age Bracket | Male | Female |
| Under 5 Years | 0 (0.0%) | 0 (0.0%) |
| 5 Years | 0 (0.0%) | 0 (0.0%) |
| 6 to 11 Years | 0 (0.0%) | 0 (0.0%) |
| 12 to 14 Years | 0 (0.0%) | 0 (0.0%) |
| 15 Years | 0 (0.0%) | 0 (0.0%) |
| 16 and 17 Years | 0 (0.0%) | 0 (0.0%) |
| 18 to 24 Years | 0 (0.0%) | 0 (0.0%) |
| 25 to 34 Years | 0 (0.0%) | 0 (0.0%) |
| 35 to 44 Years | 0 (0.0%) | 0 (0.0%) |
| 45 to 54 Years | 0 (0.0%) | 0 (0.0%) |
| 55 to 64 Years | 0 (0.0%) | 0 (0.0%) |
| 65 to 74 Years | 0 (0.0%) | 0 (0.0%) |
| 75 Years and over | 0 (0.0%) | 0 (0.0%) |
| Total | 0 (0.0%) | 0 (0.0%) |
Income Above Poverty by Sex and Age in Clayton
According to the poverty statistics in Clayton, males aged 12 to 14 years and females aged 6 to 11 years are the age groups that are most secure financially, with 100.0% of males and 100.0% of females in these age groups living above the poverty line.
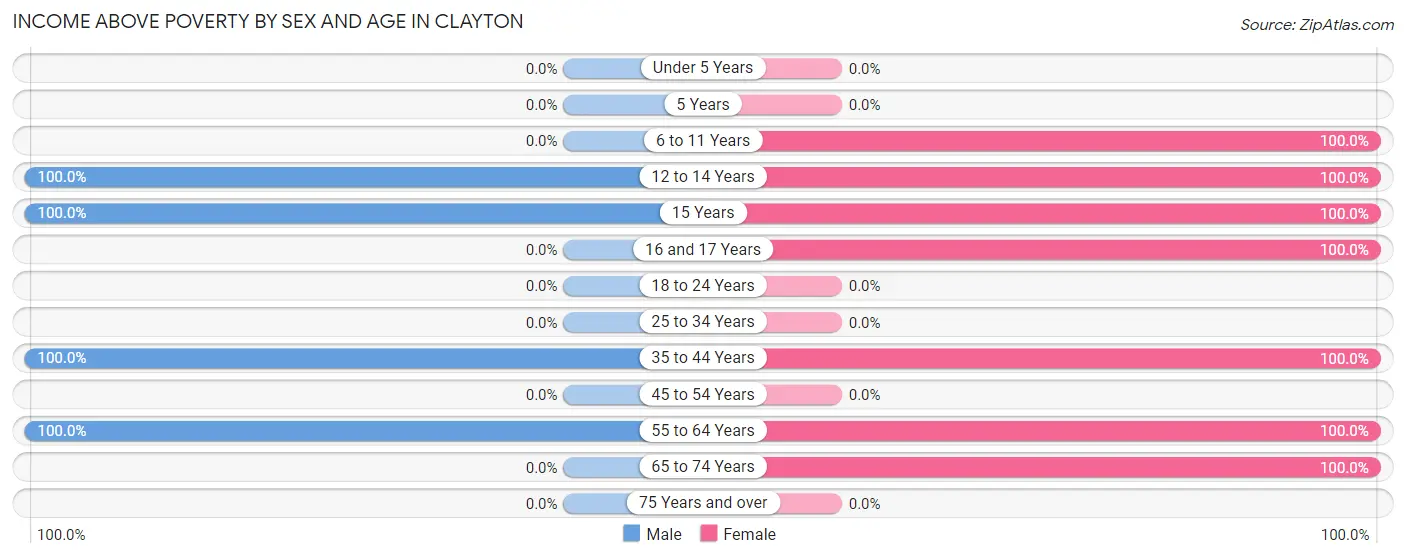
| Age Bracket | Male | Female |
| Under 5 Years | 0 (0.0%) | 0 (0.0%) |
| 5 Years | 0 (0.0%) | 0 (0.0%) |
| 6 to 11 Years | 0 (0.0%) | 3 (100.0%) |
| 12 to 14 Years | 1 (100.0%) | 3 (100.0%) |
| 15 Years | 1 (100.0%) | 1 (100.0%) |
| 16 and 17 Years | 0 (0.0%) | 2 (100.0%) |
| 18 to 24 Years | 0 (0.0%) | 0 (0.0%) |
| 25 to 34 Years | 0 (0.0%) | 0 (0.0%) |
| 35 to 44 Years | 9 (100.0%) | 49 (100.0%) |
| 45 to 54 Years | 0 (0.0%) | 0 (0.0%) |
| 55 to 64 Years | 11 (100.0%) | 1 (100.0%) |
| 65 to 74 Years | 0 (0.0%) | 46 (100.0%) |
| 75 Years and over | 0 (0.0%) | 0 (0.0%) |
| Total | 22 (100.0%) | 105 (100.0%) |
Income Below Poverty Among Married-Couple Families in Clayton
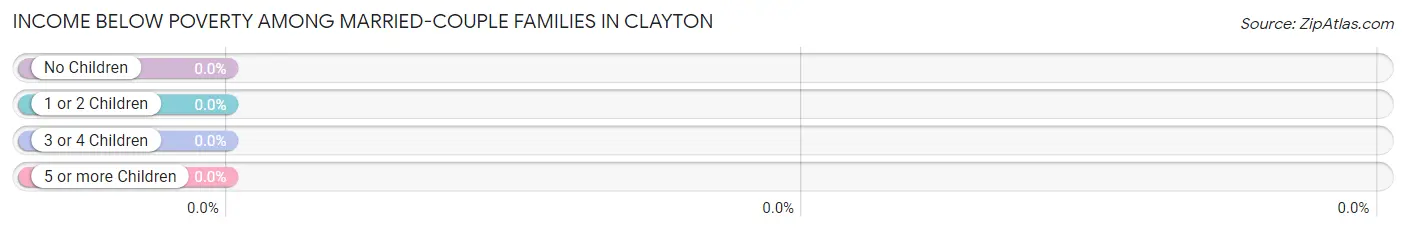
| Children | Above Poverty | Below Poverty |
| No Children | 12 (100.0%) | 0 (0.0%) |
| 1 or 2 Children | 5 (100.0%) | 0 (0.0%) |
| 3 or 4 Children | 0 (0.0%) | 0 (0.0%) |
| 5 or more Children | 1 (100.0%) | 0 (0.0%) |
| Total | 18 (100.0%) | 0 (0.0%) |
Income Below Poverty Among Single-Parent Households in Clayton
| Children | Single Father | Single Mother |
| No Children | 0 (0.0%) | 0 (0.0%) |
| 1 or 2 Children | 0 (0.0%) | 0 (0.0%) |
| 3 or 4 Children | 0 (0.0%) | 0 (0.0%) |
| 5 or more Children | 0 (0.0%) | 0 (0.0%) |
| Total | 0 (0.0%) | 0 (0.0%) |
Income Below Poverty Among Married-Couple vs Single-Parent Households in Clayton
| Children | Married-Couple Families | Single-Parent Households |
| No Children | 0 (0.0%) | 0 (0.0%) |
| 1 or 2 Children | 0 (0.0%) | 0 (0.0%) |
| 3 or 4 Children | 0 (0.0%) | 0 (0.0%) |
| 5 or more Children | 0 (0.0%) | 0 (0.0%) |
| Total | 0 (0.0%) | 0 (0.0%) |
Race in Clayton
The most populous races in Clayton are White / Caucasian (118 | 92.9%), and Native / Alaskan (9 | 7.1%).
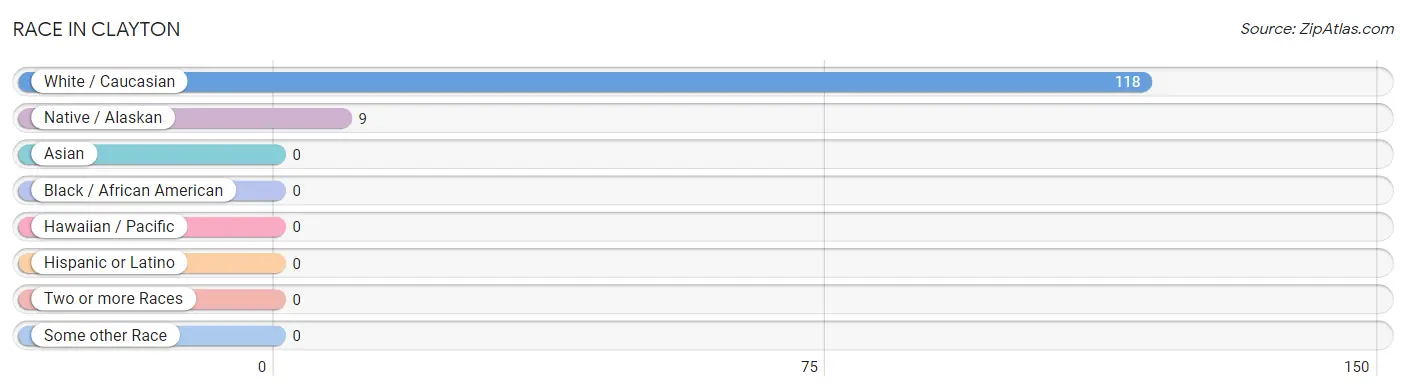
| Race | # Population | % Population |
| Asian | 0 | 0.0% |
| Black / African American | 0 | 0.0% |
| Hawaiian / Pacific | 0 | 0.0% |
| Hispanic or Latino | 0 | 0.0% |
| Native / Alaskan | 9 | 7.1% |
| White / Caucasian | 118 | 92.9% |
| Two or more Races | 0 | 0.0% |
| Some other Race | 0 | 0.0% |
| Total | 127 | 100.0% |
Ancestry in Clayton
The most populous ancestries reported in Clayton are English (85 | 66.9%), Irish (77 | 60.6%), American (11 | 8.7%), and Colville (9 | 7.1%), together accounting for 143.3% of all Clayton residents.
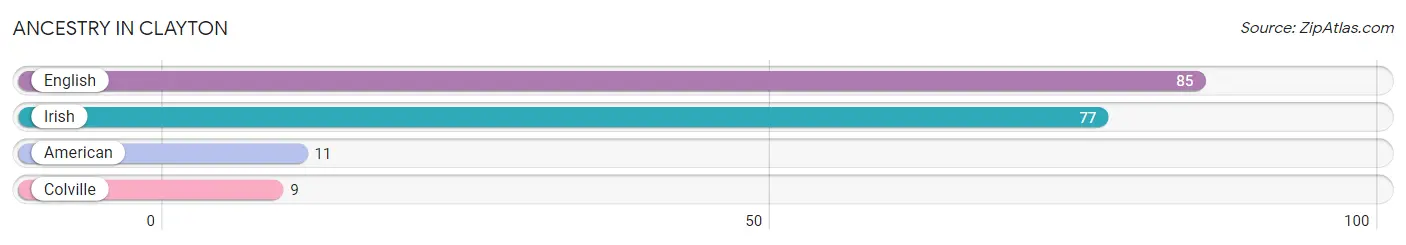
| Ancestry | # Population | % Population |
| American | 11 | 8.7% |
| Colville | 9 | 7.1% |
| English | 85 | 66.9% |
| Irish | 77 | 60.6% | View All 4 Rows |
Immigrants in Clayton

| Immigration Origin | # Population | % Population | View All 0 Rows |
Sex and Age in Clayton
Sex and Age in Clayton
The most populous age groups in Clayton are 60 to 64 Years (11 | 50.0%) for men and 35 to 39 Years (49 | 46.7%) for women.
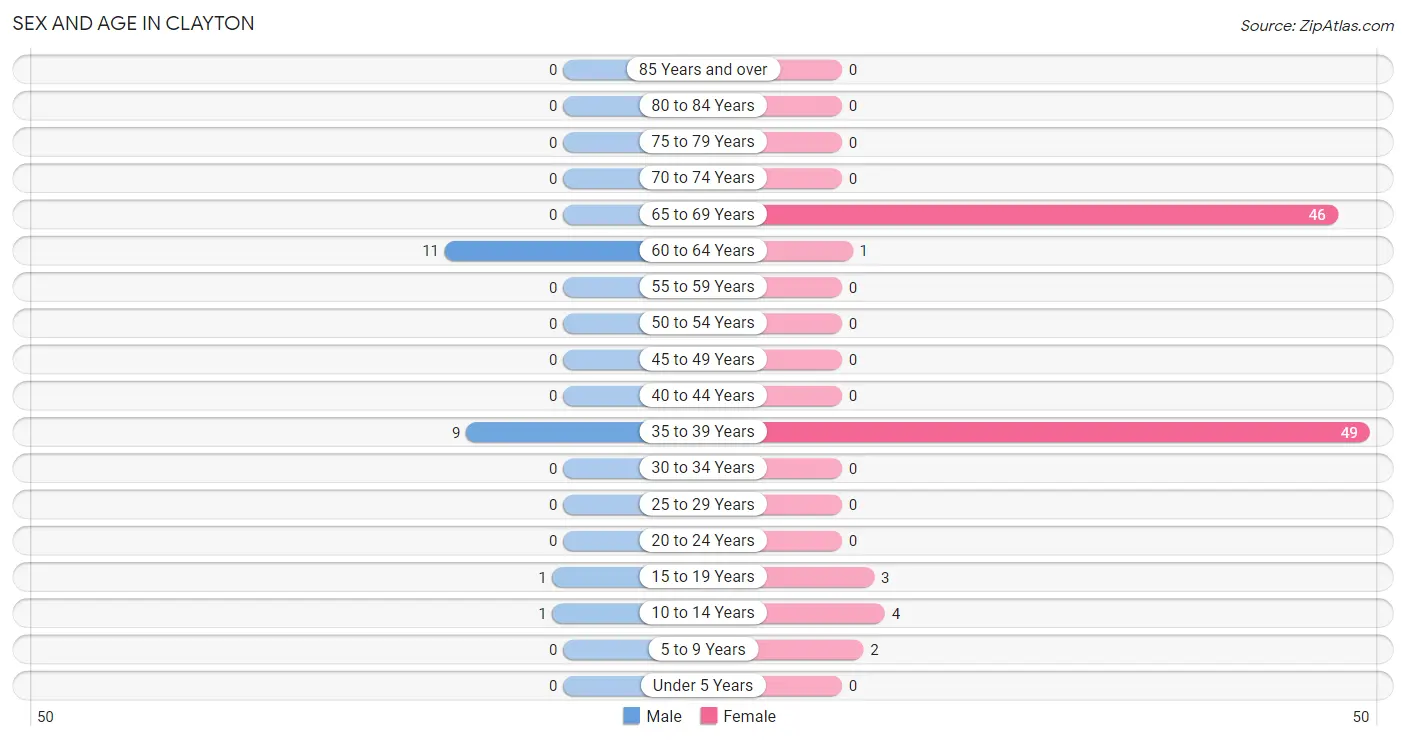
| Age Bracket | Male | Female |
| Under 5 Years | 0 (0.0%) | 0 (0.0%) |
| 5 to 9 Years | 0 (0.0%) | 2 (1.9%) |
| 10 to 14 Years | 1 (4.5%) | 4 (3.8%) |
| 15 to 19 Years | 1 (4.5%) | 3 (2.9%) |
| 20 to 24 Years | 0 (0.0%) | 0 (0.0%) |
| 25 to 29 Years | 0 (0.0%) | 0 (0.0%) |
| 30 to 34 Years | 0 (0.0%) | 0 (0.0%) |
| 35 to 39 Years | 9 (40.9%) | 49 (46.7%) |
| 40 to 44 Years | 0 (0.0%) | 0 (0.0%) |
| 45 to 49 Years | 0 (0.0%) | 0 (0.0%) |
| 50 to 54 Years | 0 (0.0%) | 0 (0.0%) |
| 55 to 59 Years | 0 (0.0%) | 0 (0.0%) |
| 60 to 64 Years | 11 (50.0%) | 1 (0.9%) |
| 65 to 69 Years | 0 (0.0%) | 46 (43.8%) |
| 70 to 74 Years | 0 (0.0%) | 0 (0.0%) |
| 75 to 79 Years | 0 (0.0%) | 0 (0.0%) |
| 80 to 84 Years | 0 (0.0%) | 0 (0.0%) |
| 85 Years and over | 0 (0.0%) | 0 (0.0%) |
| Total | 22 (100.0%) | 105 (100.0%) |
Families and Households in Clayton
Median Family Size in Clayton
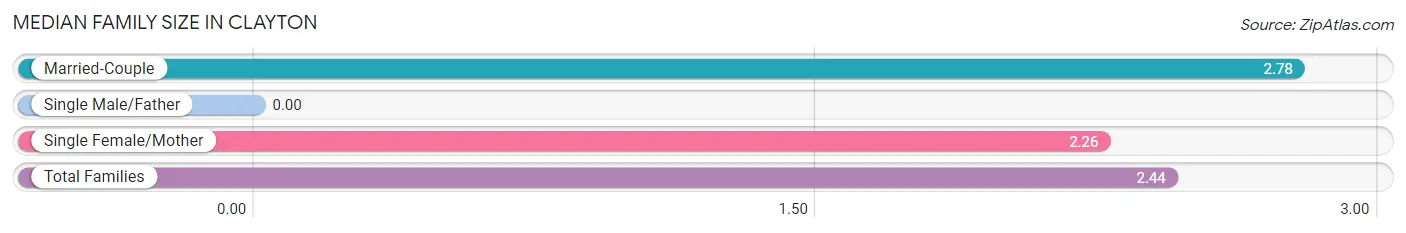
| Family Type | # Families | Family Size |
| Married-Couple | 18 (34.6%) | 2.78 |
| Single Male/Father | 0 (0.0%) | - |
| Single Female/Mother | 34 (65.4%) | 2.26 |
| Total Families | 52 (100.0%) | 2.44 |
Median Household Size in Clayton
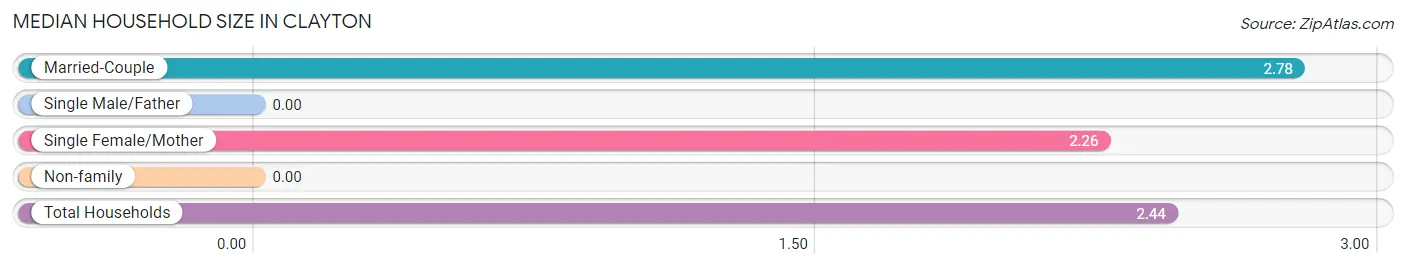
| Household Type | # Households | Household Size |
| Married-Couple | 18 (34.6%) | 2.78 |
| Single Male/Father | 0 (0.0%) | - |
| Single Female/Mother | 34 (65.4%) | 2.26 |
| Non-family | 0 (0.0%) | - |
| Total Households | 52 (100.0%) | 2.44 |
Household Size by Marriage Status in Clayton
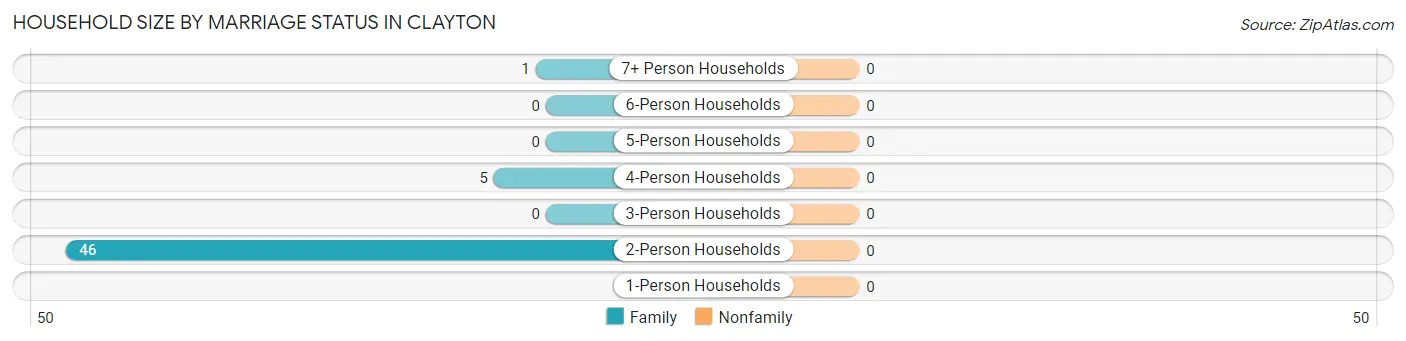
| Household Size | Family Households | Nonfamily Households |
| 1-Person Households | - | 0 (0.0%) |
| 2-Person Households | 46 (88.5%) | 0 (0.0%) |
| 3-Person Households | 0 (0.0%) | 0 (0.0%) |
| 4-Person Households | 5 (9.6%) | 0 (0.0%) |
| 5-Person Households | 0 (0.0%) | 0 (0.0%) |
| 6-Person Households | 0 (0.0%) | 0 (0.0%) |
| 7+ Person Households | 1 (1.9%) | 0 (0.0%) |
| Total | 52 (100.0%) | 0 (0.0%) |
Female Fertility in Clayton
Fertility by Age in Clayton
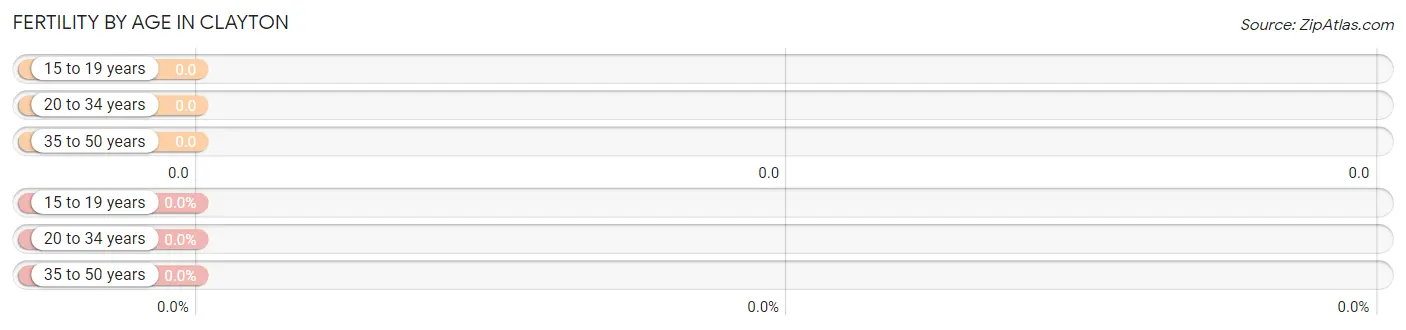
| Age Bracket | Women with Births | Births / 1,000 Women |
| 15 to 19 years | 0 (0.0%) | 0.0 |
| 20 to 34 years | 0 (0.0%) | 0.0 |
| 35 to 50 years | 0 (0.0%) | 0.0 |
| Total | 0 (0.0%) | 0.0 |
Fertility by Age by Marriage Status in Clayton
| Age Bracket | Married | Unmarried |
| 15 to 19 years | 0 (0.0%) | 0 (0.0%) |
| 20 to 34 years | 0 (0.0%) | 0 (0.0%) |
| 35 to 50 years | 0 (0.0%) | 0 (0.0%) |
| Total | 0 (0.0%) | 0 (0.0%) |
Fertility by Education in Clayton
| Educational Attainment | Women with Births | Births / 1,000 Women |
| Less than High School | 0 (0.0%) | 0.0 |
| High School Diploma | 0 (0.0%) | 0.0 |
| College or Associate's Degree | 0 (0.0%) | 0.0 |
| Bachelor's Degree | 0 (0.0%) | 0.0 |
| Graduate Degree | 0 (0.0%) | 0.0 |
| Total | 0 (0.0%) | 0.0 |
Fertility by Education by Marriage Status in Clayton
| Educational Attainment | Married | Unmarried |
| Less than High School | 0 (0.0%) | 0 (0.0%) |
| High School Diploma | 0 (0.0%) | 0 (0.0%) |
| College or Associate's Degree | 0 (0.0%) | 0 (0.0%) |
| Bachelor's Degree | 0 (0.0%) | 0 (0.0%) |
| Graduate Degree | 0 (0.0%) | 0 (0.0%) |
| Total | 0 (0.0%) | 0 (0.0%) |
Employment Characteristics in Clayton
Employment by Class of Employer in Clayton
Among the 75 employed individuals in Clayton, private company employees (73 | 97.3%), self-employed (not incorporated) (1 | 1.3%), and local government employees (1 | 1.3%) make up the most common classes of employment.
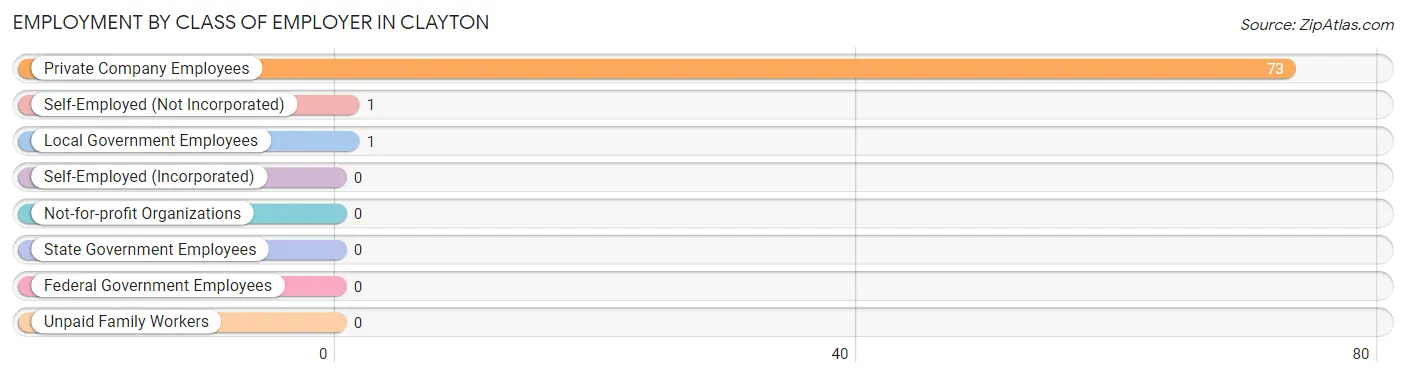
| Employer Class | # Employees | % Employees |
| Private Company Employees | 73 | 97.3% |
| Self-Employed (Incorporated) | 0 | 0.0% |
| Self-Employed (Not Incorporated) | 1 | 1.3% |
| Not-for-profit Organizations | 0 | 0.0% |
| Local Government Employees | 1 | 1.3% |
| State Government Employees | 0 | 0.0% |
| Federal Government Employees | 0 | 0.0% |
| Unpaid Family Workers | 0 | 0.0% |
| Total | 75 | 100.0% |
Employment Status by Age in Clayton
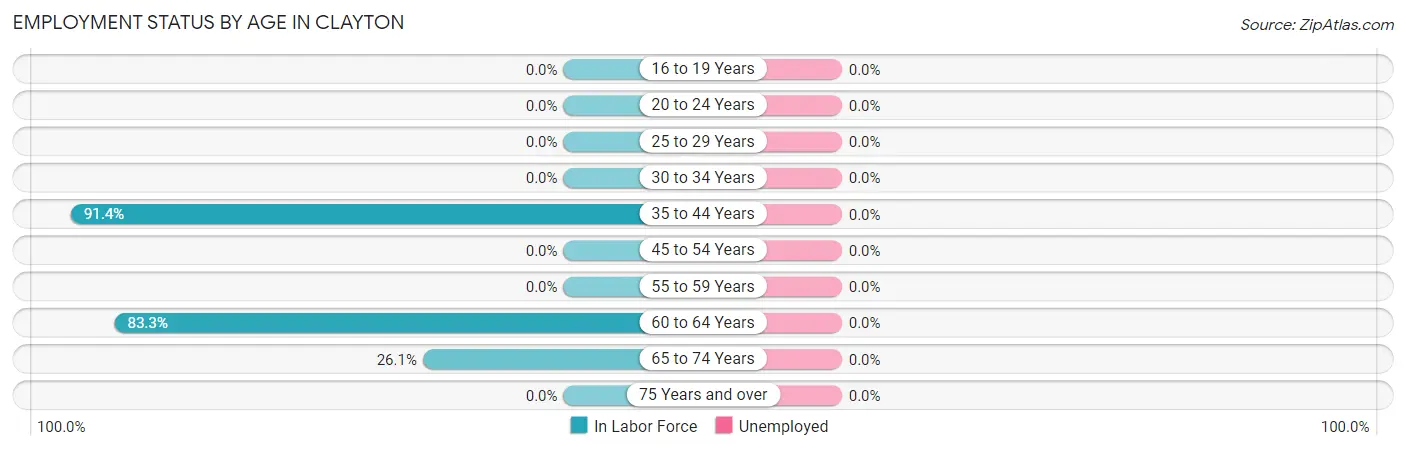
| Age Bracket | In Labor Force | Unemployed |
| 16 to 19 Years | 0 (0.0%) | 0 (0.0%) |
| 20 to 24 Years | 0 (0.0%) | 0 (0.0%) |
| 25 to 29 Years | 0 (0.0%) | 0 (0.0%) |
| 30 to 34 Years | 0 (0.0%) | 0 (0.0%) |
| 35 to 44 Years | 53 (91.4%) | 0 (0.0%) |
| 45 to 54 Years | 0 (0.0%) | 0 (0.0%) |
| 55 to 59 Years | 0 (0.0%) | 0 (0.0%) |
| 60 to 64 Years | 10 (83.3%) | 0 (0.0%) |
| 65 to 74 Years | 12 (26.1%) | 0 (0.0%) |
| 75 Years and over | 0 (0.0%) | 0 (0.0%) |
| Total | 75 (63.6%) | 0 (0.0%) |
Employment Status by Educational Attainment in Clayton
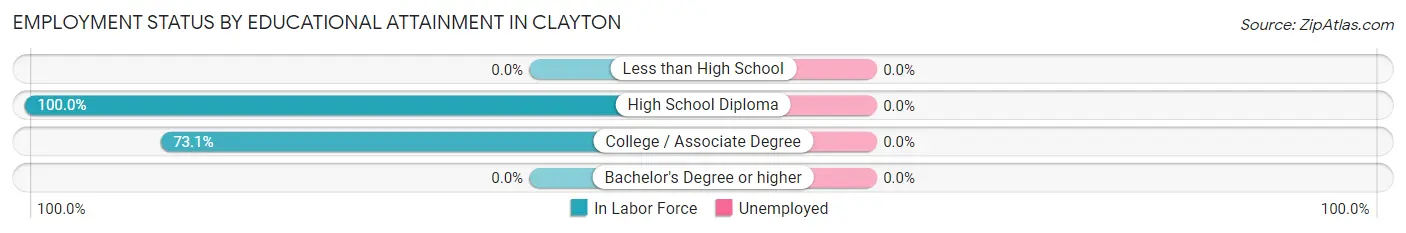
| Educational Attainment | In Labor Force | Unemployed |
| Less than High School | 0 (0.0%) | 0 (0.0%) |
| High School Diploma | 44 (100.0%) | 0 (0.0%) |
| College / Associate Degree | 19 (73.1%) | 0 (0.0%) |
| Bachelor's Degree or higher | 0 (0.0%) | 0 (0.0%) |
| Total | 63 (90.0%) | 0 (0.0%) |
Employment Occupations by Sex in Clayton
Management, Business, Science and Arts Occupations
The most common Management, Business, Science and Arts occupations in Clayton are , and Management (1 | 1.3%).
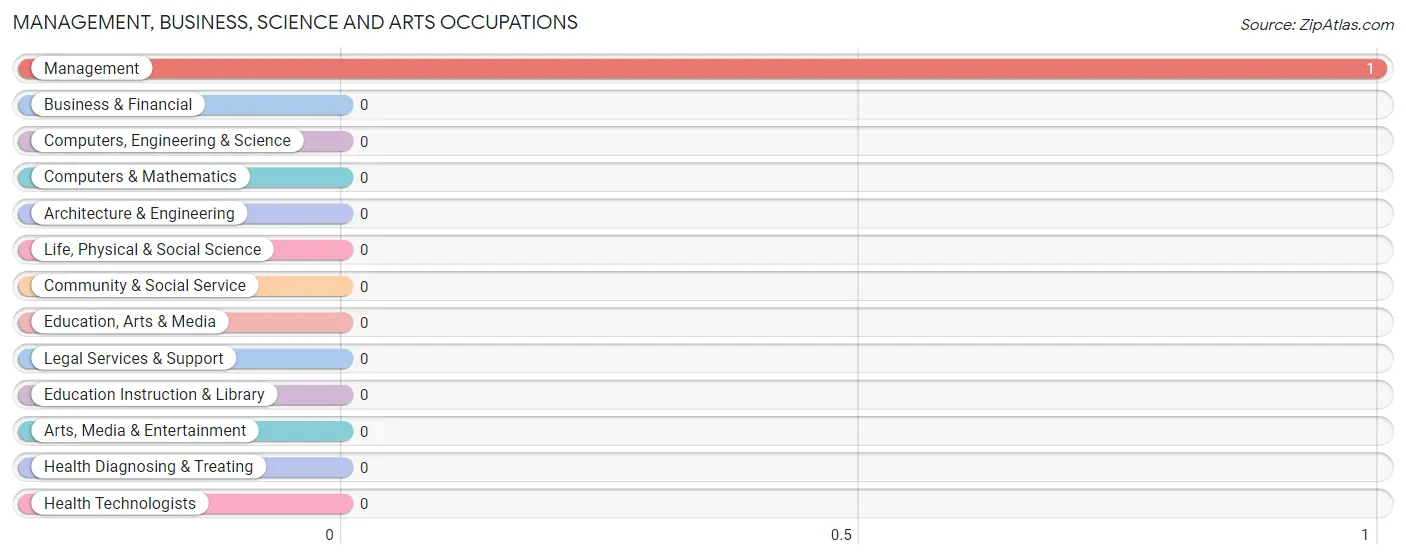
Management, Business, Science and Arts Occupations by Sex
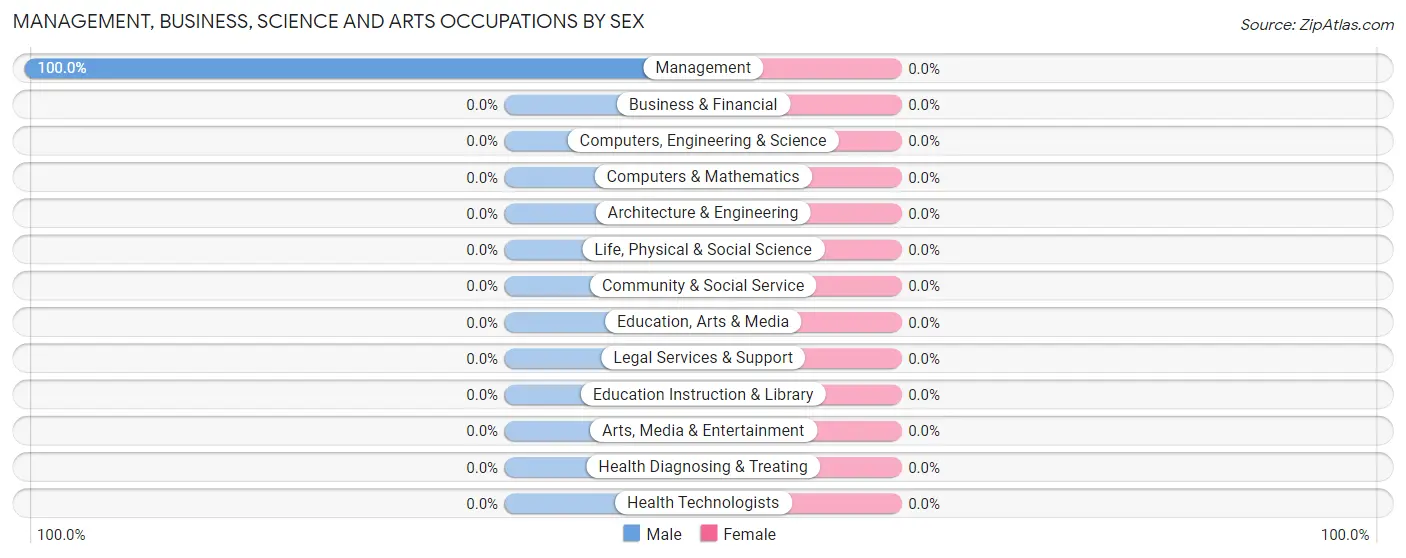
| Occupation | Male | Female |
| Management | 1 (100.0%) | 0 (0.0%) |
| Business & Financial | 0 (0.0%) | 0 (0.0%) |
| Computers, Engineering & Science | 0 (0.0%) | 0 (0.0%) |
| Computers & Mathematics | 0 (0.0%) | 0 (0.0%) |
| Architecture & Engineering | 0 (0.0%) | 0 (0.0%) |
| Life, Physical & Social Science | 0 (0.0%) | 0 (0.0%) |
| Community & Social Service | 0 (0.0%) | 0 (0.0%) |
| Education, Arts & Media | 0 (0.0%) | 0 (0.0%) |
| Legal Services & Support | 0 (0.0%) | 0 (0.0%) |
| Education Instruction & Library | 0 (0.0%) | 0 (0.0%) |
| Arts, Media & Entertainment | 0 (0.0%) | 0 (0.0%) |
| Health Diagnosing & Treating | 0 (0.0%) | 0 (0.0%) |
| Health Technologists | 0 (0.0%) | 0 (0.0%) |
| Total (Category) | 1 (100.0%) | 0 (0.0%) |
| Total (Overall) | 19 (25.3%) | 56 (74.7%) |
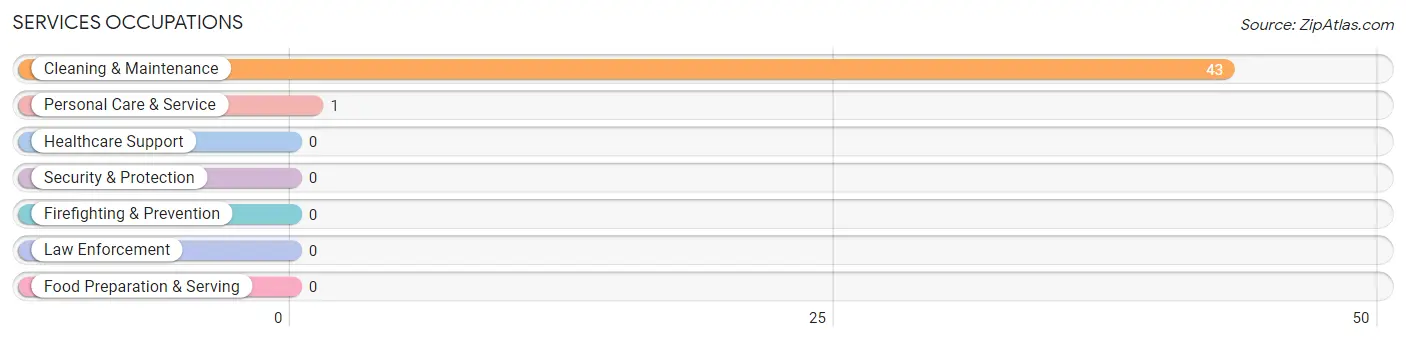
Services Occupations
The most common Services occupations in Clayton are Cleaning & Maintenance (43 | 57.3%), and Personal Care & Service (1 | 1.3%).
Services Occupations by Sex
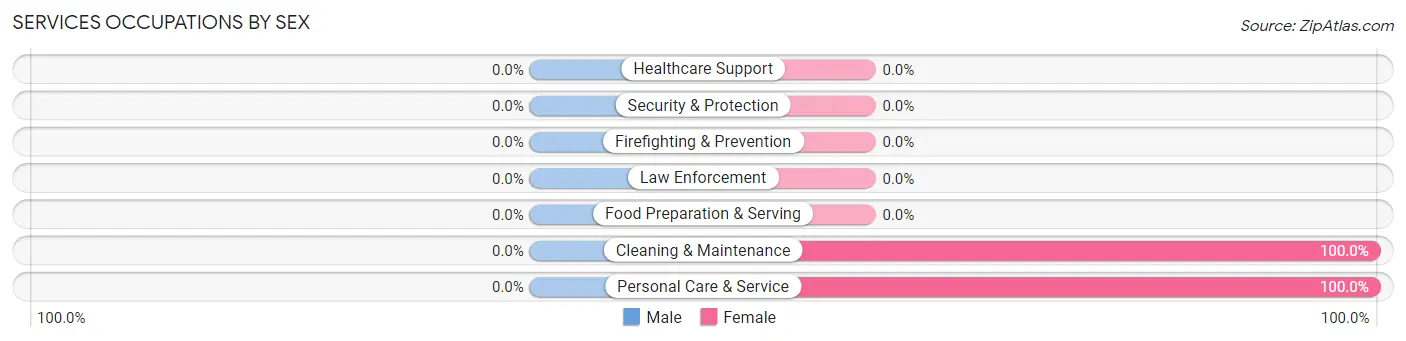
| Occupation | Male | Female |
| Healthcare Support | 0 (0.0%) | 0 (0.0%) |
| Security & Protection | 0 (0.0%) | 0 (0.0%) |
| Firefighting & Prevention | 0 (0.0%) | 0 (0.0%) |
| Law Enforcement | 0 (0.0%) | 0 (0.0%) |
| Food Preparation & Serving | 0 (0.0%) | 0 (0.0%) |
| Cleaning & Maintenance | 0 (0.0%) | 43 (100.0%) |
| Personal Care & Service | 0 (0.0%) | 1 (100.0%) |
| Total (Category) | 0 (0.0%) | 44 (100.0%) |
| Total (Overall) | 19 (25.3%) | 56 (74.7%) |
Sales and Office Occupations
The most common Sales and Office occupations in Clayton are , and Office & Administration (12 | 16.0%).
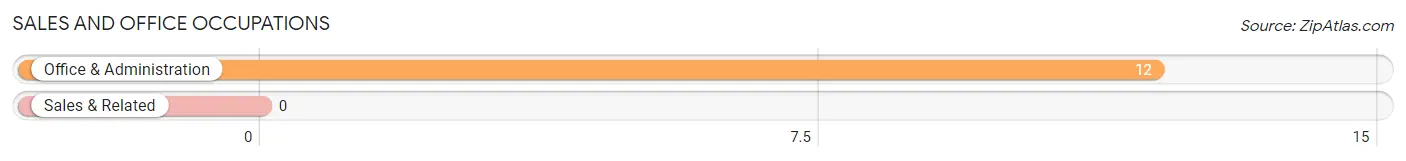
Sales and Office Occupations by Sex
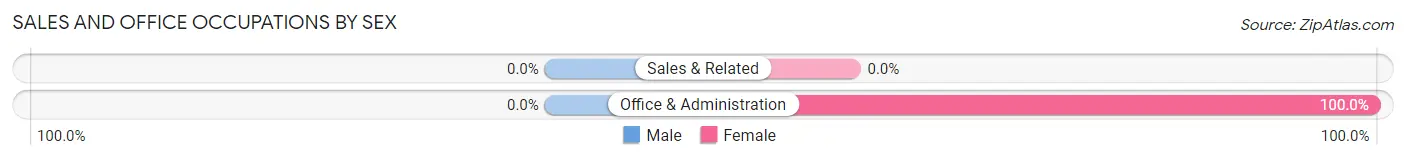
| Occupation | Male | Female |
| Sales & Related | 0 (0.0%) | 0 (0.0%) |
| Office & Administration | 0 (0.0%) | 12 (100.0%) |
| Total (Category) | 0 (0.0%) | 12 (100.0%) |
| Total (Overall) | 19 (25.3%) | 56 (74.7%) |
Natural Resources, Construction and Maintenance Occupations
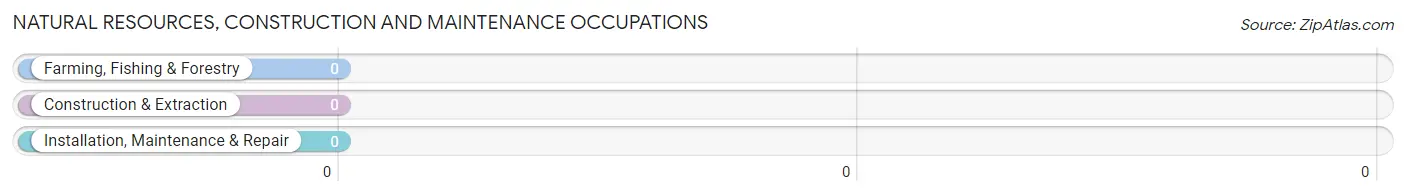
Natural Resources, Construction and Maintenance Occupations by Sex
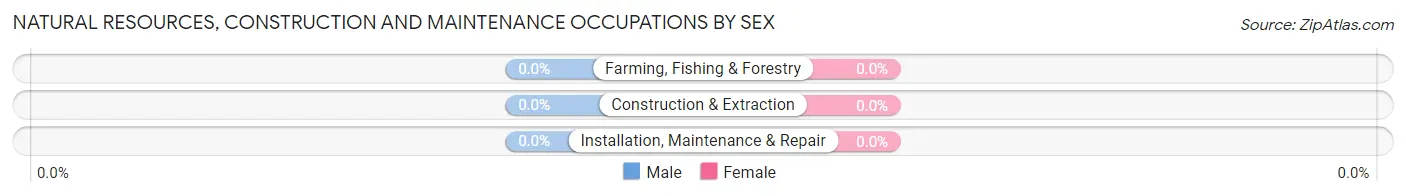
| Occupation | Male | Female |
| Farming, Fishing & Forestry | 0 (0.0%) | 0 (0.0%) |
| Construction & Extraction | 0 (0.0%) | 0 (0.0%) |
| Installation, Maintenance & Repair | 0 (0.0%) | 0 (0.0%) |
| Total (Category) | 0 (0.0%) | 0 (0.0%) |
| Total (Overall) | 19 (25.3%) | 56 (74.7%) |
Production, Transportation and Moving Occupations
The most common Production, Transportation and Moving occupations in Clayton are Transportation (10 | 13.3%), and Production (8 | 10.7%).
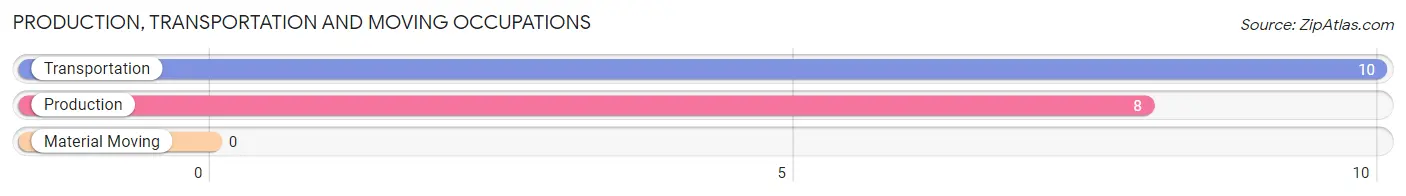
Production, Transportation and Moving Occupations by Sex
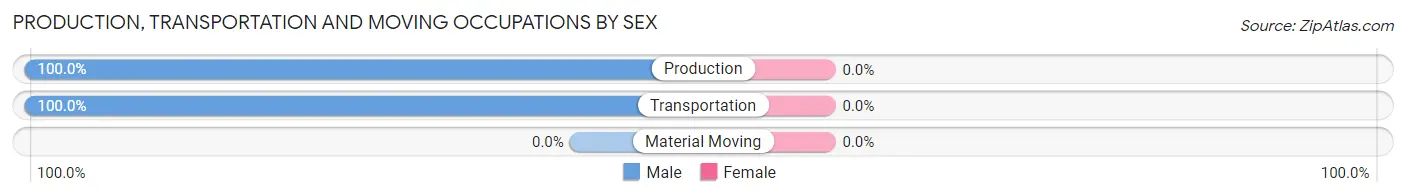
| Occupation | Male | Female |
| Production | 8 (100.0%) | 0 (0.0%) |
| Transportation | 10 (100.0%) | 0 (0.0%) |
| Material Moving | 0 (0.0%) | 0 (0.0%) |
| Total (Category) | 18 (100.0%) | 0 (0.0%) |
| Total (Overall) | 19 (25.3%) | 56 (74.7%) |
Employment Industries by Sex in Clayton
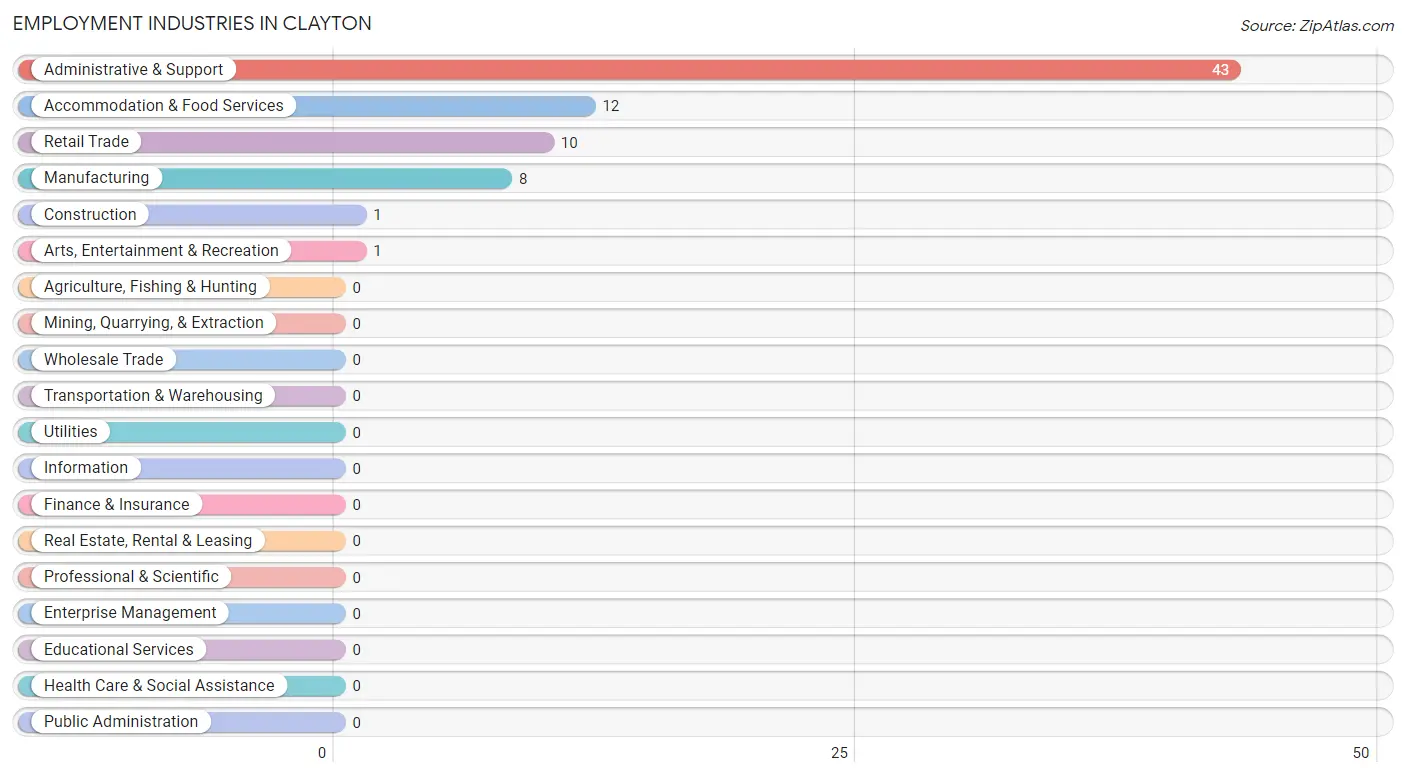
Employment Industries in Clayton
The major employment industries in Clayton include Administrative & Support (43 | 57.3%), Accommodation & Food Services (12 | 16.0%), Retail Trade (10 | 13.3%), Manufacturing (8 | 10.7%), and Construction (1 | 1.3%).
Employment Industries by Sex in Clayton
The Clayton industries that see more men than women are Construction (100.0%), Manufacturing (100.0%), and Retail Trade (100.0%), whereas the industries that tend to have a higher number of women are Administrative & Support (100.0%), Arts, Entertainment & Recreation (100.0%), and Accommodation & Food Services (100.0%).
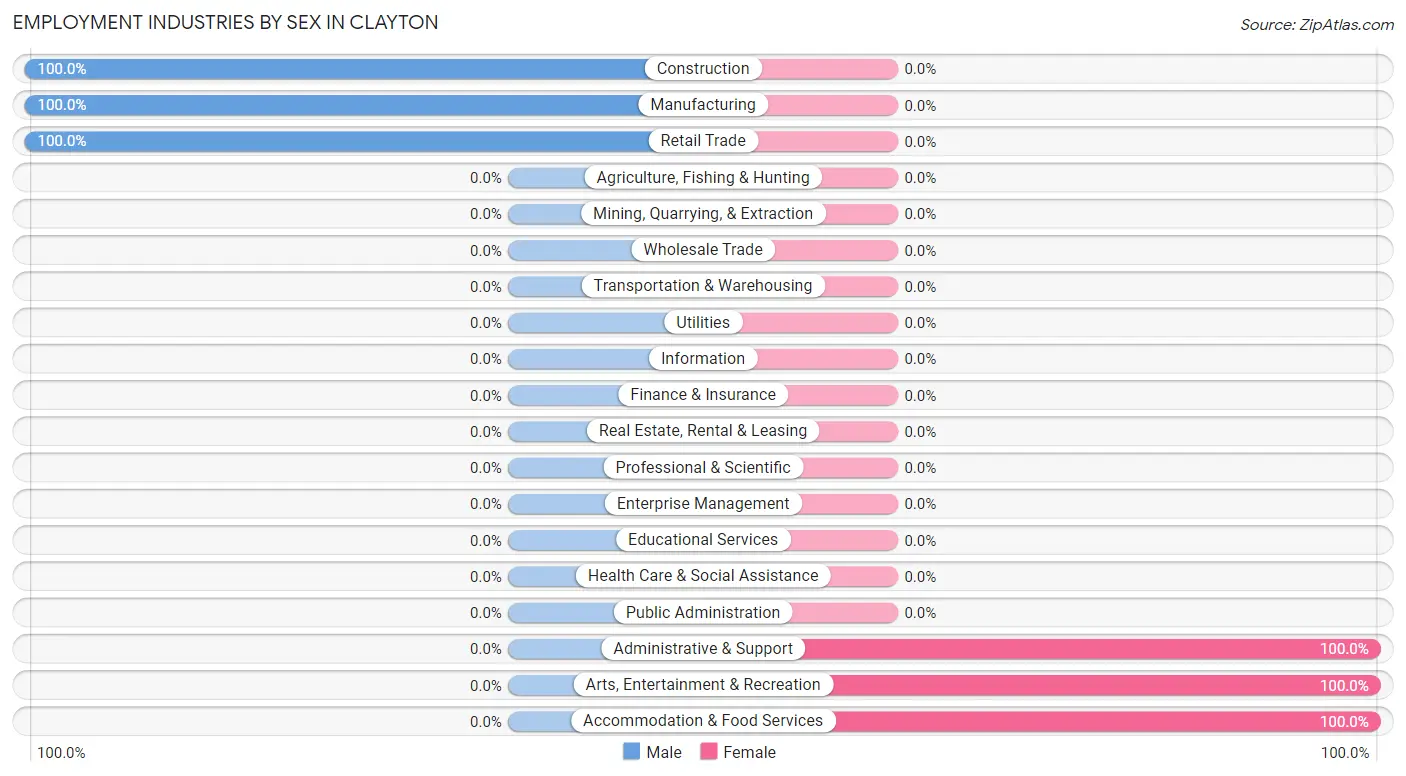
| Industry | Male | Female |
| Agriculture, Fishing & Hunting | 0 (0.0%) | 0 (0.0%) |
| Mining, Quarrying, & Extraction | 0 (0.0%) | 0 (0.0%) |
| Construction | 1 (100.0%) | 0 (0.0%) |
| Manufacturing | 8 (100.0%) | 0 (0.0%) |
| Wholesale Trade | 0 (0.0%) | 0 (0.0%) |
| Retail Trade | 10 (100.0%) | 0 (0.0%) |
| Transportation & Warehousing | 0 (0.0%) | 0 (0.0%) |
| Utilities | 0 (0.0%) | 0 (0.0%) |
| Information | 0 (0.0%) | 0 (0.0%) |
| Finance & Insurance | 0 (0.0%) | 0 (0.0%) |
| Real Estate, Rental & Leasing | 0 (0.0%) | 0 (0.0%) |
| Professional & Scientific | 0 (0.0%) | 0 (0.0%) |
| Enterprise Management | 0 (0.0%) | 0 (0.0%) |
| Administrative & Support | 0 (0.0%) | 43 (100.0%) |
| Educational Services | 0 (0.0%) | 0 (0.0%) |
| Health Care & Social Assistance | 0 (0.0%) | 0 (0.0%) |
| Arts, Entertainment & Recreation | 0 (0.0%) | 1 (100.0%) |
| Accommodation & Food Services | 0 (0.0%) | 12 (100.0%) |
| Public Administration | 0 (0.0%) | 0 (0.0%) |
| Total | 19 (25.3%) | 56 (74.7%) |
Education in Clayton
School Enrollment in Clayton
The most common levels of schooling among the 11 students in Clayton are middle school (5 | 45.5%), high school (4 | 36.4%), and elementary school (2 | 18.2%).
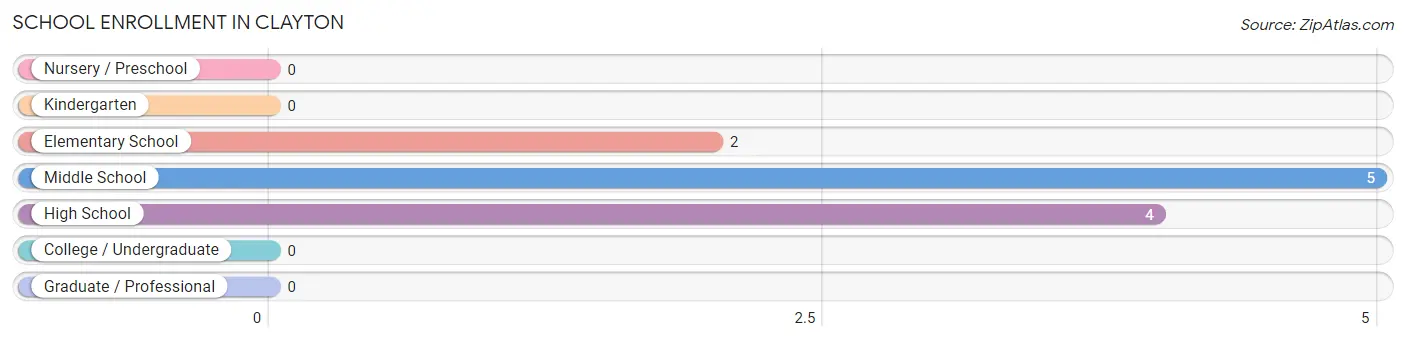
| School Level | # Students | % Students |
| Nursery / Preschool | 0 | 0.0% |
| Kindergarten | 0 | 0.0% |
| Elementary School | 2 | 18.2% |
| Middle School | 5 | 45.5% |
| High School | 4 | 36.4% |
| College / Undergraduate | 0 | 0.0% |
| Graduate / Professional | 0 | 0.0% |
| Total | 11 | 100.0% |
School Enrollment by Age by Funding Source in Clayton
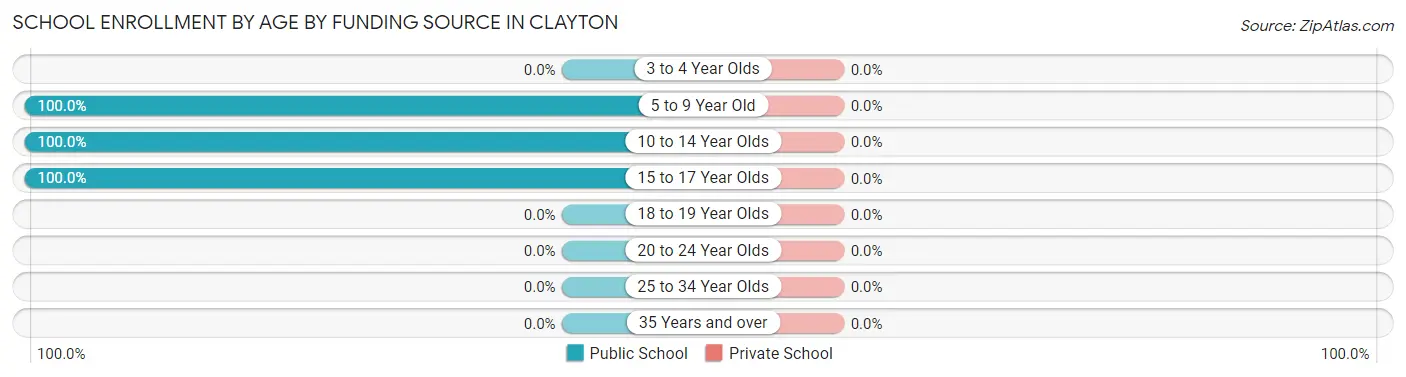
| Age Bracket | Public School | Private School |
| 3 to 4 Year Olds | 0 (0.0%) | 0 (0.0%) |
| 5 to 9 Year Old | 2 (100.0%) | 0 (0.0%) |
| 10 to 14 Year Olds | 5 (100.0%) | 0 (0.0%) |
| 15 to 17 Year Olds | 4 (100.0%) | 0 (0.0%) |
| 18 to 19 Year Olds | 0 (0.0%) | 0 (0.0%) |
| 20 to 24 Year Olds | 0 (0.0%) | 0 (0.0%) |
| 25 to 34 Year Olds | 0 (0.0%) | 0 (0.0%) |
| 35 Years and over | 0 (0.0%) | 0 (0.0%) |
| Total | 11 (100.0%) | 0 (0.0%) |
Educational Attainment by Field of Study in Clayton
| Field of Study | # Graduates | % Graduates |
| Computers & Mathematics | 0 | 0.0% |
| Bio, Nature & Agricultural | 0 | 0.0% |
| Physical & Health Sciences | 0 | 0.0% |
| Psychology | 0 | 0.0% |
| Social Sciences | 0 | 0.0% |
| Engineering | 0 | 0.0% |
| Multidisciplinary Studies | 0 | 0.0% |
| Science & Technology | 0 | 0.0% |
| Business | 0 | 0.0% |
| Education | 0 | 0.0% |
| Literature & Languages | 0 | 0.0% |
| Liberal Arts & History | 0 | 0.0% |
| Visual & Performing Arts | 0 | 0.0% |
| Communications | 0 | 0.0% |
| Arts & Humanities | 0 | 0.0% |
| Total | 0 | 0.0% |
Transportation & Commute in Clayton
Vehicle Availability by Sex in Clayton
The most prevalent vehicle ownership categories in Clayton are males with 3 vehicles (19, accounting for 100.0%) and females with 3 vehicles (13, making up 33.9%).
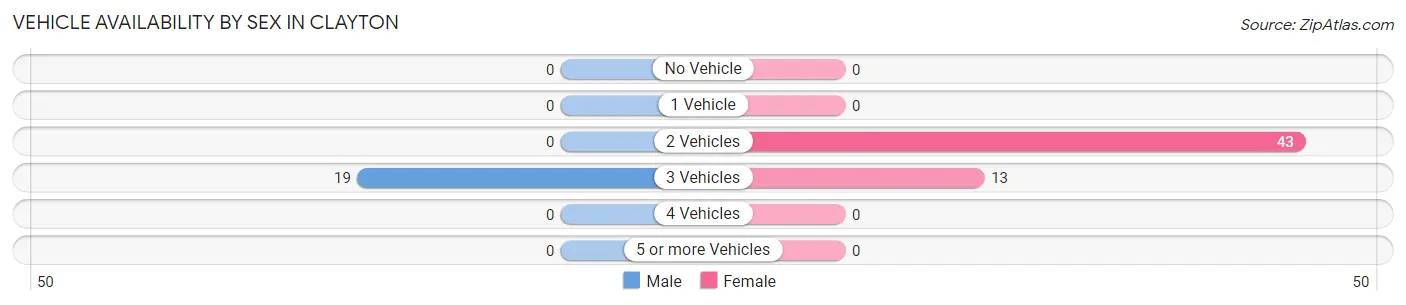
| Vehicles Available | Male | Female |
| No Vehicle | 0 (0.0%) | 0 (0.0%) |
| 1 Vehicle | 0 (0.0%) | 0 (0.0%) |
| 2 Vehicles | 0 (0.0%) | 43 (76.8%) |
| 3 Vehicles | 19 (100.0%) | 13 (23.2%) |
| 4 Vehicles | 0 (0.0%) | 0 (0.0%) |
| 5 or more Vehicles | 0 (0.0%) | 0 (0.0%) |
| Total | 19 (100.0%) | 56 (100.0%) |
Commute Time in Clayton
The most frequently occuring commute durations in Clayton are 15 to 19 minutes (43 commuters, 58.1%), 30 to 34 minutes (20 commuters, 27.0%), and 45 to 59 minutes (10 commuters, 13.5%).
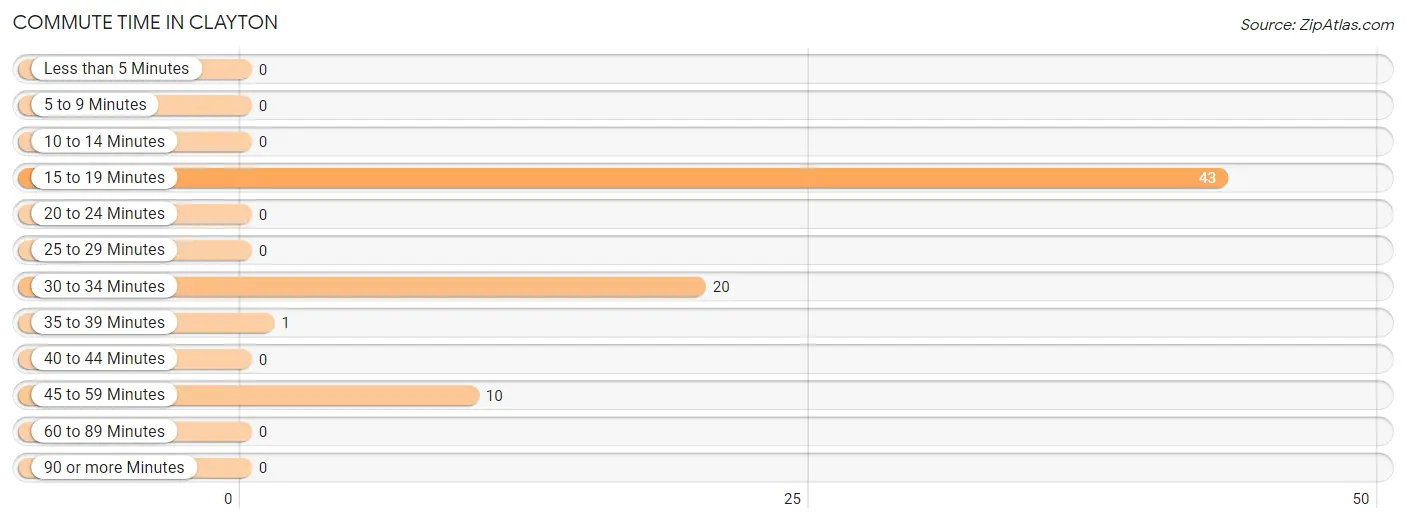
| Commute Time | # Commuters | % Commuters |
| Less than 5 Minutes | 0 | 0.0% |
| 5 to 9 Minutes | 0 | 0.0% |
| 10 to 14 Minutes | 0 | 0.0% |
| 15 to 19 Minutes | 43 | 58.1% |
| 20 to 24 Minutes | 0 | 0.0% |
| 25 to 29 Minutes | 0 | 0.0% |
| 30 to 34 Minutes | 20 | 27.0% |
| 35 to 39 Minutes | 1 | 1.3% |
| 40 to 44 Minutes | 0 | 0.0% |
| 45 to 59 Minutes | 10 | 13.5% |
| 60 to 89 Minutes | 0 | 0.0% |
| 90 or more Minutes | 0 | 0.0% |
Commute Time by Sex in Clayton
The most common commute times in Clayton are 45 to 59 minutes (10 commuters, 55.6%) for males and 15 to 19 minutes (43 commuters, 76.8%) for females.
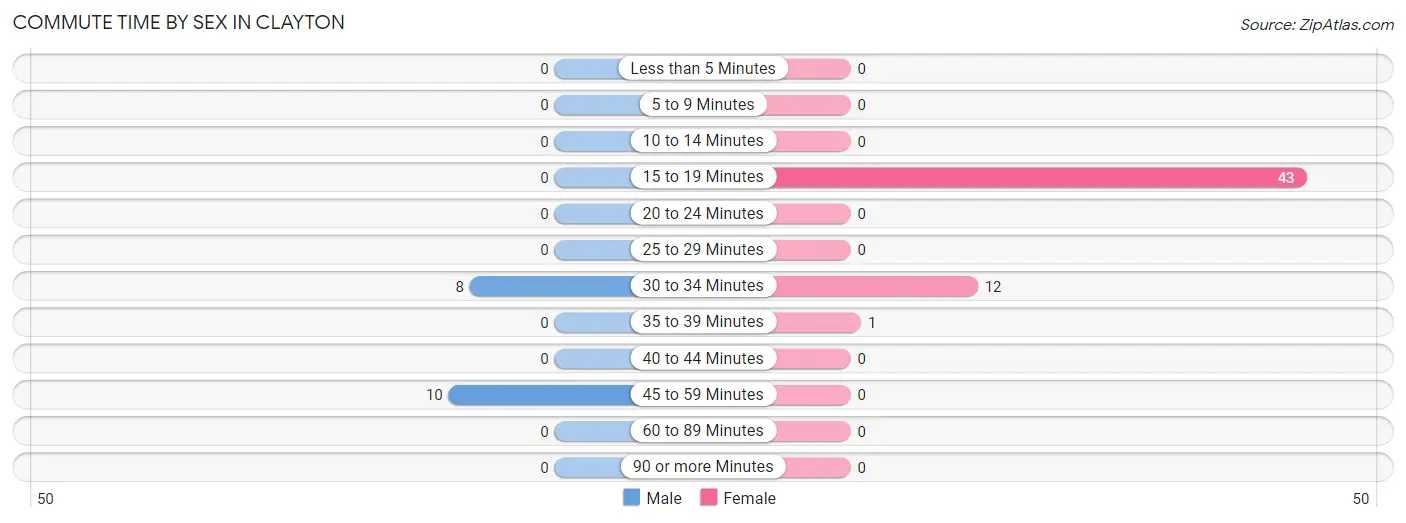
| Commute Time | Male | Female |
| Less than 5 Minutes | 0 (0.0%) | 0 (0.0%) |
| 5 to 9 Minutes | 0 (0.0%) | 0 (0.0%) |
| 10 to 14 Minutes | 0 (0.0%) | 0 (0.0%) |
| 15 to 19 Minutes | 0 (0.0%) | 43 (76.8%) |
| 20 to 24 Minutes | 0 (0.0%) | 0 (0.0%) |
| 25 to 29 Minutes | 0 (0.0%) | 0 (0.0%) |
| 30 to 34 Minutes | 8 (44.4%) | 12 (21.4%) |
| 35 to 39 Minutes | 0 (0.0%) | 1 (1.8%) |
| 40 to 44 Minutes | 0 (0.0%) | 0 (0.0%) |
| 45 to 59 Minutes | 10 (55.6%) | 0 (0.0%) |
| 60 to 89 Minutes | 0 (0.0%) | 0 (0.0%) |
| 90 or more Minutes | 0 (0.0%) | 0 (0.0%) |
Time of Departure to Work by Sex in Clayton
The most frequent times of departure to work in Clayton are 5:30 AM to 5:59 AM (10, 55.6%) for males and 7:00 AM to 7:29 AM (43, 76.8%) for females.
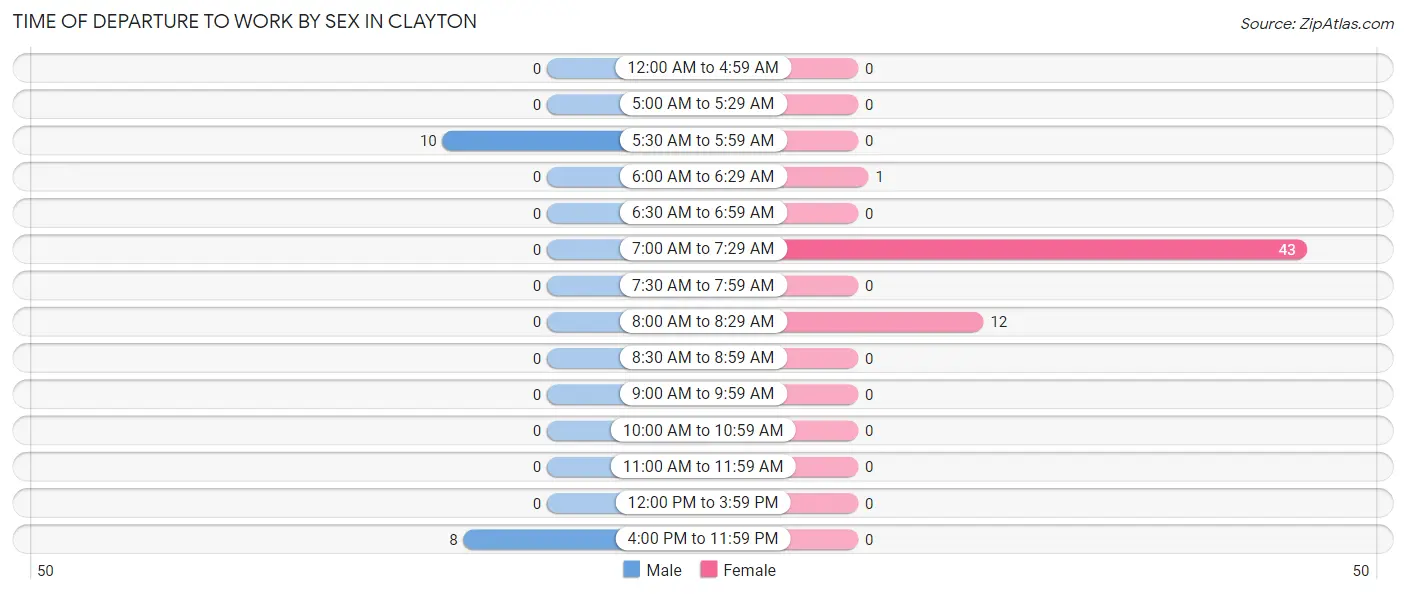
| Time of Departure | Male | Female |
| 12:00 AM to 4:59 AM | 0 (0.0%) | 0 (0.0%) |
| 5:00 AM to 5:29 AM | 0 (0.0%) | 0 (0.0%) |
| 5:30 AM to 5:59 AM | 10 (55.6%) | 0 (0.0%) |
| 6:00 AM to 6:29 AM | 0 (0.0%) | 1 (1.8%) |
| 6:30 AM to 6:59 AM | 0 (0.0%) | 0 (0.0%) |
| 7:00 AM to 7:29 AM | 0 (0.0%) | 43 (76.8%) |
| 7:30 AM to 7:59 AM | 0 (0.0%) | 0 (0.0%) |
| 8:00 AM to 8:29 AM | 0 (0.0%) | 12 (21.4%) |
| 8:30 AM to 8:59 AM | 0 (0.0%) | 0 (0.0%) |
| 9:00 AM to 9:59 AM | 0 (0.0%) | 0 (0.0%) |
| 10:00 AM to 10:59 AM | 0 (0.0%) | 0 (0.0%) |
| 11:00 AM to 11:59 AM | 0 (0.0%) | 0 (0.0%) |
| 12:00 PM to 3:59 PM | 0 (0.0%) | 0 (0.0%) |
| 4:00 PM to 11:59 PM | 8 (44.4%) | 0 (0.0%) |
| Total | 18 (100.0%) | 56 (100.0%) |
Housing Occupancy in Clayton
Occupancy by Ownership in Clayton
Of the total 52 dwellings in Clayton, owner-occupied units account for 47 (90.4%), while renter-occupied units make up 5 (9.6%).
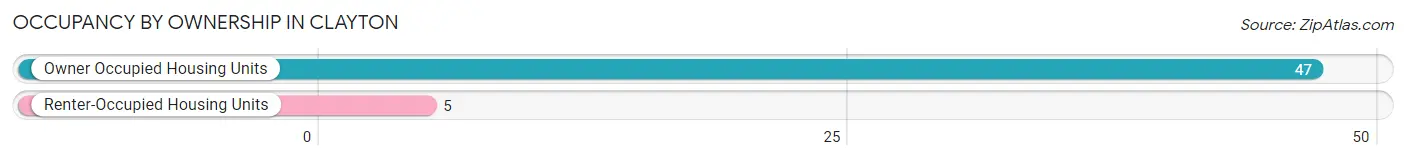
| Occupancy | # Housing Units | % Housing Units |
| Owner Occupied Housing Units | 47 | 90.4% |
| Renter-Occupied Housing Units | 5 | 9.6% |
| Total Occupied Housing Units | 52 | 100.0% |
Occupancy by Household Size in Clayton
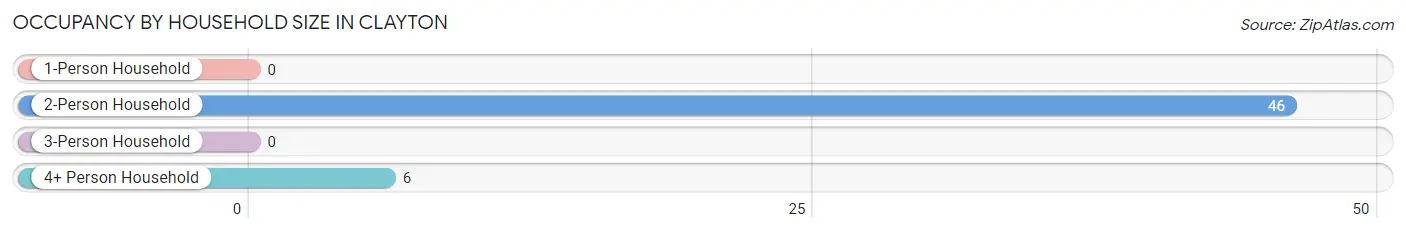
| Household Size | # Housing Units | % Housing Units |
| 1-Person Household | 0 | 0.0% |
| 2-Person Household | 46 | 88.5% |
| 3-Person Household | 0 | 0.0% |
| 4+ Person Household | 6 | 11.5% |
| Total Housing Units | 52 | 100.0% |
Occupancy by Ownership by Household Size in Clayton
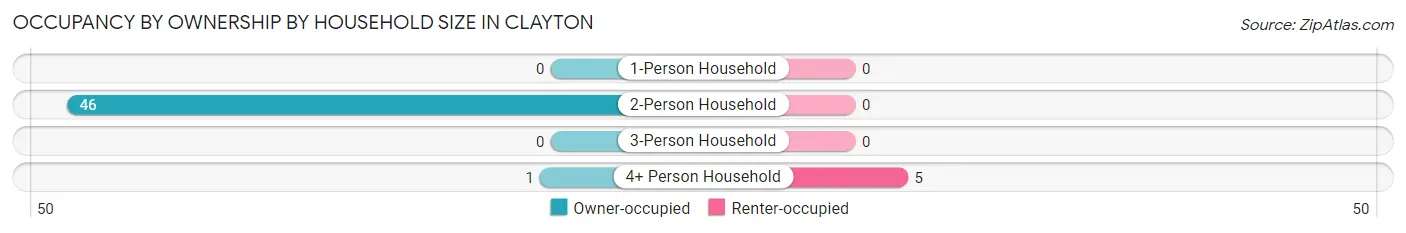
| Household Size | Owner-occupied | Renter-occupied |
| 1-Person Household | 0 (0.0%) | 0 (0.0%) |
| 2-Person Household | 46 (100.0%) | 0 (0.0%) |
| 3-Person Household | 0 (0.0%) | 0 (0.0%) |
| 4+ Person Household | 1 (16.7%) | 5 (83.3%) |
| Total Housing Units | 47 (90.4%) | 5 (9.6%) |
Occupancy by Educational Attainment in Clayton
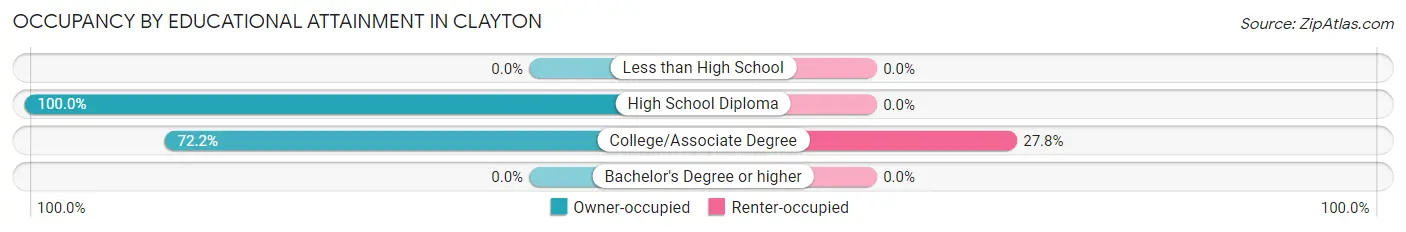
| Household Size | Owner-occupied | Renter-occupied |
| Less than High School | 0 (0.0%) | 0 (0.0%) |
| High School Diploma | 34 (100.0%) | 0 (0.0%) |
| College/Associate Degree | 13 (72.2%) | 5 (27.8%) |
| Bachelor's Degree or higher | 0 (0.0%) | 0 (0.0%) |
Occupancy by Age of Householder in Clayton
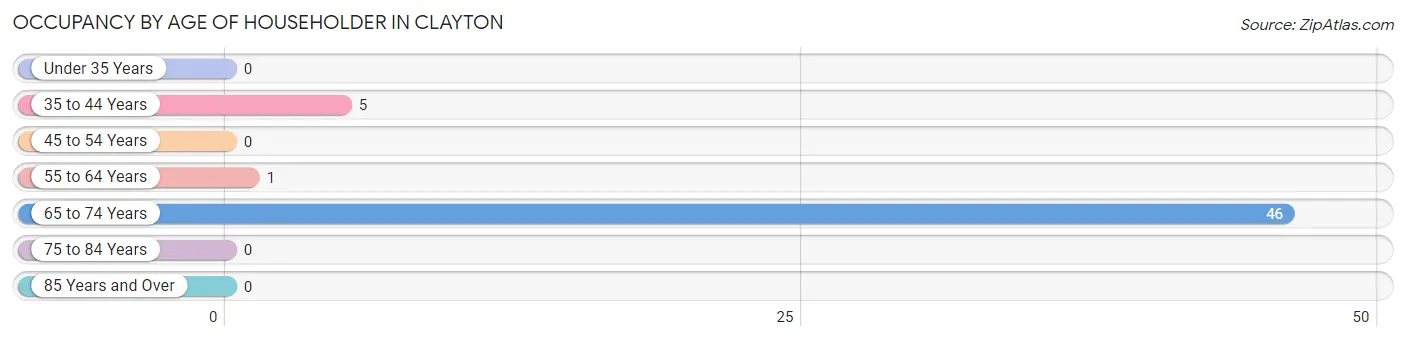
| Age Bracket | # Households | % Households |
| Under 35 Years | 0 | 0.0% |
| 35 to 44 Years | 5 | 9.6% |
| 45 to 54 Years | 0 | 0.0% |
| 55 to 64 Years | 1 | 1.9% |
| 65 to 74 Years | 46 | 88.5% |
| 75 to 84 Years | 0 | 0.0% |
| 85 Years and Over | 0 | 0.0% |
| Total | 52 | 100.0% |
Housing Finances in Clayton
Median Income by Occupancy in Clayton
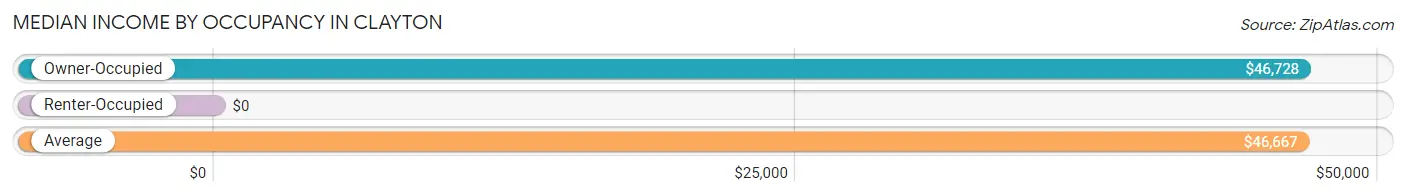
| Occupancy Type | # Households | Median Income |
| Owner-Occupied | 47 (90.4%) | $46,728 |
| Renter-Occupied | 5 (9.6%) | $0 |
| Average | 52 (100.0%) | $46,667 |
Occupancy by Householder Income Bracket in Clayton
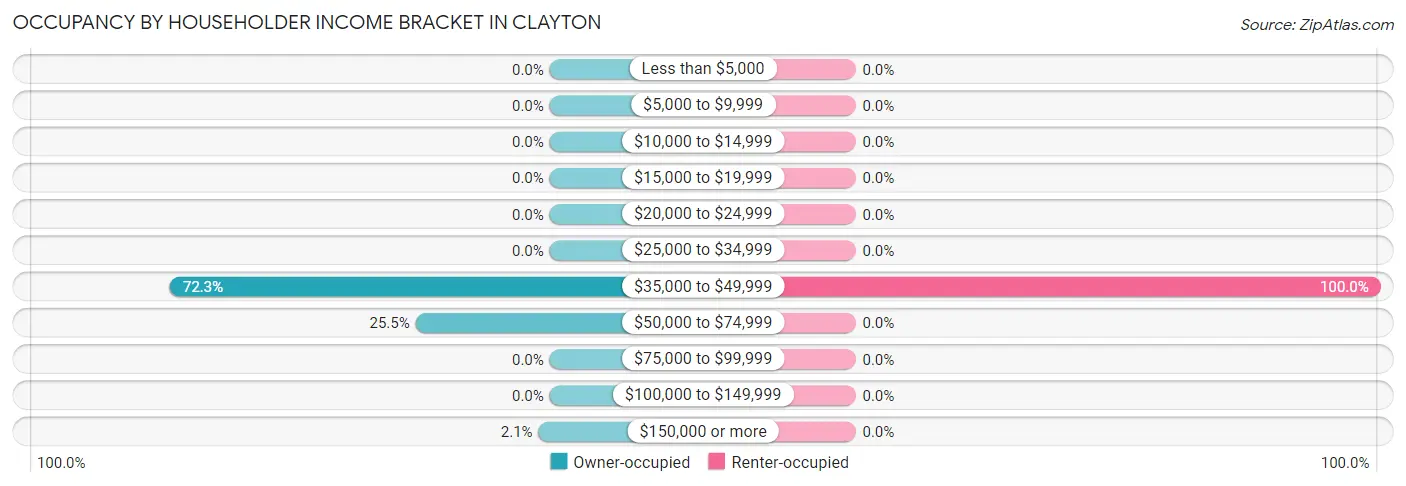
| Income Bracket | Owner-occupied | Renter-occupied |
| Less than $5,000 | 0 (0.0%) | 0 (0.0%) |
| $5,000 to $9,999 | 0 (0.0%) | 0 (0.0%) |
| $10,000 to $14,999 | 0 (0.0%) | 0 (0.0%) |
| $15,000 to $19,999 | 0 (0.0%) | 0 (0.0%) |
| $20,000 to $24,999 | 0 (0.0%) | 0 (0.0%) |
| $25,000 to $34,999 | 0 (0.0%) | 0 (0.0%) |
| $35,000 to $49,999 | 34 (72.3%) | 5 (100.0%) |
| $50,000 to $74,999 | 12 (25.5%) | 0 (0.0%) |
| $75,000 to $99,999 | 0 (0.0%) | 0 (0.0%) |
| $100,000 to $149,999 | 0 (0.0%) | 0 (0.0%) |
| $150,000 or more | 1 (2.1%) | 0 (0.0%) |
| Total | 47 (100.0%) | 5 (100.0%) |
Monthly Housing Cost Tiers in Clayton
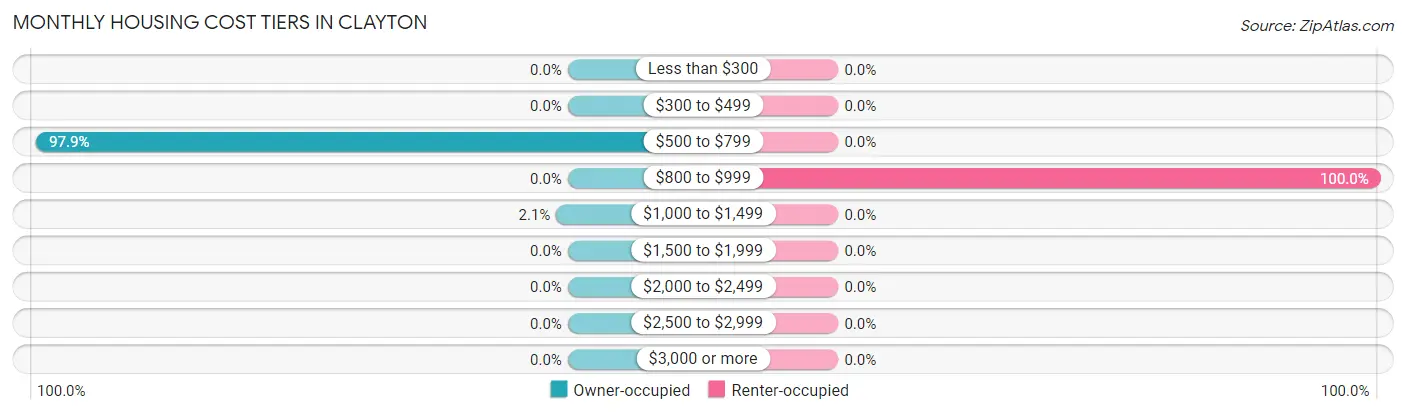
| Monthly Cost | Owner-occupied | Renter-occupied |
| Less than $300 | 0 (0.0%) | 0 (0.0%) |
| $300 to $499 | 0 (0.0%) | 0 (0.0%) |
| $500 to $799 | 46 (97.9%) | 0 (0.0%) |
| $800 to $999 | 0 (0.0%) | 5 (100.0%) |
| $1,000 to $1,499 | 1 (2.1%) | 0 (0.0%) |
| $1,500 to $1,999 | 0 (0.0%) | 0 (0.0%) |
| $2,000 to $2,499 | 0 (0.0%) | 0 (0.0%) |
| $2,500 to $2,999 | 0 (0.0%) | 0 (0.0%) |
| $3,000 or more | 0 (0.0%) | 0 (0.0%) |
| Total | 47 (100.0%) | 5 (100.0%) |
Physical Housing Characteristics in Clayton
Housing Structures in Clayton
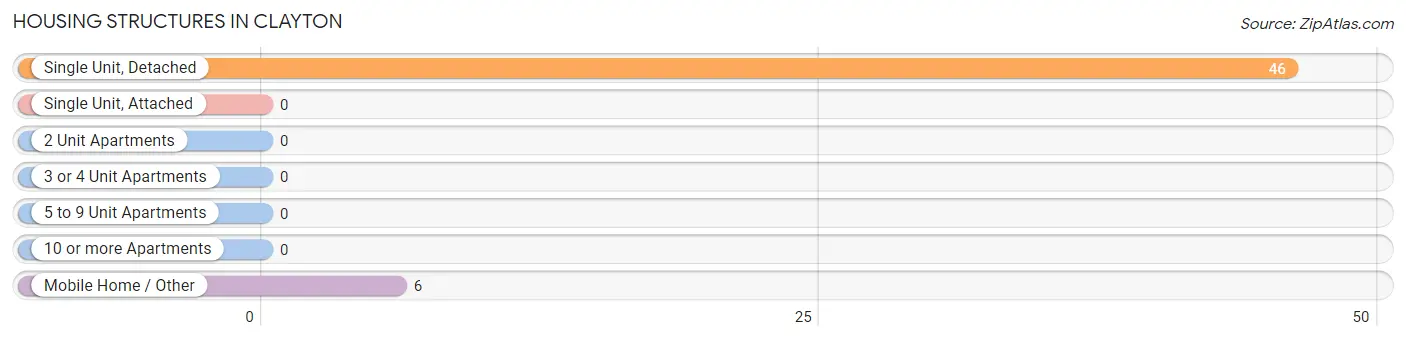
| Structure Type | # Housing Units | % Housing Units |
| Single Unit, Detached | 46 | 88.5% |
| Single Unit, Attached | 0 | 0.0% |
| 2 Unit Apartments | 0 | 0.0% |
| 3 or 4 Unit Apartments | 0 | 0.0% |
| 5 to 9 Unit Apartments | 0 | 0.0% |
| 10 or more Apartments | 0 | 0.0% |
| Mobile Home / Other | 6 | 11.5% |
| Total | 52 | 100.0% |
Housing Structures by Occupancy in Clayton
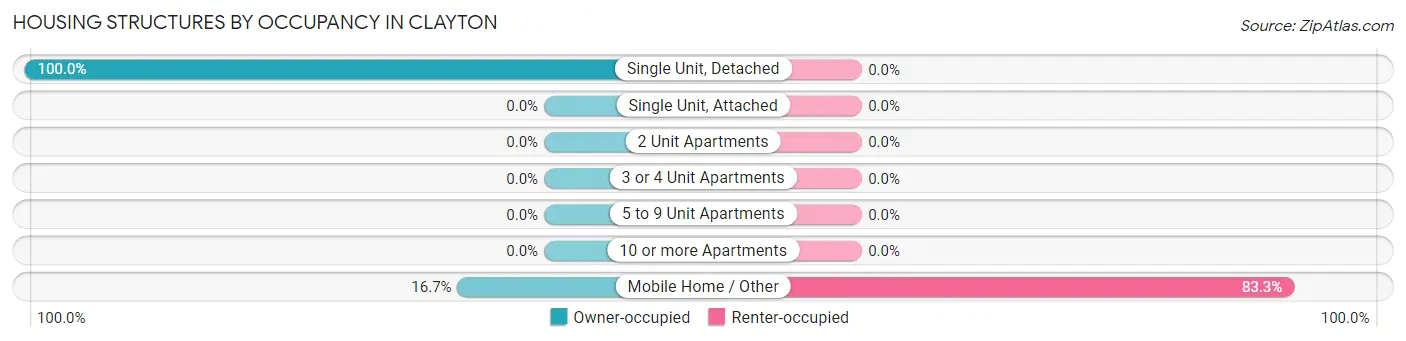
| Structure Type | Owner-occupied | Renter-occupied |
| Single Unit, Detached | 46 (100.0%) | 0 (0.0%) |
| Single Unit, Attached | 0 (0.0%) | 0 (0.0%) |
| 2 Unit Apartments | 0 (0.0%) | 0 (0.0%) |
| 3 or 4 Unit Apartments | 0 (0.0%) | 0 (0.0%) |
| 5 to 9 Unit Apartments | 0 (0.0%) | 0 (0.0%) |
| 10 or more Apartments | 0 (0.0%) | 0 (0.0%) |
| Mobile Home / Other | 1 (16.7%) | 5 (83.3%) |
| Total | 47 (90.4%) | 5 (9.6%) |
Housing Structures by Number of Rooms in Clayton
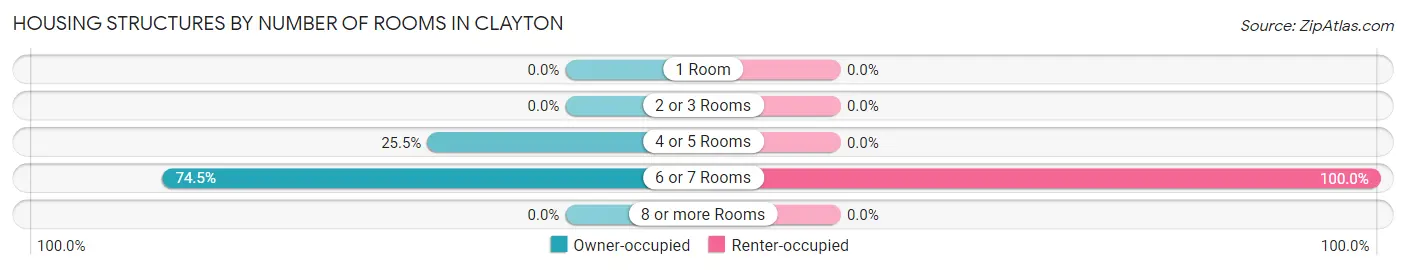
| Number of Rooms | Owner-occupied | Renter-occupied |
| 1 Room | 0 (0.0%) | 0 (0.0%) |
| 2 or 3 Rooms | 0 (0.0%) | 0 (0.0%) |
| 4 or 5 Rooms | 12 (25.5%) | 0 (0.0%) |
| 6 or 7 Rooms | 35 (74.5%) | 5 (100.0%) |
| 8 or more Rooms | 0 (0.0%) | 0 (0.0%) |
| Total | 47 (100.0%) | 5 (100.0%) |
Housing Structure by Heating Type in Clayton
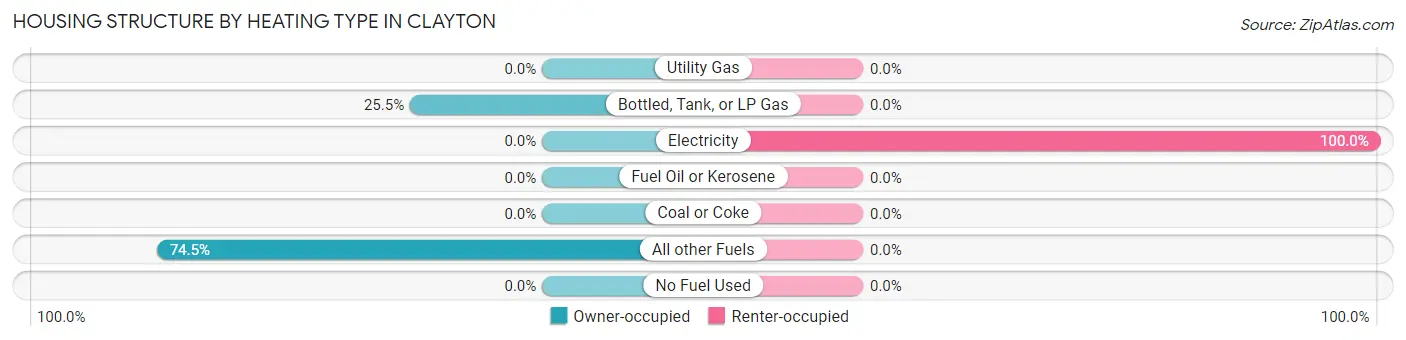
| Heating Type | Owner-occupied | Renter-occupied |
| Utility Gas | 0 (0.0%) | 0 (0.0%) |
| Bottled, Tank, or LP Gas | 12 (25.5%) | 0 (0.0%) |
| Electricity | 0 (0.0%) | 5 (100.0%) |
| Fuel Oil or Kerosene | 0 (0.0%) | 0 (0.0%) |
| Coal or Coke | 0 (0.0%) | 0 (0.0%) |
| All other Fuels | 35 (74.5%) | 0 (0.0%) |
| No Fuel Used | 0 (0.0%) | 0 (0.0%) |
| Total | 47 (100.0%) | 5 (100.0%) |
Household Vehicle Usage in Clayton
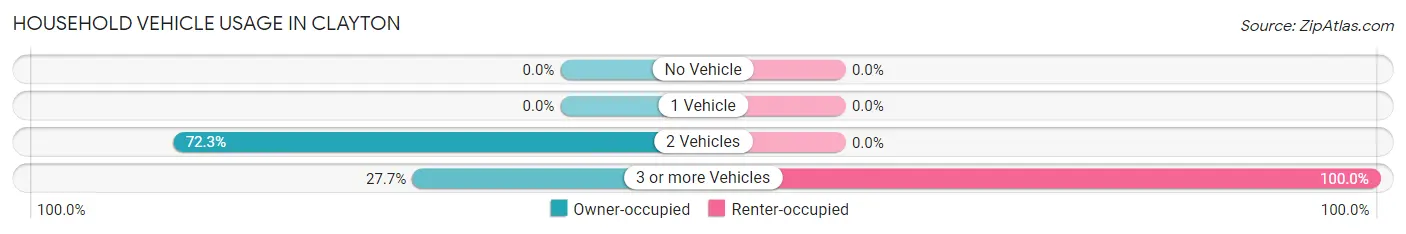
| Vehicles per Household | Owner-occupied | Renter-occupied |
| No Vehicle | 0 (0.0%) | 0 (0.0%) |
| 1 Vehicle | 0 (0.0%) | 0 (0.0%) |
| 2 Vehicles | 34 (72.3%) | 0 (0.0%) |
| 3 or more Vehicles | 13 (27.7%) | 5 (100.0%) |
| Total | 47 (100.0%) | 5 (100.0%) |
Real Estate & Mortgages in Clayton
Real Estate and Mortgage Overview in Clayton
| Characteristic | Without Mortgage | With Mortgage |
| Housing Units | 0 | 47 |
| Median Property Value | - | - |
| Median Household Income | - | - |
| Monthly Housing Costs | - | - |
| Real Estate Taxes | - | - |
Property Value by Mortgage Status in Clayton
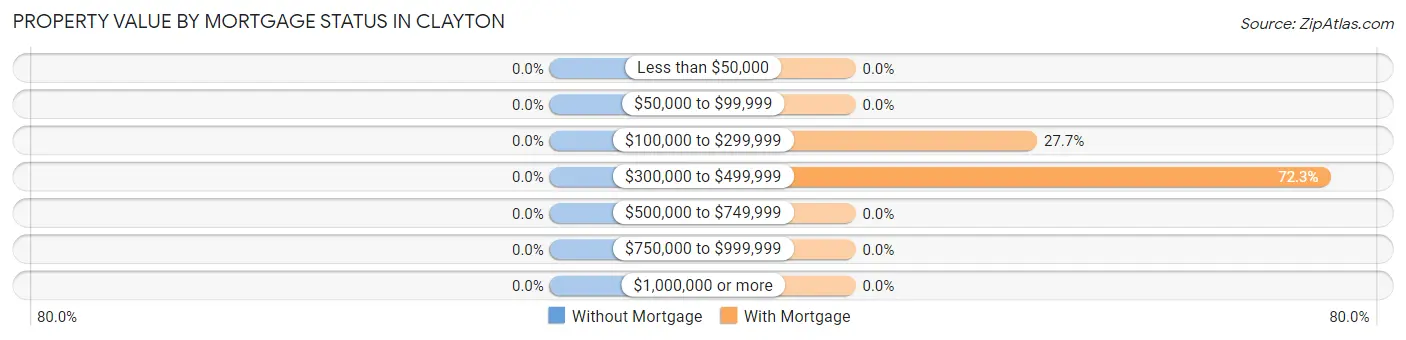
| Property Value | Without Mortgage | With Mortgage |
| Less than $50,000 | 0 (0.0%) | 0 (0.0%) |
| $50,000 to $99,999 | 0 (0.0%) | 0 (0.0%) |
| $100,000 to $299,999 | 0 (0.0%) | 13 (27.7%) |
| $300,000 to $499,999 | 0 (0.0%) | 34 (72.3%) |
| $500,000 to $749,999 | 0 (0.0%) | 0 (0.0%) |
| $750,000 to $999,999 | 0 (0.0%) | 0 (0.0%) |
| $1,000,000 or more | 0 (0.0%) | 0 (0.0%) |
| Total | 0 (0.0%) | 47 (100.0%) |
Household Income by Mortgage Status in Clayton
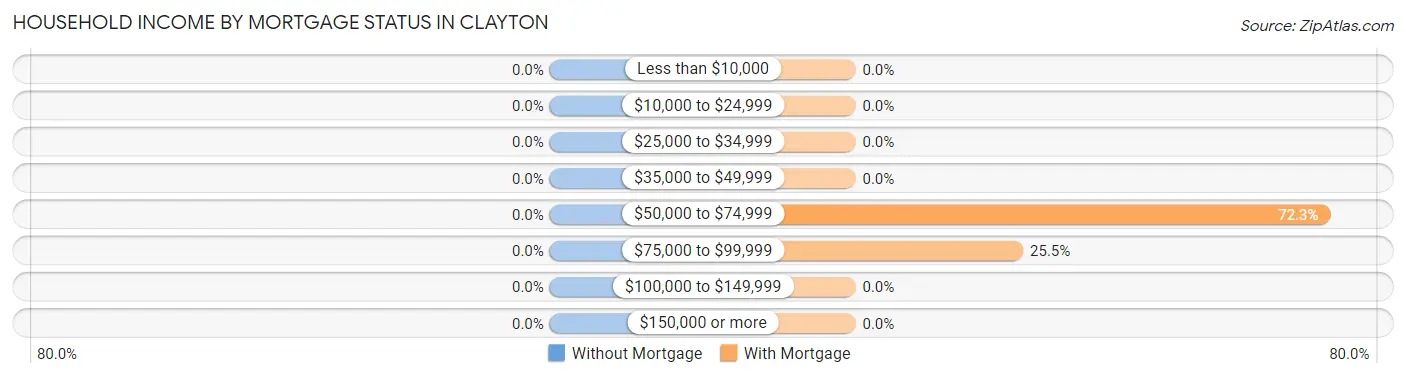
| Household Income | Without Mortgage | With Mortgage |
| Less than $10,000 | 0 (0.0%) | 0 (0.0%) |
| $10,000 to $24,999 | 0 (0.0%) | 0 (0.0%) |
| $25,000 to $34,999 | 0 (0.0%) | 0 (0.0%) |
| $35,000 to $49,999 | 0 (0.0%) | 0 (0.0%) |
| $50,000 to $74,999 | 0 (0.0%) | 34 (72.3%) |
| $75,000 to $99,999 | 0 (0.0%) | 12 (25.5%) |
| $100,000 to $149,999 | 0 (0.0%) | 0 (0.0%) |
| $150,000 or more | 0 (0.0%) | 0 (0.0%) |
| Total | 0 (0.0%) | 47 (100.0%) |
Property Value to Household Income Ratio in Clayton
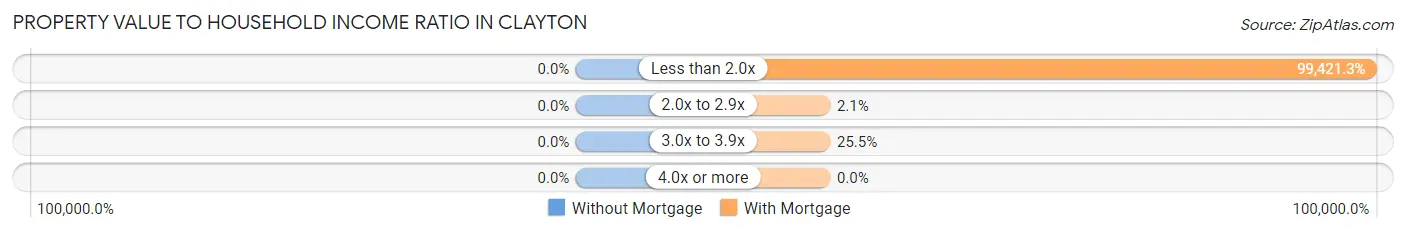
| Value-to-Income Ratio | Without Mortgage | With Mortgage |
| Less than 2.0x | 0 (0.0%) | 46,728 (99,421.3%) |
| 2.0x to 2.9x | 0 (0.0%) | 1 (2.1%) |
| 3.0x to 3.9x | 0 (0.0%) | 12 (25.5%) |
| 4.0x or more | 0 (0.0%) | 0 (0.0%) |
| Total | 0 (0.0%) | 47 (100.0%) |
Real Estate Taxes by Mortgage Status in Clayton
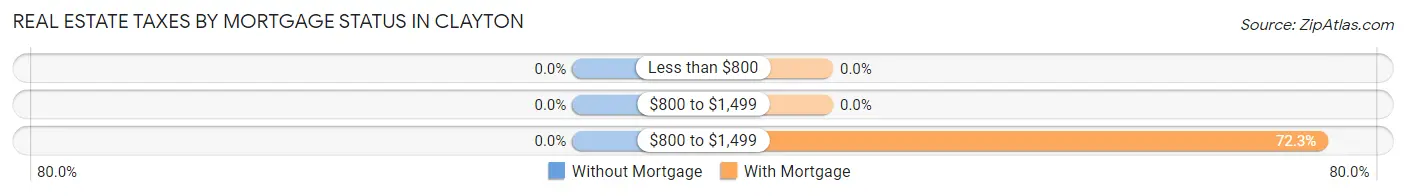
| Property Taxes | Without Mortgage | With Mortgage |
| Less than $800 | 0 (0.0%) | 0 (0.0%) |
| $800 to $1,499 | 0 (0.0%) | 0 (0.0%) |
| $800 to $1,499 | 0 (0.0%) | 34 (72.3%) |
| Total | 0 (0.0%) | 47 (100.0%) |
Health & Disability in Clayton
Health Insurance Coverage by Age in Clayton
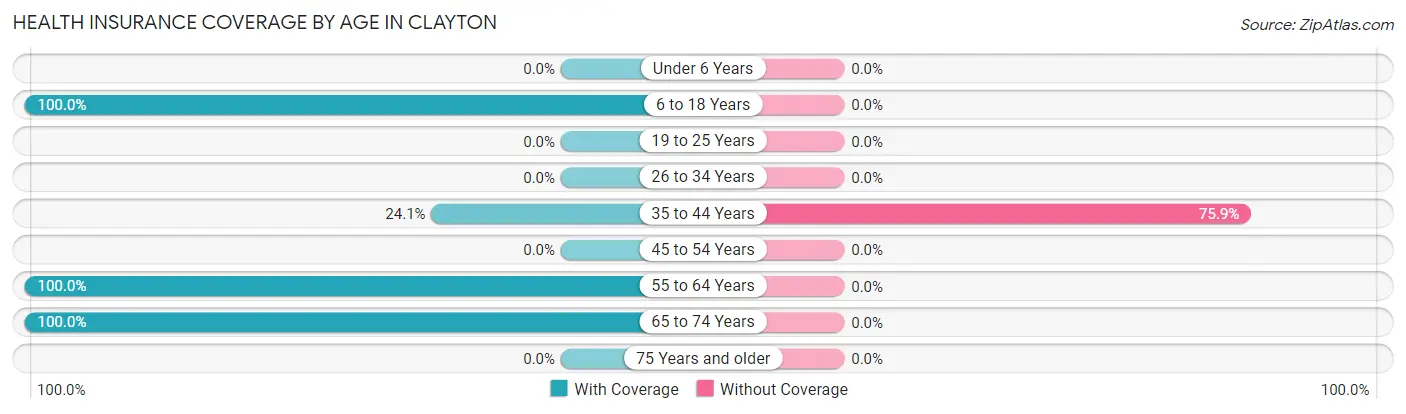
| Age Bracket | With Coverage | Without Coverage |
| Under 6 Years | 0 (0.0%) | 0 (0.0%) |
| 6 to 18 Years | 11 (100.0%) | 0 (0.0%) |
| 19 to 25 Years | 0 (0.0%) | 0 (0.0%) |
| 26 to 34 Years | 0 (0.0%) | 0 (0.0%) |
| 35 to 44 Years | 14 (24.1%) | 44 (75.9%) |
| 45 to 54 Years | 0 (0.0%) | 0 (0.0%) |
| 55 to 64 Years | 12 (100.0%) | 0 (0.0%) |
| 65 to 74 Years | 46 (100.0%) | 0 (0.0%) |
| 75 Years and older | 0 (0.0%) | 0 (0.0%) |
| Total | 83 (65.3%) | 44 (34.6%) |
Health Insurance Coverage by Citizenship Status in Clayton
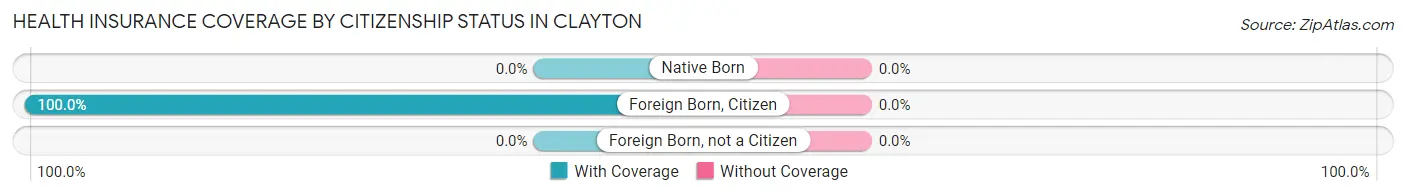
| Citizenship Status | With Coverage | Without Coverage |
| Native Born | 0 (0.0%) | 0 (0.0%) |
| Foreign Born, Citizen | 11 (100.0%) | 0 (0.0%) |
| Foreign Born, not a Citizen | 0 (0.0%) | 0 (0.0%) |
Health Insurance Coverage by Household Income in Clayton
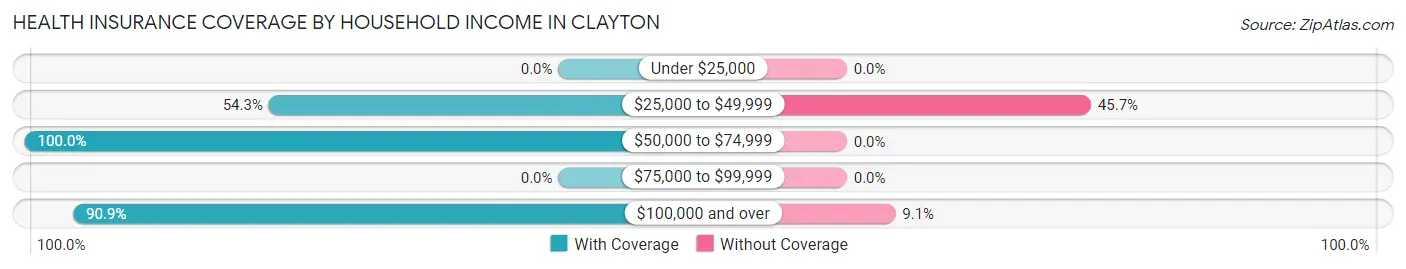
| Household Income | With Coverage | Without Coverage |
| Under $25,000 | 0 (0.0%) | 0 (0.0%) |
| $25,000 to $49,999 | 51 (54.3%) | 43 (45.7%) |
| $50,000 to $74,999 | 22 (100.0%) | 0 (0.0%) |
| $75,000 to $99,999 | 0 (0.0%) | 0 (0.0%) |
| $100,000 and over | 10 (90.9%) | 1 (9.1%) |
Public vs Private Health Insurance Coverage by Age in Clayton
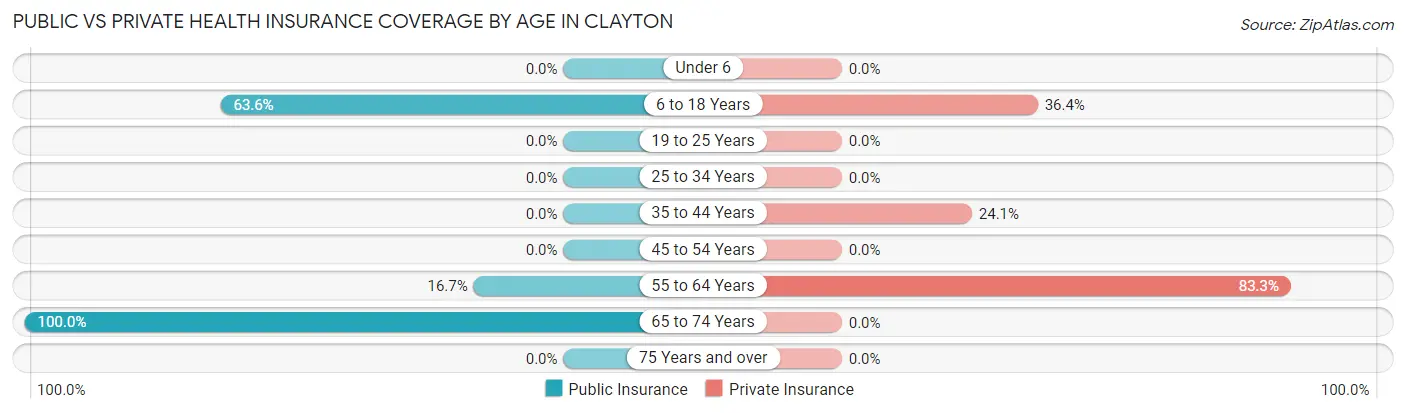
| Age Bracket | Public Insurance | Private Insurance |
| Under 6 | 0 (0.0%) | 0 (0.0%) |
| 6 to 18 Years | 7 (63.6%) | 4 (36.4%) |
| 19 to 25 Years | 0 (0.0%) | 0 (0.0%) |
| 25 to 34 Years | 0 (0.0%) | 0 (0.0%) |
| 35 to 44 Years | 0 (0.0%) | 14 (24.1%) |
| 45 to 54 Years | 0 (0.0%) | 0 (0.0%) |
| 55 to 64 Years | 2 (16.7%) | 10 (83.3%) |
| 65 to 74 Years | 46 (100.0%) | 0 (0.0%) |
| 75 Years and over | 0 (0.0%) | 0 (0.0%) |
| Total | 55 (43.3%) | 28 (22.1%) |
Disability Status by Sex by Age in Clayton
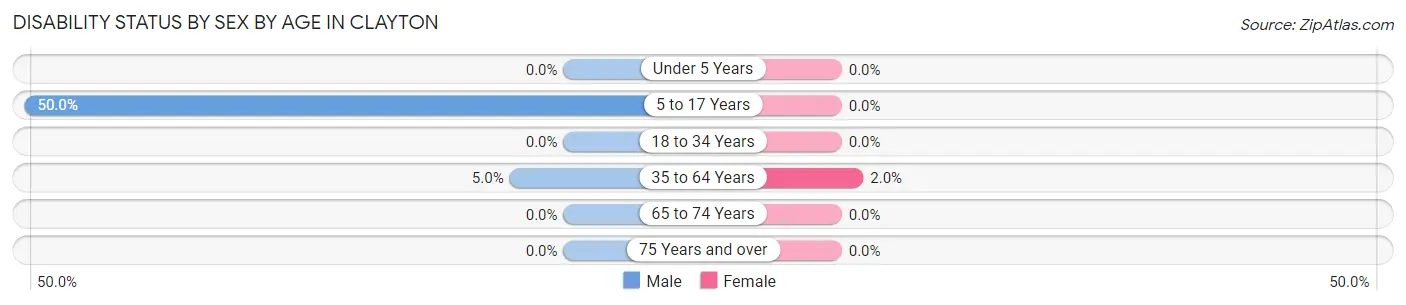
| Age Bracket | Male | Female |
| Under 5 Years | 0 (0.0%) | 0 (0.0%) |
| 5 to 17 Years | 1 (50.0%) | 0 (0.0%) |
| 18 to 34 Years | 0 (0.0%) | 0 (0.0%) |
| 35 to 64 Years | 1 (5.0%) | 1 (2.0%) |
| 65 to 74 Years | 0 (0.0%) | 0 (0.0%) |
| 75 Years and over | 0 (0.0%) | 0 (0.0%) |
Disability Class by Sex by Age in Clayton
Disability Class: Hearing Difficulty
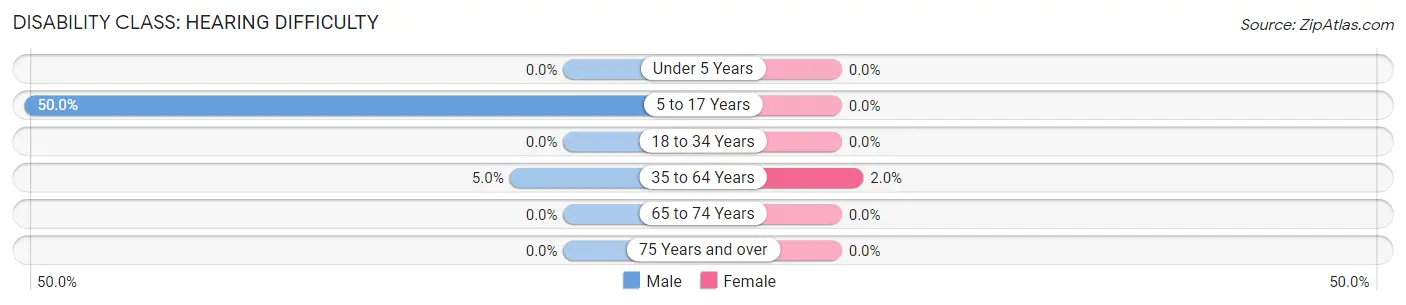
| Age Bracket | Male | Female |
| Under 5 Years | 0 (0.0%) | 0 (0.0%) |
| 5 to 17 Years | 1 (50.0%) | 0 (0.0%) |
| 18 to 34 Years | 0 (0.0%) | 0 (0.0%) |
| 35 to 64 Years | 1 (5.0%) | 1 (2.0%) |
| 65 to 74 Years | 0 (0.0%) | 0 (0.0%) |
| 75 Years and over | 0 (0.0%) | 0 (0.0%) |
Disability Class: Vision Difficulty
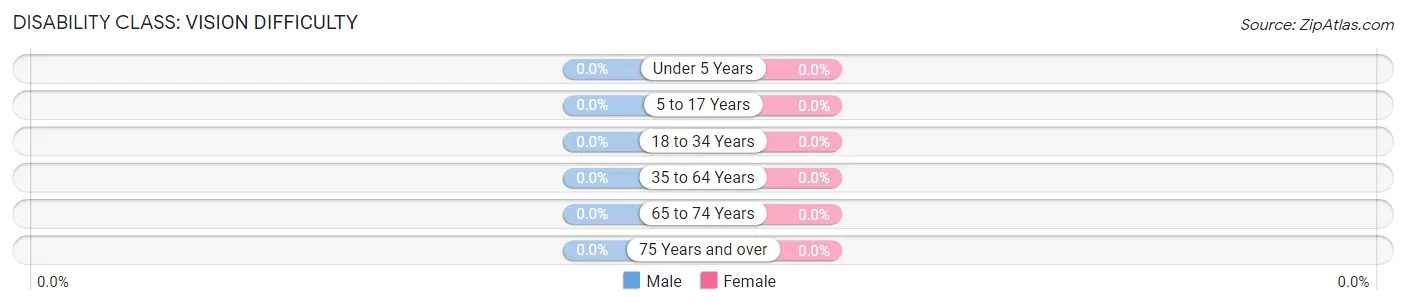
| Age Bracket | Male | Female |
| Under 5 Years | 0 (0.0%) | 0 (0.0%) |
| 5 to 17 Years | 0 (0.0%) | 0 (0.0%) |
| 18 to 34 Years | 0 (0.0%) | 0 (0.0%) |
| 35 to 64 Years | 0 (0.0%) | 0 (0.0%) |
| 65 to 74 Years | 0 (0.0%) | 0 (0.0%) |
| 75 Years and over | 0 (0.0%) | 0 (0.0%) |
Disability Class: Cognitive Difficulty
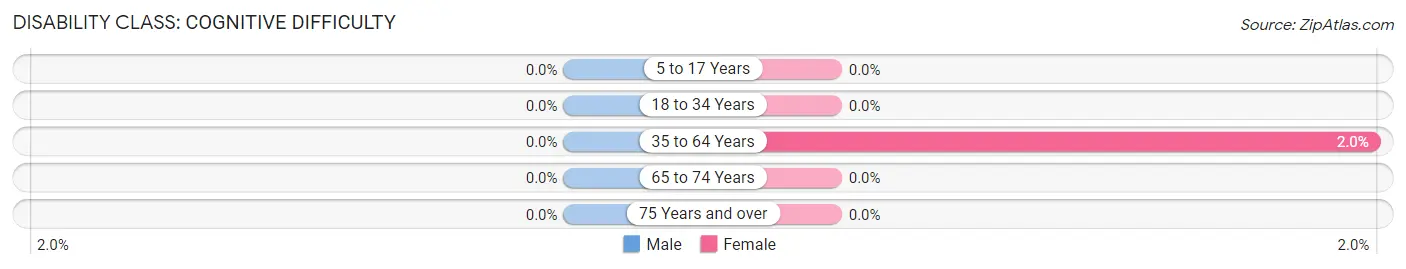
| Age Bracket | Male | Female |
| 5 to 17 Years | 0 (0.0%) | 0 (0.0%) |
| 18 to 34 Years | 0 (0.0%) | 0 (0.0%) |
| 35 to 64 Years | 0 (0.0%) | 1 (2.0%) |
| 65 to 74 Years | 0 (0.0%) | 0 (0.0%) |
| 75 Years and over | 0 (0.0%) | 0 (0.0%) |
Disability Class: Ambulatory Difficulty
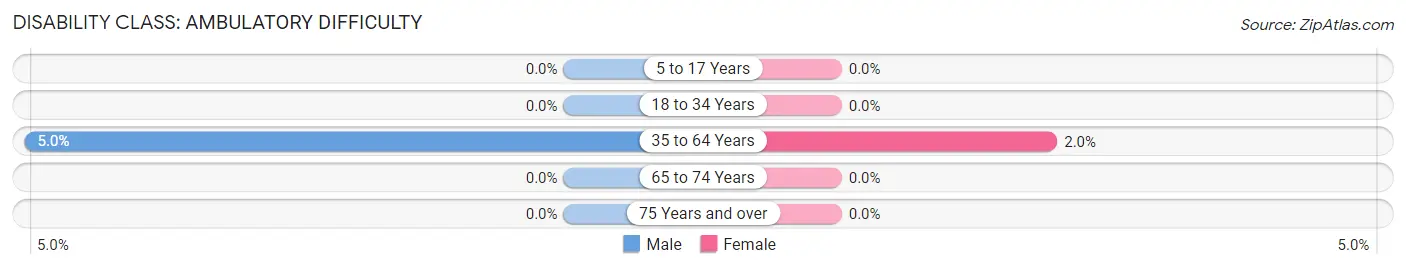
| Age Bracket | Male | Female |
| 5 to 17 Years | 0 (0.0%) | 0 (0.0%) |
| 18 to 34 Years | 0 (0.0%) | 0 (0.0%) |
| 35 to 64 Years | 1 (5.0%) | 1 (2.0%) |
| 65 to 74 Years | 0 (0.0%) | 0 (0.0%) |
| 75 Years and over | 0 (0.0%) | 0 (0.0%) |
Disability Class: Self-Care Difficulty
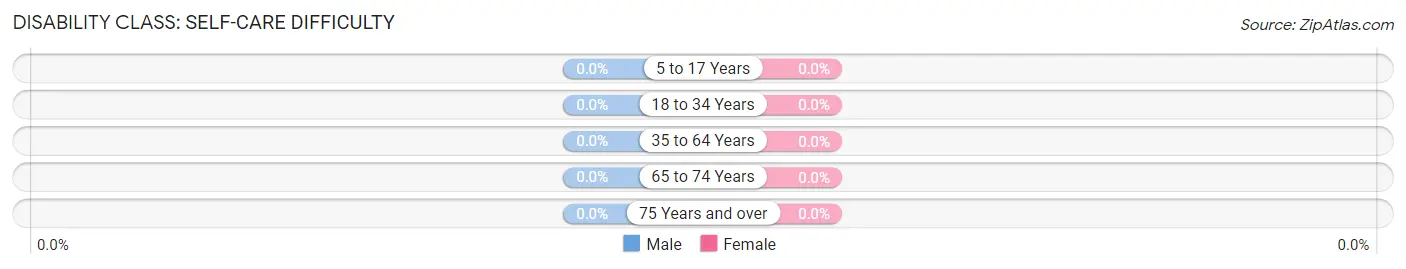
| Age Bracket | Male | Female |
| 5 to 17 Years | 0 (0.0%) | 0 (0.0%) |
| 18 to 34 Years | 0 (0.0%) | 0 (0.0%) |
| 35 to 64 Years | 0 (0.0%) | 0 (0.0%) |
| 65 to 74 Years | 0 (0.0%) | 0 (0.0%) |
| 75 Years and over | 0 (0.0%) | 0 (0.0%) |
Technology Access in Clayton
Computing Device Access in Clayton
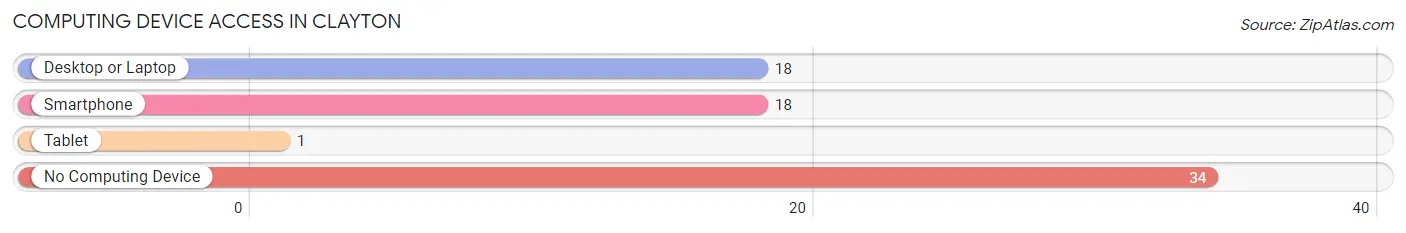
| Device Type | # Households | % Households |
| Desktop or Laptop | 18 | 34.6% |
| Smartphone | 18 | 34.6% |
| Tablet | 1 | 1.9% |
| No Computing Device | 34 | 65.4% |
| Total | 52 | 100.0% |
Internet Access in Clayton
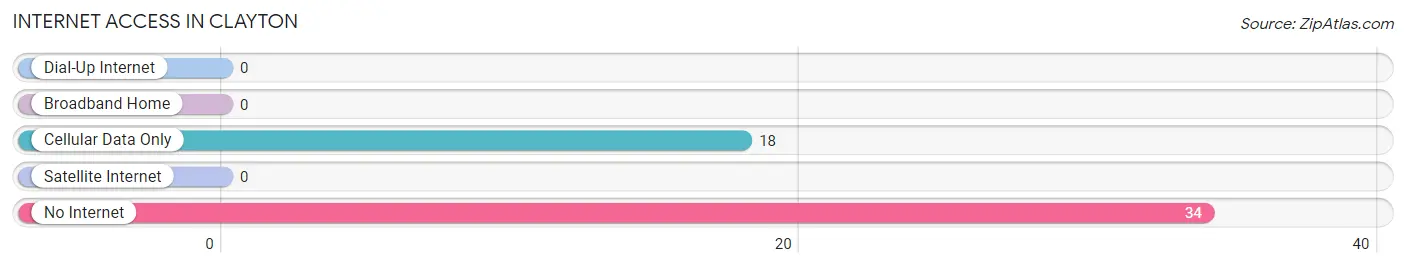
| Internet Type | # Households | % Households |
| Dial-Up Internet | 0 | 0.0% |
| Broadband Home | 0 | 0.0% |
| Cellular Data Only | 18 | 34.6% |
| Satellite Internet | 0 | 0.0% |
| No Internet | 34 | 65.4% |
| Total | 52 | 100.0% |
Clayton Summary
Clayton is a small town located in the state of Washington, United States. It is situated in the south-central part of the state, in the county of Pierce. The town is located on the banks of the Puyallup River, and is part of the Tacoma metropolitan area. The population of Clayton was estimated to be 1,845 in 2019.
History
Clayton was first settled in 1853 by a group of settlers from the East Coast. The town was named after the first settler, William Clayton, who was a former sea captain. The town was originally a logging and farming community, and the first post office was established in 1854.
In the late 19th century, the town became a popular destination for tourists, and the first hotel was built in 1891. The town was incorporated in 1909, and the first mayor was elected in 1910.
Geography
Clayton is located in the south-central part of Washington, in the county of Pierce. The town is situated on the banks of the Puyallup River, and is part of the Tacoma metropolitan area. The town is surrounded by forests and mountains, and is located near the Mount Rainier National Park.
The climate in Clayton is mild and temperate, with warm summers and cool winters. The average annual temperature is around 50°F (10°C). The average annual precipitation is around 40 inches (101 cm).
Economy
The economy of Clayton is mainly based on tourism and agriculture. The town is a popular destination for tourists, and there are several hotels and restaurants in the area. The town is also home to several farms, which produce a variety of crops, including apples, cherries, and vegetables.
The town is also home to several small businesses, including a grocery store, a hardware store, and a gas station. The town is also home to a number of manufacturing companies, which produce a variety of products, including furniture, clothing, and electronics.
Demographics
The population of Clayton was estimated to be 1,845 in 2019. The town has a diverse population, with people from a variety of backgrounds and ethnicities. The majority of the population is white (83.3%), followed by Hispanic or Latino (7.2%), Asian (3.2%), and African American (2.2%).
The median household income in Clayton is $50,945, and the median home value is $272,400. The town has a high rate of homeownership, with 73.3% of the population owning their own homes. The town also has a high rate of educational attainment, with 87.2% of the population having a high school diploma or higher.
Conclusion
Clayton is a small town located in the state of Washington, United States. It is situated in the south-central part of the state, in the county of Pierce. The town is located on the banks of the Puyallup River, and is part of the Tacoma metropolitan area. The population of Clayton was estimated to be 1,845 in 2019. The economy of Clayton is mainly based on tourism and agriculture, and the town is a popular destination for tourists. The town has a diverse population, with people from a variety of backgrounds and ethnicities. The median household income in Clayton is $50,945, and the median home value is $272,400. Clayton is a great place to live, work, and visit, and is a great example of a small town in Washington.
Common Questions
What is Per Capita Income in Clayton?
Per Capita income in Clayton is $23,464.
What is the Median Family Income in Clayton?
Median Family Income in Clayton is $46,667.
What is the Median Household income in Clayton?
Median Household Income in Clayton is $46,667.
What is Income or Wage Gap in Clayton?
Income or Wage Gap in Clayton is 26.7%.
Women in Clayton earn 73.3 cents for every dollar earned by a man.
What is Inequality or Gini Index in Clayton?
Inequality or Gini Index in Clayton is 0.09.
What is the Total Population of Clayton?
Total Population of Clayton is 127.
What is the Total Male Population of Clayton?
Total Male Population of Clayton is 22.
What is the Total Female Population of Clayton?
Total Female Population of Clayton is 105.
What is the Ratio of Males per 100 Females in Clayton?
There are 20.95 Males per 100 Females in Clayton.
What is the Ratio of Females per 100 Males in Clayton?
There are 477.27 Females per 100 Males in Clayton.
What is the Median Population Age in Clayton?
Median Population Age in Clayton is 36.9 Years.
What is the Average Family Size in Clayton
Average Family Size in Clayton is 2.4 People.
What is the Average Household Size in Clayton
Average Household Size in Clayton is 2.4 People.
How Large is the Labor Force in Clayton?
There are 75 People in the Labor Forcein in Clayton.
What is the Percentage of People in the Labor Force in Clayton?
63.6% of People are in the Labor Force in Clayton.