Cities with the Highest Population Density in Michigan
RELATED REPORTS & OPTIONS
Highest Population Density
Michigan
Compare Cities
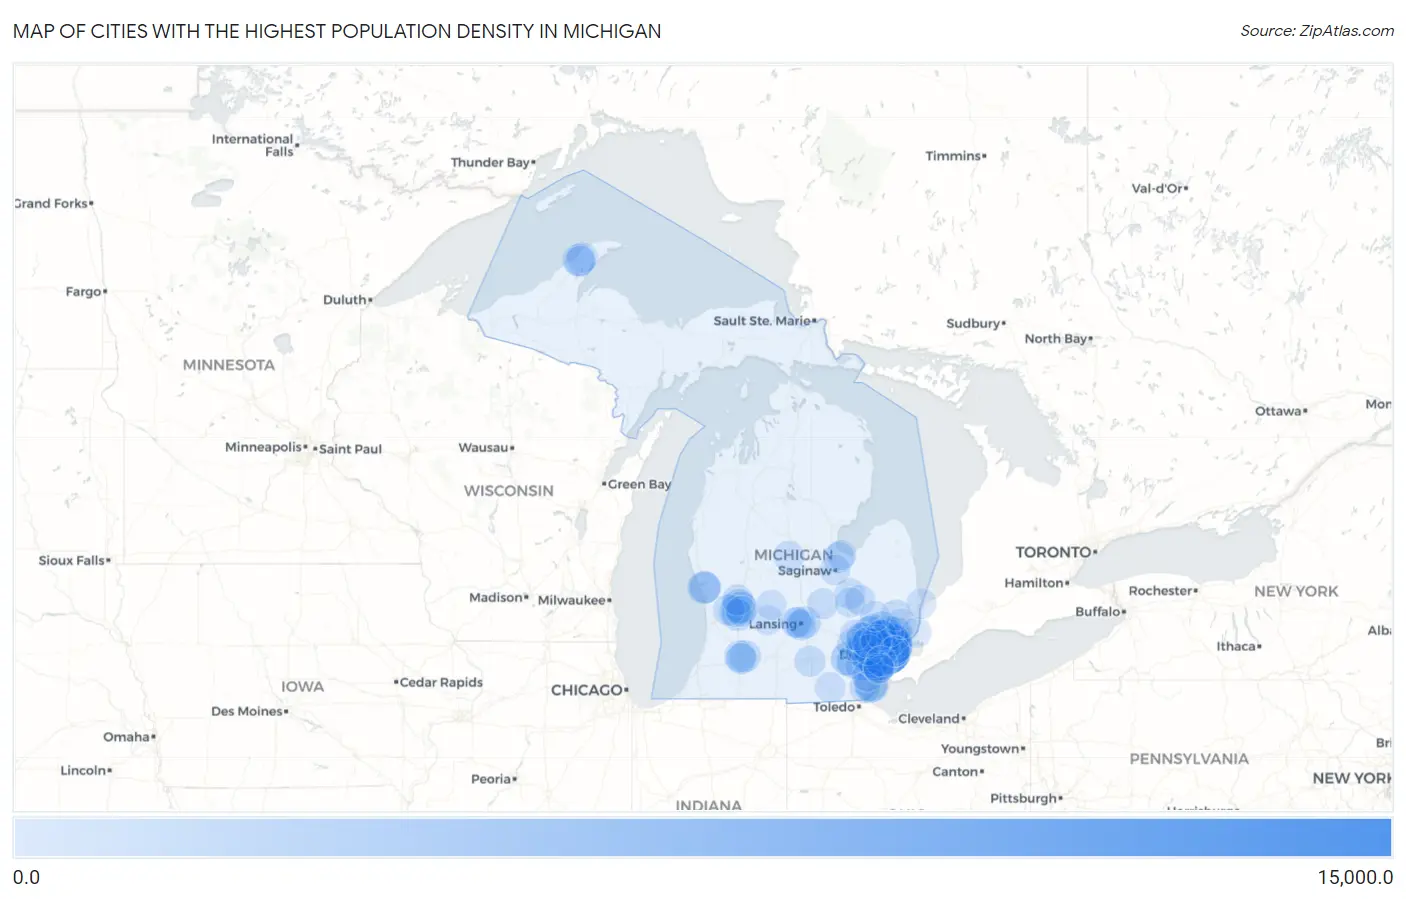
Map of Cities with the Highest Population Density in Michigan
0.0
15,000.0
Cities with the Highest Population Density in Michigan
| City | People / Sq Mi | vs State | vs National | |
| 1. | Hamtramck | 13,348.9 | 177.9(+13.2k)#1 | 0.0(+13.3k)#69 |
| 2. | Lincoln Park | 6,815.7 | 177.9(+6.64k)#2 | 0.0(+6.82k)#449 |
| 3. | Eastpointe | 6,621.2 | 177.9(+6.44k)#3 | 0.0(+6.62k)#490 |
| 4. | Harper Woods | 5,824.6 | 177.9(+5.65k)#4 | 0.0(+5.82k)#667 |
| 5. | Berkley | 5,803.2 | 177.9(+5.63k)#5 | 0.0(+5.80k)#675 |
| 6. | Oak Park | 5,740.0 | 177.9(+5.56k)#6 | 0.0(+5.74k)#692 |
| 7. | Hazel Park | 5,355.1 | 177.9(+5.18k)#7 | 0.0(+5.36k)#809 |
| 8. | Dearborn Heights | 5,328.4 | 177.9(+5.15k)#8 | 0.0(+5.33k)#815 |
| 9. | Clawson | 5,186.0 | 177.9(+5.01k)#9 | 0.0(+5.19k)#880 |
| 10. | Grosse Pointe Woods | 5,053.1 | 177.9(+4.88k)#10 | 0.0(+5.05k)#935 |
| 11. | Ferndale | 4,979.8 | 177.9(+4.80k)#11 | 0.0(+4.98k)#956 |
| 12. | Woodland Beach | 4,974.2 | 177.9(+4.80k)#12 | 0.0(+4.97k)#962 |
| 13. | Royal Oak | 4,930.8 | 177.9(+4.75k)#13 | 0.0(+4.93k)#978 |
| 14. | Keego Harbor | 4,873.0 | 177.9(+4.70k)#14 | 0.0(+4.87k)#1,004 |
| 15. | Center Line | 4,862.3 | 177.9(+4.68k)#15 | 0.0(+4.86k)#1,008 |
| 16. | Roseville | 4,820.9 | 177.9(+4.64k)#16 | 0.0(+4.82k)#1,029 |
| 17. | Garden City | 4,649.1 | 177.9(+4.47k)#17 | 0.0(+4.65k)#1,111 |
| 18. | Melvindale | 4,599.3 | 177.9(+4.42k)#18 | 0.0(+4.60k)#1,139 |
| 19. | Pleasant Ridge | 4,580.5 | 177.9(+4.40k)#19 | 0.0(+4.58k)#1,147 |
| 20. | Ypsilanti | 4,533.3 | 177.9(+4.36k)#20 | 0.0(+4.53k)#1,171 |
| 21. | Birmingham | 4,530.8 | 177.9(+4.35k)#21 | 0.0(+4.53k)#1,172 |
| 22. | Detroit | 4,463.4 | 177.9(+4.29k)#22 | 0.0(+4.46k)#1,220 |
| 23. | Dearborn | 4,429.2 | 177.9(+4.25k)#23 | 0.0(+4.43k)#1,232 |
| 24. | Southgate | 4,364.3 | 177.9(+4.19k)#24 | 0.0(+4.36k)#1,265 |
| 25. | Grand Rapids | 4,348.7 | 177.9(+4.17k)#25 | 0.0(+4.35k)#1,276 |
| 26. | Farmington | 4,321.8 | 177.9(+4.14k)#26 | 0.0(+4.32k)#1,288 |
| 27. | Huntington Woods | 4,278.9 | 177.9(+4.10k)#27 | 0.0(+4.28k)#1,315 |
| 28. | Ann Arbor | 4,208.5 | 177.9(+4.03k)#28 | 0.0(+4.21k)#1,351 |
| 29. | Plymouth | 4,194.2 | 177.9(+4.02k)#29 | 0.0(+4.19k)#1,361 |
| 30. | Westland | 4,153.1 | 177.9(+3.98k)#30 | 0.0(+4.15k)#1,392 |
| 31. | Inkster | 4,138.9 | 177.9(+3.96k)#31 | 0.0(+4.14k)#1,397 |
| 32. | St Clair Shores | 4,079.9 | 177.9(+3.90k)#32 | 0.0(+4.08k)#1,422 |
| 33. | Allen Park | 4,056.4 | 177.9(+3.88k)#33 | 0.0(+4.06k)#1,446 |
| 34. | Roosevelt Park | 4,035.3 | 177.9(+3.86k)#34 | 0.0(+4.04k)#1,467 |
| 35. | Madison Heights | 4,031.5 | 177.9(+3.85k)#35 | 0.0(+4.03k)#1,468 |
| 36. | Warren | 4,031.3 | 177.9(+3.85k)#36 | 0.0(+4.03k)#1,469 |
| 37. | Mount Clemens | 3,736.0 | 177.9(+3.56k)#37 | 0.0(+3.74k)#1,678 |
| 38. | Sterling Heights | 3,648.0 | 177.9(+3.47k)#38 | 0.0(+3.65k)#1,755 |
| 39. | Calumet | 3,633.1 | 177.9(+3.46k)#39 | 0.0(+3.63k)#1,767 |
| 40. | Wyandotte | 3,568.2 | 177.9(+3.39k)#40 | 0.0(+3.57k)#1,827 |
| 41. | Fraser | 3,534.3 | 177.9(+3.36k)#41 | 0.0(+3.53k)#1,860 |
| 42. | Rochester | 3,393.3 | 177.9(+3.22k)#42 | 0.0(+3.39k)#1,981 |
| 43. | Belleville | 3,364.6 | 177.9(+3.19k)#43 | 0.0(+3.36k)#2,007 |
| 44. | East Grand Rapids | 3,363.6 | 177.9(+3.19k)#44 | 0.0(+3.36k)#2,008 |
| 45. | East Lansing | 3,363.3 | 177.9(+3.19k)#45 | 0.0(+3.36k)#2,009 |
| 46. | Cutlerville | 3,359.5 | 177.9(+3.18k)#46 | 0.0(+3.36k)#2,016 |
| 47. | Detroit Beach | 3,353.7 | 177.9(+3.18k)#47 | 0.0(+3.35k)#2,023 |
| 48. | Eastwood | 3,305.4 | 177.9(+3.13k)#48 | 0.0(+3.31k)#2,073 |
| 49. | Westwood | 3,172.5 | 177.9(+2.99k)#49 | 0.0(+3.17k)#2,234 |
| 50. | South Lyon | 3,157.0 | 177.9(+2.98k)#50 | 0.0(+3.16k)#2,250 |
| 51. | Muskegon Heights | 3,131.5 | 177.9(+2.95k)#51 | 0.0(+3.13k)#2,275 |
| 52. | Grosse Pointe Park | 3,107.5 | 177.9(+2.93k)#52 | 0.0(+3.11k)#2,298 |
| 53. | Wyoming | 3,079.9 | 177.9(+2.90k)#53 | 0.0(+3.08k)#2,332 |
| 54. | Pontiac | 3,064.4 | 177.9(+2.89k)#54 | 0.0(+3.06k)#2,352 |
| 55. | Walled Lake | 3,046.6 | 177.9(+2.87k)#55 | 0.0(+3.05k)#2,387 |
| 56. | Highland Park | 3,046.1 | 177.9(+2.87k)#56 | 0.0(+3.05k)#2,389 |
| 57. | Northville | 2,966.3 | 177.9(+2.79k)#57 | 0.0(+2.97k)#2,500 |
| 58. | Edgemont Park | 2,954.8 | 177.9(+2.78k)#58 | 0.0(+2.95k)#2,513 |
| 59. | Utica | 2,934.0 | 177.9(+2.76k)#59 | 0.0(+2.93k)#2,546 |
| 60. | Jenison | 2,924.9 | 177.9(+2.75k)#60 | 0.0(+2.92k)#2,557 |
| 61. | Wayne | 2,922.8 | 177.9(+2.74k)#61 | 0.0(+2.92k)#2,559 |
| 62. | Kalamazoo | 2,921.9 | 177.9(+2.74k)#62 | 0.0(+2.92k)#2,560 |
| 63. | Bay City | 2,921.7 | 177.9(+2.74k)#63 | 0.0(+2.92k)#2,561 |
| 64. | Southfield | 2,903.2 | 177.9(+2.73k)#64 | 0.0(+2.90k)#2,587 |
| 65. | Jackson | 2,872.3 | 177.9(+2.69k)#65 | 0.0(+2.87k)#2,634 |
| 66. | Lansing | 2,845.5 | 177.9(+2.67k)#66 | 0.0(+2.85k)#2,680 |
| 67. | Mount Pleasant | 2,800.2 | 177.9(+2.62k)#67 | 0.0(+2.80k)#2,736 |
| 68. | Armada | 2,758.5 | 177.9(+2.58k)#68 | 0.0(+2.76k)#2,790 |
| 69. | South Monroe | 2,745.9 | 177.9(+2.57k)#69 | 0.0(+2.75k)#2,810 |
| 70. | Mount Morris | 2,745.5 | 177.9(+2.57k)#70 | 0.0(+2.75k)#2,812 |
| 71. | Copper City | 2,730.3 | 177.9(+2.55k)#71 | 0.0(+2.73k)#2,836 |
| 72. | Owosso | 2,727.6 | 177.9(+2.55k)#72 | 0.0(+2.73k)#2,841 |
| 73. | Lathrup Village | 2,710.4 | 177.9(+2.53k)#73 | 0.0(+2.71k)#2,874 |
| 74. | Carleton | 2,681.8 | 177.9(+2.50k)#74 | 0.0(+2.68k)#2,913 |
| 75. | Wolverine Lake | 2,681.7 | 177.9(+2.50k)#75 | 0.0(+2.68k)#2,914 |
| 76. | Comstock Park | 2,675.0 | 177.9(+2.50k)#76 | 0.0(+2.67k)#2,922 |
| 77. | Taylor | 2,667.1 | 177.9(+2.49k)#77 | 0.0(+2.67k)#2,933 |
| 78. | Riverview | 2,659.0 | 177.9(+2.48k)#78 | 0.0(+2.66k)#2,946 |
| 79. | Livonia | 2,651.9 | 177.9(+2.47k)#79 | 0.0(+2.65k)#2,957 |
| 80. | Beverly Hills | 2,615.2 | 177.9(+2.44k)#80 | 0.0(+2.62k)#3,023 |
| 81. | Troy | 2,596.6 | 177.9(+2.42k)#81 | 0.0(+2.60k)#3,070 |
| 82. | Waverly | 2,595.3 | 177.9(+2.42k)#82 | 0.0(+2.60k)#3,074 |
| 83. | Kentwood | 2,582.3 | 177.9(+2.40k)#83 | 0.0(+2.58k)#3,098 |
| 84. | Laurium | 2,579.1 | 177.9(+2.40k)#84 | 0.0(+2.58k)#3,105 |
| 85. | Davison | 2,576.8 | 177.9(+2.40k)#85 | 0.0(+2.58k)#3,109 |
| 86. | Milford | 2,565.9 | 177.9(+2.39k)#86 | 0.0(+2.57k)#3,132 |
| 87. | Adrian | 2,530.3 | 177.9(+2.35k)#87 | 0.0(+2.53k)#3,198 |
| 88. | Farmington Hills | 2,513.9 | 177.9(+2.34k)#88 | 0.0(+2.51k)#3,227 |
| 89. | Ecorse | 2,508.3 | 177.9(+2.33k)#89 | 0.0(+2.51k)#3,243 |
| 90. | Grosse Pointe | 2,497.0 | 177.9(+2.32k)#90 | 0.0(+2.50k)#3,262 |
| 91. | Saginaw | 2,493.0 | 177.9(+2.32k)#91 | 0.0(+2.49k)#3,273 |
| 92. | New Haven | 2,455.2 | 177.9(+2.28k)#92 | 0.0(+2.46k)#3,327 |
| 93. | Trenton | 2,444.0 | 177.9(+2.27k)#93 | 0.0(+2.44k)#3,351 |
| 94. | Algonac | 2,418.3 | 177.9(+2.24k)#94 | 0.0(+2.42k)#3,423 |
| 95. | Essexville | 2,408.5 | 177.9(+2.23k)#95 | 0.0(+2.41k)#3,442 |
| 96. | Flint | 2,404.3 | 177.9(+2.23k)#96 | 0.0(+2.40k)#3,451 |
| 97. | Oxford | 2,393.8 | 177.9(+2.22k)#97 | 0.0(+2.39k)#3,480 |
| 98. | Lake Odessa | 2,393.2 | 177.9(+2.22k)#98 | 0.0(+2.39k)#3,481 |
| 99. | Ionia | 2,364.5 | 177.9(+2.19k)#99 | 0.0(+2.36k)#3,544 |
| 100. | Port Huron | 2,357.9 | 177.9(+2.18k)#100 | 0.0(+2.36k)#3,556 |
Common Questions
What are the Top 10 Cities with the Highest Population Density in Michigan?
Top 10 Cities with the Highest Population Density in Michigan are:
#1
13,348.9
#2
6,815.7
#3
6,621.2
#4
5,824.6
#5
5,803.2
#6
5,740.0
#7
5,355.1
#8
5,328.4
#9
5,186.0
#10
5,053.1
What city has the Highest Population Density in Michigan?
Hamtramck has the Highest Population Density in Michigan with 13,348.9.
What is the Population Density in the State of Michigan?
Population Density in Michigan is 177.9.