Cities with the Highest Population Density in New York
RELATED REPORTS & OPTIONS
Highest Population Density
New York
Compare Cities
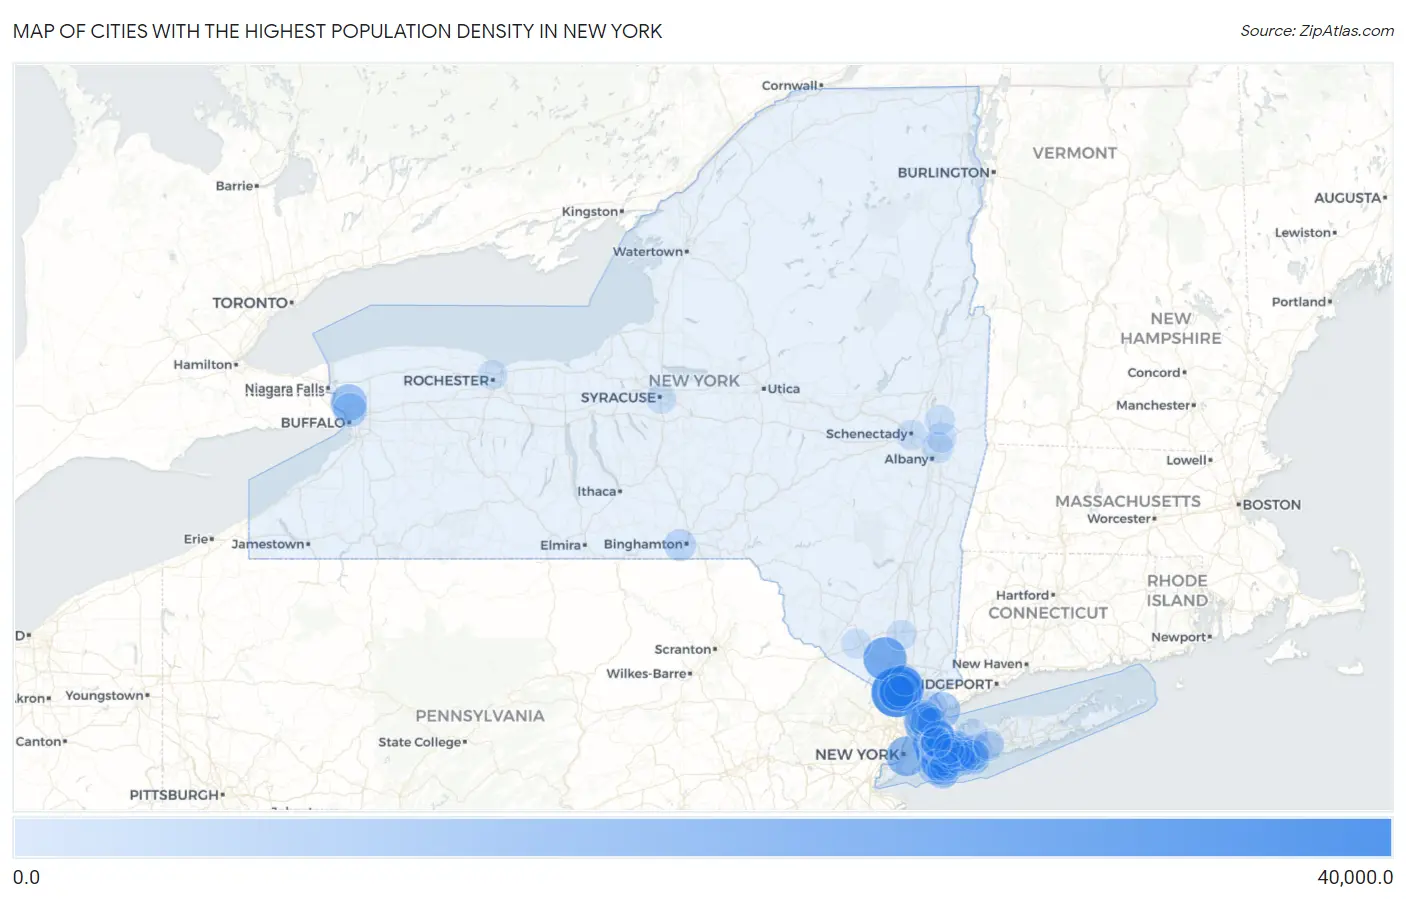
Map of Cities with the Highest Population Density in New York
0.0
40,000.0
Cities with the Highest Population Density in New York
| City | People / Sq Mi | vs State | vs National | |
| 1. | Kaser | 32,123.5 | 424.3(+31.7k)#1 | 0.0(+32.1k)#7 |
| 2. | New Square | 26,236.9 | 424.3(+25.8k)#2 | 0.0(+26.2k)#9 |
| 3. | Great Neck Plaza | 23,967.2 | 424.3(+23.5k)#3 | 0.0(+24.0k)#12 |
| 4. | Kiryas Joel | 23,086.7 | 424.3(+22.7k)#4 | 0.0(+23.1k)#13 |
| 5. | South Floral Park | 19,848.5 | 424.3(+19.4k)#5 | 0.0(+19.8k)#23 |
| 6. | New York | 18,273.7 | 424.3(+17.8k)#6 | 0.0(+18.3k)#33 |
| 7. | Bellerose Terrace | 17,205.7 | 424.3(+16.8k)#7 | 0.0(+17.2k)#40 |
| 8. | Mount Vernon | 16,506.8 | 424.3(+16.1k)#8 | 0.0(+16.5k)#42 |
| 9. | Spring Valley | 16,405.4 | 424.3(+16.0k)#9 | 0.0(+16.4k)#43 |
| 10. | Hempstead | 15,863.1 | 424.3(+15.4k)#10 | 0.0(+15.9k)#47 |
| 11. | Tonawanda | 14,009.3 | 424.3(+13.6k)#11 | 0.0(+14.0k)#58 |
| 12. | Port Chester | 13,055.5 | 424.3(+12.6k)#12 | 0.0(+13.1k)#72 |
| 13. | Monsey | 12,287.9 | 424.3(+11.9k)#13 | 0.0(+12.3k)#88 |
| 14. | New Hyde Park | 12,091.8 | 424.3(+11.7k)#14 | 0.0(+12.1k)#92 |
| 15. | Williston Park | 12,060.1 | 424.3(+11.6k)#15 | 0.0(+12.1k)#93 |
| 16. | Tuckahoe | 11,623.5 | 424.3(+11.2k)#16 | 0.0(+11.6k)#102 |
| 17. | Valley Stream | 11,549.4 | 424.3(+11.1k)#17 | 0.0(+11.5k)#104 |
| 18. | Mineola | 11,319.9 | 424.3(+10.9k)#18 | 0.0(+11.3k)#111 |
| 19. | Stewart Manor | 11,145.3 | 424.3(+10.7k)#19 | 0.0(+11.1k)#117 |
| 20. | Island Park | 11,132.0 | 424.3(+10.7k)#20 | 0.0(+11.1k)#118 |
| 21. | Franklin Square | 11,109.9 | 424.3(+10.7k)#21 | 0.0(+11.1k)#119 |
| 22. | Floral Park | 11,098.7 | 424.3(+10.7k)#22 | 0.0(+11.1k)#120 |
| 23. | Elmont | 11,089.8 | 424.3(+10.7k)#23 | 0.0(+11.1k)#121 |
| 24. | Manorhaven | 10,918.4 | 424.3(+10.5k)#24 | 0.0(+10.9k)#127 |
| 25. | Cedarhurst | 10,841.5 | 424.3(+10.4k)#25 | 0.0(+10.8k)#132 |
| 26. | Roosevelt | 10,811.9 | 424.3(+10.4k)#26 | 0.0(+10.8k)#134 |
| 27. | Kenmore | 10,574.2 | 424.3(+10.1k)#27 | 0.0(+10.6k)#141 |
| 28. | Yonkers | 10,367.2 | 424.3(+9.94k)#28 | 0.0(+10.4k)#147 |
| 29. | Garden City South | 10,292.5 | 424.3(+9.87k)#29 | 0.0(+10.3k)#154 |
| 30. | New Cassel | 10,152.5 | 424.3(+9.73k)#30 | 0.0(+10.2k)#158 |
| 31. | Lynbrook | 10,103.2 | 424.3(+9.68k)#31 | 0.0(+10.1k)#162 |
| 32. | North Valley Stream | 10,037.1 | 424.3(+9.61k)#32 | 0.0(+10.0k)#164 |
| 33. | East Rockaway | 9,762.2 | 424.3(+9.34k)#33 | 0.0(+9.76k)#173 |
| 34. | Freeport | 9,098.9 | 424.3(+8.67k)#34 | 0.0(+9.10k)#210 |
| 35. | Long Beach | 8,929.6 | 424.3(+8.51k)#35 | 0.0(+8.93k)#221 |
| 36. | Pelham | 8,855.6 | 424.3(+8.43k)#36 | 0.0(+8.86k)#225 |
| 37. | North Amityville | 8,642.0 | 424.3(+8.22k)#37 | 0.0(+8.64k)#237 |
| 38. | Hewlett | 8,458.9 | 424.3(+8.03k)#38 | 0.0(+8.46k)#253 |
| 39. | Saddle Rock Estates | 8,347.4 | 424.3(+7.92k)#39 | 0.0(+8.35k)#260 |
| 40. | Binghamton University | 8,263.6 | 424.3(+7.84k)#40 | 0.0(+8.26k)#263 |
| 41. | Great Neck | 8,191.2 | 424.3(+7.77k)#41 | 0.0(+8.19k)#264 |
| 42. | Malverne | 8,074.4 | 424.3(+7.65k)#42 | 0.0(+8.07k)#270 |
| 43. | North Bellmore | 8,051.4 | 424.3(+7.63k)#43 | 0.0(+8.05k)#272 |
| 44. | Bellerose | 7,965.4 | 424.3(+7.54k)#44 | 0.0(+7.97k)#279 |
| 45. | University Gardens | 7,870.3 | 424.3(+7.45k)#45 | 0.0(+7.87k)#291 |
| 46. | Garden City Park | 7,812.7 | 424.3(+7.39k)#46 | 0.0(+7.81k)#298 |
| 47. | Rockville Centre | 7,740.7 | 424.3(+7.32k)#47 | 0.0(+7.74k)#309 |
| 48. | Farmingdale | 7,727.8 | 424.3(+7.30k)#48 | 0.0(+7.73k)#311 |
| 49. | Massapequa Park | 7,589.0 | 424.3(+7.16k)#49 | 0.0(+7.59k)#324 |
| 50. | Albertson | 7,524.4 | 424.3(+7.10k)#50 | 0.0(+7.52k)#333 |
| 51. | South Valley Stream | 7,508.7 | 424.3(+7.08k)#51 | 0.0(+7.51k)#335 |
| 52. | West Hempstead | 7,484.5 | 424.3(+7.06k)#52 | 0.0(+7.48k)#340 |
| 53. | Levittown | 7,441.1 | 424.3(+7.02k)#53 | 0.0(+7.44k)#347 |
| 54. | Herricks | 7,353.8 | 424.3(+6.93k)#54 | 0.0(+7.35k)#354 |
| 55. | Salisbury | 7,310.9 | 424.3(+6.89k)#55 | 0.0(+7.31k)#359 |
| 56. | North New Hyde Park | 7,294.1 | 424.3(+6.87k)#56 | 0.0(+7.29k)#361 |
| 57. | Baldwin | 7,180.2 | 424.3(+6.76k)#57 | 0.0(+7.18k)#381 |
| 58. | Lindenhurst | 7,130.2 | 424.3(+6.71k)#58 | 0.0(+7.13k)#396 |
| 59. | North Merrick | 7,072.7 | 424.3(+6.65k)#59 | 0.0(+7.07k)#402 |
| 60. | Watervliet | 7,040.7 | 424.3(+6.62k)#60 | 0.0(+7.04k)#405 |
| 61. | West Haverstraw | 6,926.6 | 424.3(+6.50k)#61 | 0.0(+6.93k)#429 |
| 62. | South Farmingdale | 6,850.7 | 424.3(+6.43k)#62 | 0.0(+6.85k)#440 |
| 63. | Thomaston | 6,831.9 | 424.3(+6.41k)#63 | 0.0(+6.83k)#445 |
| 64. | Bronxville | 6,765.3 | 424.3(+6.34k)#64 | 0.0(+6.77k)#459 |
| 65. | Westbury | 6,745.6 | 424.3(+6.32k)#65 | 0.0(+6.75k)#464 |
| 66. | Manhasset Hills | 6,603.8 | 424.3(+6.18k)#66 | 0.0(+6.60k)#495 |
| 67. | Hicksville | 6,485.7 | 424.3(+6.06k)#67 | 0.0(+6.49k)#511 |
| 68. | Plainedge | 6,394.4 | 424.3(+5.97k)#68 | 0.0(+6.39k)#524 |
| 69. | Port Washington North | 6,377.9 | 424.3(+5.95k)#69 | 0.0(+6.38k)#527 |
| 70. | Russell Gardens | 6,361.1 | 424.3(+5.94k)#70 | 0.0(+6.36k)#529 |
| 71. | Copiague | 6,329.7 | 424.3(+5.91k)#71 | 0.0(+6.33k)#537 |
| 72. | Huntington Station | 6,320.1 | 424.3(+5.90k)#72 | 0.0(+6.32k)#538 |
| 73. | Hillcrest | 6,313.4 | 424.3(+5.89k)#73 | 0.0(+6.31k)#540 |
| 74. | Baxter Estates | 6,306.1 | 424.3(+5.88k)#74 | 0.0(+6.31k)#544 |
| 75. | Great Neck Gardens | 6,303.7 | 424.3(+5.88k)#75 | 0.0(+6.30k)#545 |
| 76. | Woodmere | 6,265.8 | 424.3(+5.84k)#76 | 0.0(+6.27k)#556 |
| 77. | Wyandanch | 6,264.6 | 424.3(+5.84k)#77 | 0.0(+6.26k)#558 |
| 78. | Schenectady | 6,248.7 | 424.3(+5.82k)#78 | 0.0(+6.25k)#561 |
| 79. | New Rochelle | 6,153.5 | 424.3(+5.73k)#79 | 0.0(+6.15k)#581 |
| 80. | North Massapequa | 6,074.8 | 424.3(+5.65k)#80 | 0.0(+6.07k)#599 |
| 81. | Eastchester | 6,053.6 | 424.3(+5.63k)#81 | 0.0(+6.05k)#602 |
| 82. | White Plains | 6,037.4 | 424.3(+5.61k)#82 | 0.0(+6.04k)#605 |
| 83. | Newburgh | 6,020.4 | 424.3(+5.60k)#83 | 0.0(+6.02k)#608 |
| 84. | North Wantagh | 5,995.1 | 424.3(+5.57k)#84 | 0.0(+6.00k)#615 |
| 85. | Larchmont | 5,971.8 | 424.3(+5.55k)#85 | 0.0(+5.97k)#623 |
| 86. | Seaford | 5,953.6 | 424.3(+5.53k)#86 | 0.0(+5.95k)#627 |
| 87. | Brentwood | 5,947.1 | 424.3(+5.52k)#87 | 0.0(+5.95k)#629 |
| 88. | Harbor Isle | 5,941.4 | 424.3(+5.52k)#88 | 0.0(+5.94k)#633 |
| 89. | Waterford | 5,936.0 | 424.3(+5.51k)#89 | 0.0(+5.94k)#635 |
| 90. | East Meadow | 5,832.7 | 424.3(+5.41k)#90 | 0.0(+5.83k)#666 |
| 91. | Uniondale | 5,818.9 | 424.3(+5.39k)#91 | 0.0(+5.82k)#670 |
| 92. | Oceanside | 5,806.3 | 424.3(+5.38k)#92 | 0.0(+5.81k)#674 |
| 93. | North Lindenhurst | 5,785.9 | 424.3(+5.36k)#93 | 0.0(+5.79k)#678 |
| 94. | North Bay Shore | 5,760.3 | 424.3(+5.34k)#94 | 0.0(+5.76k)#687 |
| 95. | Syracuse | 5,708.7 | 424.3(+5.28k)#95 | 0.0(+5.71k)#704 |
| 96. | Rochester | 5,686.4 | 424.3(+5.26k)#96 | 0.0(+5.69k)#709 |
| 97. | Kensington | 5,679.1 | 424.3(+5.25k)#97 | 0.0(+5.68k)#711 |
| 98. | Middletown | 5,668.0 | 424.3(+5.24k)#98 | 0.0(+5.67k)#715 |
| 99. | Mechanicville | 5,655.8 | 424.3(+5.23k)#99 | 0.0(+5.66k)#717 |
| 100. | Carle Place | 5,618.5 | 424.3(+5.19k)#100 | 0.0(+5.62k)#724 |
Common Questions
What are the Top 10 Cities with the Highest Population Density in New York?
Top 10 Cities with the Highest Population Density in New York are:
#1
32,123.5
#2
26,236.9
#3
23,967.2
#4
23,086.7
#5
19,848.5
#6
18,273.7
#7
17,205.7
#8
16,506.8
#9
16,405.4
#10
15,863.1
What city has the Highest Population Density in New York?
Kaser has the Highest Population Density in New York with 32,123.5.
What is the Population Density in the State of New York?
Population Density in New York is 424.3.