Cities with the Highest Population Density in Massachusetts
RELATED REPORTS & OPTIONS
Highest Population Density
Massachusetts
Compare Cities
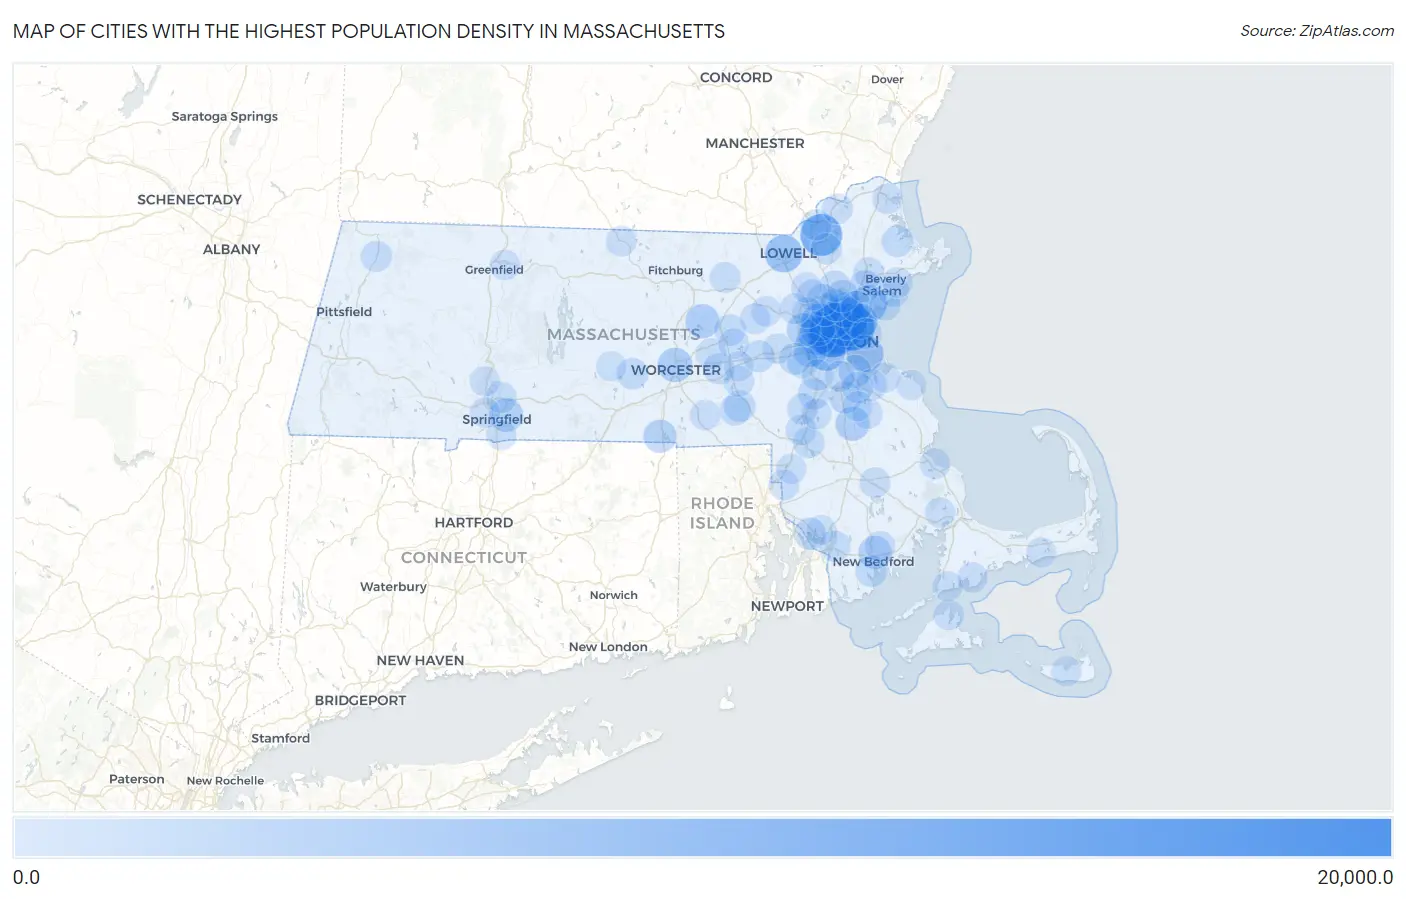
Map of Cities with the Highest Population Density in Massachusetts
0.0
20,000.0
Cities with the Highest Population Density in Massachusetts
| City | People / Sq Mi | vs State | vs National | |
| 1. | Somerville | 19,113.6 | 895.3(+18.2k)#1 | 0.0(+19.1k)#26 |
| 2. | Cambridge | 16,670.4 | 895.3(+15.8k)#2 | 0.0(+16.7k)#41 |
| 3. | Chelsea | 16,259.1 | 895.3(+15.4k)#3 | 0.0(+16.3k)#44 |
| 4. | Everett | 13,309.6 | 895.3(+12.4k)#4 | 0.0(+13.3k)#70 |
| 5. | Malden | 12,897.9 | 895.3(+12.0k)#5 | 0.0(+12.9k)#74 |
| 6. | Lawrence | 11,963.8 | 895.3(+11.1k)#6 | 0.0(+12.0k)#94 |
| 7. | Brookline | 9,201.6 | 895.3(+8.31k)#7 | 0.0(+9.20k)#204 |
| 8. | Watertown Town | 8,544.4 | 895.3(+7.65k)#8 | 0.0(+8.54k)#247 |
| 9. | Arlington | 8,379.2 | 895.3(+7.48k)#9 | 0.0(+8.38k)#258 |
| 10. | Lowell | 7,910.4 | 895.3(+7.02k)#10 | 0.0(+7.91k)#284 |
| 11. | Lynn | 7,456.9 | 895.3(+6.56k)#11 | 0.0(+7.46k)#343 |
| 12. | Boston | 7,443.1 | 895.3(+6.55k)#12 | 0.0(+7.44k)#345 |
| 13. | Medford | 7,140.5 | 895.3(+6.25k)#13 | 0.0(+7.14k)#392 |
| 14. | Melrose | 6,191.6 | 895.3(+5.30k)#14 | 0.0(+6.19k)#573 |
| 15. | Revere | 5,975.4 | 895.3(+5.08k)#15 | 0.0(+5.98k)#622 |
| 16. | Belmont | 5,744.8 | 895.3(+4.85k)#16 | 0.0(+5.74k)#690 |
| 17. | Worcester | 5,319.8 | 895.3(+4.42k)#17 | 0.0(+5.32k)#817 |
| 18. | Clinton | 4,928.5 | 895.3(+4.03k)#18 | 0.0(+4.93k)#980 |
| 19. | Newton | 4,880.2 | 895.3(+3.98k)#19 | 0.0(+4.88k)#997 |
| 20. | Brockton | 4,873.9 | 895.3(+3.98k)#20 | 0.0(+4.87k)#1,002 |
| 21. | Waltham | 4,707.1 | 895.3(+3.81k)#21 | 0.0(+4.71k)#1,079 |
| 22. | Springfield | 4,701.9 | 895.3(+3.81k)#22 | 0.0(+4.70k)#1,084 |
| 23. | New Bedford | 4,175.4 | 895.3(+3.28k)#23 | 0.0(+4.18k)#1,379 |
| 24. | Webster | 4,058.1 | 895.3(+3.16k)#24 | 0.0(+4.06k)#1,445 |
| 25. | Quincy | 3,758.7 | 895.3(+2.86k)#25 | 0.0(+3.76k)#1,661 |
| 26. | Winchester | 3,599.4 | 895.3(+2.70k)#26 | 0.0(+3.60k)#1,799 |
| 27. | Stoneham | 3,466.4 | 895.3(+2.57k)#27 | 0.0(+3.47k)#1,922 |
| 28. | Wakefield | 3,343.6 | 895.3(+2.45k)#28 | 0.0(+3.34k)#2,034 |
| 29. | Randolph Town | 3,340.3 | 895.3(+2.44k)#29 | 0.0(+3.34k)#2,036 |
| 30. | Peabody | 3,229.1 | 895.3(+2.33k)#30 | 0.0(+3.23k)#2,174 |
| 31. | Ocean Grove | 3,207.3 | 895.3(+2.31k)#31 | 0.0(+3.21k)#2,199 |
| 32. | Woburn | 3,172.0 | 895.3(+2.28k)#32 | 0.0(+3.17k)#2,235 |
| 33. | Norwood | 2,970.3 | 895.3(+2.08k)#33 | 0.0(+2.97k)#2,489 |
| 34. | Wellesley | 2,840.4 | 895.3(+1.95k)#34 | 0.0(+2.84k)#2,688 |
| 35. | Ipswich | 2,806.3 | 895.3(+1.91k)#35 | 0.0(+2.81k)#2,724 |
| 36. | Bliss Corner | 2,801.6 | 895.3(+1.91k)#36 | 0.0(+2.80k)#2,735 |
| 37. | Mansfield Center | 2,735.3 | 895.3(+1.84k)#37 | 0.0(+2.74k)#2,831 |
| 38. | Framingham | 2,713.3 | 895.3(+1.82k)#38 | 0.0(+2.71k)#2,863 |
| 39. | Weymouth Town | 2,661.1 | 895.3(+1.77k)#39 | 0.0(+2.66k)#2,943 |
| 40. | Braintree Town | 2,660.9 | 895.3(+1.77k)#40 | 0.0(+2.66k)#2,944 |
| 41. | Milford | 2,658.6 | 895.3(+1.76k)#41 | 0.0(+2.66k)#2,947 |
| 42. | Hudson | 2,622.0 | 895.3(+1.73k)#42 | 0.0(+2.62k)#3,014 |
| 43. | Spencer | 2,601.7 | 895.3(+1.71k)#43 | 0.0(+2.60k)#3,056 |
| 44. | Reading | 2,560.5 | 895.3(+1.67k)#44 | 0.0(+2.56k)#3,145 |
| 45. | Needham | 2,514.6 | 895.3(+1.62k)#45 | 0.0(+2.51k)#3,225 |
| 46. | Andover | 2,495.9 | 895.3(+1.60k)#46 | 0.0(+2.50k)#3,265 |
| 47. | Saugus | 2,454.1 | 895.3(+1.56k)#47 | 0.0(+2.45k)#3,329 |
| 48. | Salem | 2,440.1 | 895.3(+1.54k)#48 | 0.0(+2.44k)#3,366 |
| 49. | Hopedale | 2,369.5 | 895.3(+1.47k)#49 | 0.0(+2.37k)#3,536 |
| 50. | Dedham | 2,360.4 | 895.3(+1.47k)#50 | 0.0(+2.36k)#3,553 |
| 51. | Fall River | 2,330.6 | 895.3(+1.44k)#51 | 0.0(+2.33k)#3,617 |
| 52. | Chicopee | 2,326.1 | 895.3(+1.43k)#52 | 0.0(+2.33k)#3,628 |
| 53. | Adams | 2,320.1 | 895.3(+1.42k)#53 | 0.0(+2.32k)#3,643 |
| 54. | Westborough | 2,303.6 | 895.3(+1.41k)#54 | 0.0(+2.30k)#3,678 |
| 55. | Methuen Town | 2,300.9 | 895.3(+1.41k)#55 | 0.0(+2.30k)#3,682 |
| 56. | Winthrop Town | 2,290.1 | 895.3(+1.39k)#56 | 0.0(+2.29k)#3,706 |
| 57. | Swampscott | 2,258.4 | 895.3(+1.36k)#57 | 0.0(+2.26k)#3,782 |
| 58. | Burlington | 2,211.0 | 895.3(+1.32k)#58 | 0.0(+2.21k)#3,907 |
| 59. | Acushnet Center | 2,200.7 | 895.3(+1.31k)#59 | 0.0(+2.20k)#3,936 |
| 60. | Walpole | 2,180.0 | 895.3(+1.28k)#60 | 0.0(+2.18k)#3,986 |
| 61. | Foxborough | 2,164.6 | 895.3(+1.27k)#61 | 0.0(+2.16k)#4,029 |
| 62. | Hopkinton | 2,157.8 | 895.3(+1.26k)#62 | 0.0(+2.16k)#4,046 |
| 63. | Ayer | 2,139.2 | 895.3(+1.24k)#63 | 0.0(+2.14k)#4,099 |
| 64. | Milton | 2,138.8 | 895.3(+1.24k)#64 | 0.0(+2.14k)#4,100 |
| 65. | Lexington | 2,060.5 | 895.3(+1.17k)#65 | 0.0(+2.06k)#4,320 |
| 66. | Northborough | 2,024.2 | 895.3(+1.13k)#66 | 0.0(+2.02k)#4,423 |
| 67. | Hanscom Afb | 2,008.1 | 895.3(+1.11k)#67 | 0.0(+2.01k)#4,473 |
| 68. | Maynard | 1,992.4 | 895.3(+1.10k)#68 | 0.0(+1.99k)#4,540 |
| 69. | Sharon | 1,975.9 | 895.3(+1.08k)#69 | 0.0(+1.98k)#4,608 |
| 70. | Plymouth | 1,973.7 | 895.3(+1.08k)#70 | 0.0(+1.97k)#4,619 |
| 71. | Danvers | 1,968.8 | 895.3(+1.07k)#71 | 0.0(+1.97k)#4,637 |
| 72. | Middleborough Center | 1,941.5 | 895.3(+1.05k)#72 | 0.0(+1.94k)#4,723 |
| 73. | North Seekonk | 1,934.5 | 895.3(+1.04k)#73 | 0.0(+1.93k)#4,739 |
| 74. | Haverhill | 1,888.0 | 895.3(+993)#74 | 0.0(+1.89k)#4,922 |
| 75. | Beverly | 1,880.3 | 895.3(+985)#75 | 0.0(+1.88k)#4,939 |
| 76. | Marlborough | 1,875.9 | 895.3(+981)#76 | 0.0(+1.88k)#4,957 |
| 77. | Winchendon | 1,834.2 | 895.3(+939)#77 | 0.0(+1.83k)#5,110 |
| 78. | Whitinsville | 1,805.2 | 895.3(+910)#78 | 0.0(+1.81k)#5,215 |
| 79. | West Concord | 1,803.8 | 895.3(+909)#79 | 0.0(+1.80k)#5,221 |
| 80. | Vineyard Haven | 1,802.4 | 895.3(+907)#80 | 0.0(+1.80k)#5,229 |
| 81. | Hingham | 1,778.0 | 895.3(+883)#81 | 0.0(+1.78k)#5,318 |
| 82. | Pinehurst | 1,738.6 | 895.3(+843)#82 | 0.0(+1.74k)#5,482 |
| 83. | Falmouth | 1,729.2 | 895.3(+834)#83 | 0.0(+1.73k)#5,522 |
| 84. | White Island Shores | 1,722.3 | 895.3(+827)#84 | 0.0(+1.72k)#5,551 |
| 85. | Newburyport | 1,717.4 | 895.3(+822)#85 | 0.0(+1.72k)#5,578 |
| 86. | Seabrook | 1,684.9 | 895.3(+790)#86 | 0.0(+1.68k)#5,711 |
| 87. | Holyoke | 1,678.6 | 895.3(+783)#87 | 0.0(+1.68k)#5,743 |
| 88. | Attleboro | 1,673.0 | 895.3(+778)#88 | 0.0(+1.67k)#5,776 |
| 89. | Abington | 1,671.8 | 895.3(+777)#89 | 0.0(+1.67k)#5,785 |
| 90. | Turners Falls | 1,670.4 | 895.3(+775)#90 | 0.0(+1.67k)#5,794 |
| 91. | Cochituate | 1,668.4 | 895.3(+773)#91 | 0.0(+1.67k)#5,806 |
| 92. | North Brookfield | 1,656.6 | 895.3(+761)#92 | 0.0(+1.66k)#5,863 |
| 93. | Longmeadow | 1,648.3 | 895.3(+753)#93 | 0.0(+1.65k)#5,907 |
| 94. | West Springfield Town | 1,642.0 | 895.3(+747)#94 | 0.0(+1.64k)#5,941 |
| 95. | Nantucket | 1,605.6 | 895.3(+710)#95 | 0.0(+1.61k)#6,117 |
| 96. | Cordaville | 1,581.1 | 895.3(+686)#96 | 0.0(+1.58k)#6,241 |
| 97. | Holbrook | 1,542.1 | 895.3(+647)#97 | 0.0(+1.54k)#6,464 |
| 98. | Somerset | 1,538.5 | 895.3(+643)#98 | 0.0(+1.54k)#6,481 |
| 99. | South Yarmouth | 1,514.0 | 895.3(+619)#99 | 0.0(+1.51k)#6,604 |
| 100. | North Scituate | 1,492.8 | 895.3(+597)#100 | 0.0(+1.49k)#6,724 |
Common Questions
What are the Top 10 Cities with the Highest Population Density in Massachusetts?
Top 10 Cities with the Highest Population Density in Massachusetts are:
#1
19,113.6
#2
16,670.4
#3
16,259.1
#4
13,309.6
#5
12,897.9
#6
11,963.8
#7
9,201.6
#8
8,544.4
#9
8,379.2
#10
7,910.4
What city has the Highest Population Density in Massachusetts?
Somerville has the Highest Population Density in Massachusetts with 19,113.6.
What is the Population Density in the State of Massachusetts?
Population Density in Massachusetts is 895.3.