Cities with the Highest Population Density in Connecticut
RELATED REPORTS & OPTIONS
Highest Population Density
Connecticut
Compare Cities
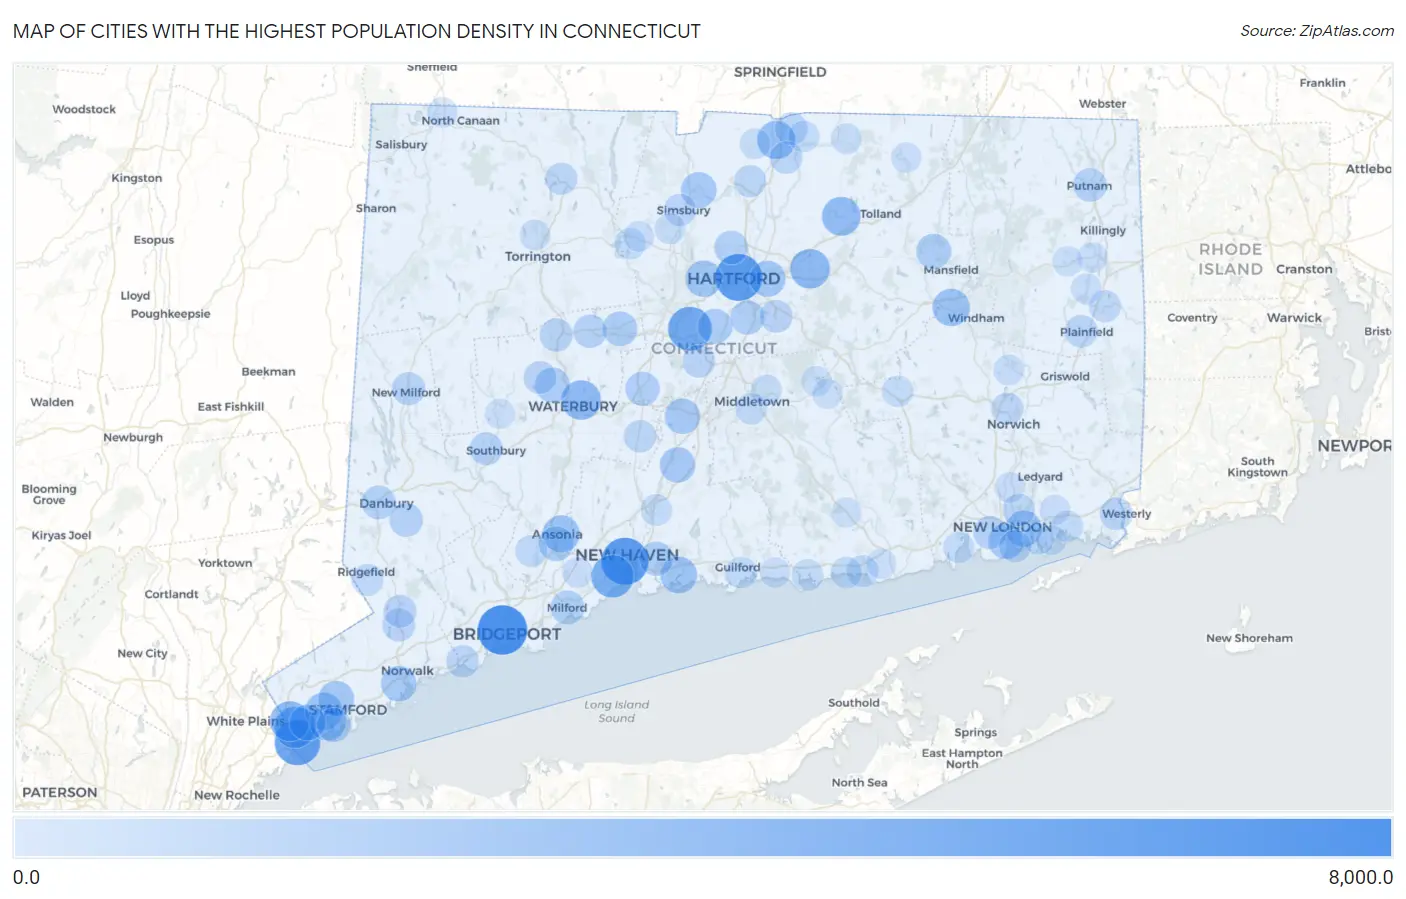
Map of Cities with the Highest Population Density in Connecticut
0.0
8,000.0
Cities with the Highest Population Density in Connecticut
| City | People / Sq Mi | vs State | vs National | |
| 1. | Bridgeport | 7,652.9 | 746.1(+6.91k)#1 | 0.0(+7.65k)#314 |
| 2. | New Haven | 6,750.6 | 746.1(+6.00k)#2 | 0.0(+6.75k)#462 |
| 3. | Hartford | 6,714.9 | 746.1(+5.97k)#3 | 0.0(+6.71k)#471 |
| 4. | Byram | 6,176.1 | 746.1(+5.43k)#4 | 0.0(+6.18k)#577 |
| 5. | New Britain | 5,518.1 | 746.1(+4.77k)#5 | 0.0(+5.52k)#756 |
| 6. | West Haven | 5,078.0 | 746.1(+4.33k)#6 | 0.0(+5.08k)#920 |
| 7. | Pemberwick | 4,664.5 | 746.1(+3.92k)#7 | 0.0(+4.66k)#1,103 |
| 8. | Glenville | 4,169.8 | 746.1(+3.42k)#8 | 0.0(+4.17k)#1,385 |
| 9. | Manchester | 3,996.4 | 746.1(+3.25k)#9 | 0.0(+4.00k)#1,489 |
| 10. | Waterbury | 3,961.4 | 746.1(+3.22k)#10 | 0.0(+3.96k)#1,506 |
| 11. | Rockville | 3,702.0 | 746.1(+2.96k)#11 | 0.0(+3.70k)#1,710 |
| 12. | Thompsonville | 3,479.3 | 746.1(+2.73k)#12 | 0.0(+3.48k)#1,913 |
| 13. | Willimantic | 3,202.5 | 746.1(+2.46k)#13 | 0.0(+3.20k)#2,203 |
| 14. | Cos Cob | 3,193.8 | 746.1(+2.45k)#14 | 0.0(+3.19k)#2,209 |
| 15. | Ansonia | 3,067.6 | 746.1(+2.32k)#15 | 0.0(+3.07k)#2,348 |
| 16. | Branford Center | 2,995.8 | 746.1(+2.25k)#16 | 0.0(+3.00k)#2,450 |
| 17. | West Hartford | 2,883.1 | 746.1(+2.14k)#17 | 0.0(+2.88k)#2,620 |
| 18. | Long Hill | 2,857.6 | 746.1(+2.11k)#18 | 0.0(+2.86k)#2,655 |
| 19. | Riverside | 2,821.2 | 746.1(+2.08k)#19 | 0.0(+2.82k)#2,708 |
| 20. | East Hartford | 2,722.4 | 746.1(+1.98k)#20 | 0.0(+2.72k)#2,850 |
| 21. | Greenwich | 2,715.6 | 746.1(+1.97k)#21 | 0.0(+2.72k)#2,860 |
| 22. | Stamford | 2,606.0 | 746.1(+1.86k)#22 | 0.0(+2.61k)#3,046 |
| 23. | New London | 2,605.3 | 746.1(+1.86k)#23 | 0.0(+2.61k)#3,048 |
| 24. | Tariffville | 2,594.2 | 746.1(+1.85k)#24 | 0.0(+2.59k)#3,078 |
| 25. | Wallingford Center | 2,544.3 | 746.1(+1.80k)#25 | 0.0(+2.54k)#3,174 |
| 26. | Meriden | 2,516.6 | 746.1(+1.77k)#26 | 0.0(+2.52k)#3,220 |
| 27. | Norwalk | 2,506.4 | 746.1(+1.76k)#27 | 0.0(+2.51k)#3,245 |
| 28. | Storrs | 2,353.2 | 746.1(+1.61k)#28 | 0.0(+2.35k)#3,569 |
| 29. | Oakville | 2,342.5 | 746.1(+1.60k)#29 | 0.0(+2.34k)#3,589 |
| 30. | Newington | 2,321.3 | 746.1(+1.58k)#30 | 0.0(+2.32k)#3,637 |
| 31. | Derby | 2,292.5 | 746.1(+1.55k)#31 | 0.0(+2.29k)#3,700 |
| 32. | Bristol | 2,280.4 | 746.1(+1.53k)#32 | 0.0(+2.28k)#3,726 |
| 33. | Plantsville | 2,107.7 | 746.1(+1.36k)#33 | 0.0(+2.11k)#4,176 |
| 34. | Wethersfield | 2,078.1 | 746.1(+1.33k)#34 | 0.0(+2.08k)#4,260 |
| 35. | East Haven | 2,067.7 | 746.1(+1.32k)#35 | 0.0(+2.07k)#4,291 |
| 36. | Old Greenwich | 2,033.1 | 746.1(+1.29k)#36 | 0.0(+2.03k)#4,398 |
| 37. | Milford City Balance | 2,018.7 | 746.1(+1.27k)#37 | 0.0(+2.02k)#4,441 |
| 38. | Danbury | 1,955.5 | 746.1(+1.21k)#38 | 0.0(+1.96k)#4,683 |
| 39. | Blue Hills | 1,910.2 | 746.1(+1.16k)#39 | 0.0(+1.91k)#4,824 |
| 40. | Bethel | 1,866.3 | 746.1(+1.12k)#40 | 0.0(+1.87k)#4,994 |
| 41. | Putnam | 1,832.1 | 746.1(+1.09k)#41 | 0.0(+1.83k)#5,119 |
| 42. | Terryville | 1,796.3 | 746.1(+1.05k)#42 | 0.0(+1.80k)#5,252 |
| 43. | Thomaston | 1,747.9 | 746.1(+1.00k)#43 | 0.0(+1.75k)#5,437 |
| 44. | Waterford | 1,735.5 | 746.1(+989)#44 | 0.0(+1.74k)#5,489 |
| 45. | New Milford | 1,706.6 | 746.1(+960)#45 | 0.0(+1.71k)#5,606 |
| 46. | Heritage Village | 1,678.0 | 746.1(+932)#46 | 0.0(+1.68k)#5,745 |
| 47. | Wilton Center | 1,648.8 | 746.1(+903)#47 | 0.0(+1.65k)#5,905 |
| 48. | Pawcatuck | 1,629.6 | 746.1(+883)#48 | 0.0(+1.63k)#6,002 |
| 49. | Cannondale | 1,604.2 | 746.1(+858)#49 | 0.0(+1.60k)#6,123 |
| 50. | Watertown | 1,595.3 | 746.1(+849)#50 | 0.0(+1.60k)#6,166 |
| 51. | Glastonbury Center | 1,579.4 | 746.1(+833)#51 | 0.0(+1.58k)#6,255 |
| 52. | Kensington | 1,558.3 | 746.1(+812)#52 | 0.0(+1.56k)#6,375 |
| 53. | Plainfield Village | 1,555.3 | 746.1(+809)#53 | 0.0(+1.56k)#6,395 |
| 54. | Southport | 1,523.7 | 746.1(+778)#54 | 0.0(+1.52k)#6,553 |
| 55. | Sherwood Manor | 1,523.1 | 746.1(+777)#55 | 0.0(+1.52k)#6,560 |
| 56. | Southwood Acres | 1,494.5 | 746.1(+748)#56 | 0.0(+1.49k)#6,710 |
| 57. | Cheshire Village | 1,469.7 | 746.1(+724)#57 | 0.0(+1.47k)#6,859 |
| 58. | Conning Towers Nautilus Park | 1,430.0 | 746.1(+684)#58 | 0.0(+1.43k)#7,129 |
| 59. | Groton | 1,387.4 | 746.1(+641)#59 | 0.0(+1.39k)#7,394 |
| 60. | Norwich | 1,364.2 | 746.1(+618)#60 | 0.0(+1.36k)#7,559 |
| 61. | Winsted | 1,363.4 | 746.1(+617)#61 | 0.0(+1.36k)#7,563 |
| 62. | Windsor Locks | 1,343.5 | 746.1(+597)#62 | 0.0(+1.34k)#7,698 |
| 63. | Simsbury Center | 1,341.1 | 746.1(+595)#63 | 0.0(+1.34k)#7,715 |
| 64. | Shelton | 1,293.3 | 746.1(+547)#64 | 0.0(+1.29k)#8,079 |
| 65. | Moosup | 1,287.6 | 746.1(+541)#65 | 0.0(+1.29k)#8,121 |
| 66. | Saybrook Manor | 1,274.8 | 746.1(+529)#66 | 0.0(+1.27k)#8,227 |
| 67. | Ridgefield | 1,222.4 | 746.1(+476)#67 | 0.0(+1.22k)#8,631 |
| 68. | Clinton | 1,165.8 | 746.1(+420)#68 | 0.0(+1.17k)#9,070 |
| 69. | Guilford Center | 1,164.4 | 746.1(+418)#69 | 0.0(+1.16k)#9,078 |
| 70. | North Haven | 1,146.7 | 746.1(+401)#70 | 0.0(+1.15k)#9,221 |
| 71. | Middletown | 1,138.2 | 746.1(+392)#71 | 0.0(+1.14k)#9,297 |
| 72. | Westbrook Center | 1,108.6 | 746.1(+362)#72 | 0.0(+1.11k)#9,555 |
| 73. | Colchester | 1,091.3 | 746.1(+345)#73 | 0.0(+1.09k)#9,738 |
| 74. | Mystic | 1,084.8 | 746.1(+339)#74 | 0.0(+1.08k)#9,810 |
| 75. | Hazardville | 1,080.3 | 746.1(+334)#75 | 0.0(+1.08k)#9,843 |
| 76. | Collinsville | 1,057.3 | 746.1(+311)#76 | 0.0(+1.06k)#10,070 |
| 77. | Poquonock Bridge | 984.9 | 746.1(+239)#77 | 0.0(+985)#10,830 |
| 78. | Niantic | 982.4 | 746.1(+236)#78 | 0.0(+982)#10,856 |
| 79. | Portland | 970.7 | 746.1(+225)#79 | 0.0(+971)#10,989 |
| 80. | Somers | 910.9 | 746.1(+165)#80 | 0.0(+911)#11,675 |
| 81. | Weatogue | 888.4 | 746.1(+142)#81 | 0.0(+888)#11,932 |
| 82. | Torrington | 882.1 | 746.1(+136)#82 | 0.0(+882)#11,993 |
| 83. | Suffield Depot | 877.9 | 746.1(+132)#83 | 0.0(+878)#12,039 |
| 84. | Baltic | 872.6 | 746.1(+126)#84 | 0.0(+873)#12,101 |
| 85. | Wauregan | 848.9 | 746.1(+103)#85 | 0.0(+849)#12,375 |
| 86. | Gales Ferry | 846.5 | 746.1(+100)#86 | 0.0(+846)#12,405 |
| 87. | Canton Valley | 843.3 | 746.1(+97.1)#87 | 0.0(+843)#12,444 |
| 88. | Orange | 818.2 | 746.1(+72.1)#88 | 0.0(+818)#12,744 |
| 89. | East Brooklyn | 800.2 | 746.1(+54.0)#89 | 0.0(+800)#12,967 |
| 90. | Canaan | 786.3 | 746.1(+40.2)#90 | 0.0(+786)#13,142 |
| 91. | Old Mystic | 774.2 | 746.1(+28.0)#91 | 0.0(+774)#13,285 |
| 92. | Brooklyn | 770.8 | 746.1(+24.7)#92 | 0.0(+771)#13,326 |
| 93. | Noank | 769.3 | 746.1(+23.2)#93 | 0.0(+769)#13,342 |
| 94. | Stafford Springs | 764.2 | 746.1(+18.1)#94 | 0.0(+764)#13,398 |
| 95. | Lake Pocotopaug | 757.9 | 746.1(+11.8)#95 | 0.0(+758)#13,481 |
| 96. | Madison Center | 754.0 | 746.1(+7.83)#96 | 0.0(+754)#13,537 |
| 97. | East Hampton | 727.3 | 746.1(-18.9)#97 | 0.0(+727)#13,833 |
| 98. | Woodbury Center | 715.6 | 746.1(-30.5)#98 | 0.0(+716)#13,999 |
| 99. | Old Saybrook Center | 701.8 | 746.1(-44.3)#99 | 0.0(+702)#14,163 |
| 100. | Deep River Center | 685.7 | 746.1(-60.4)#100 | 0.0(+686)#14,381 |
Common Questions
What are the Top 10 Cities with the Highest Population Density in Connecticut?
Top 10 Cities with the Highest Population Density in Connecticut are:
#1
7,652.9
#2
6,750.6
#3
6,714.9
#4
6,176.1
#5
5,518.1
#6
5,078.0
#7
4,664.5
#8
4,169.8
#9
3,996.4
#10
3,961.4
What city has the Highest Population Density in Connecticut?
Bridgeport has the Highest Population Density in Connecticut with 7,652.9.
What is the Population Density in the State of Connecticut?
Population Density in Connecticut is 746.1.