Cities with the Most Immigrants from Trinidad and Tobago in New York
RELATED REPORTS & OPTIONS
Trinidad and Tobago
New York
Compare Cities
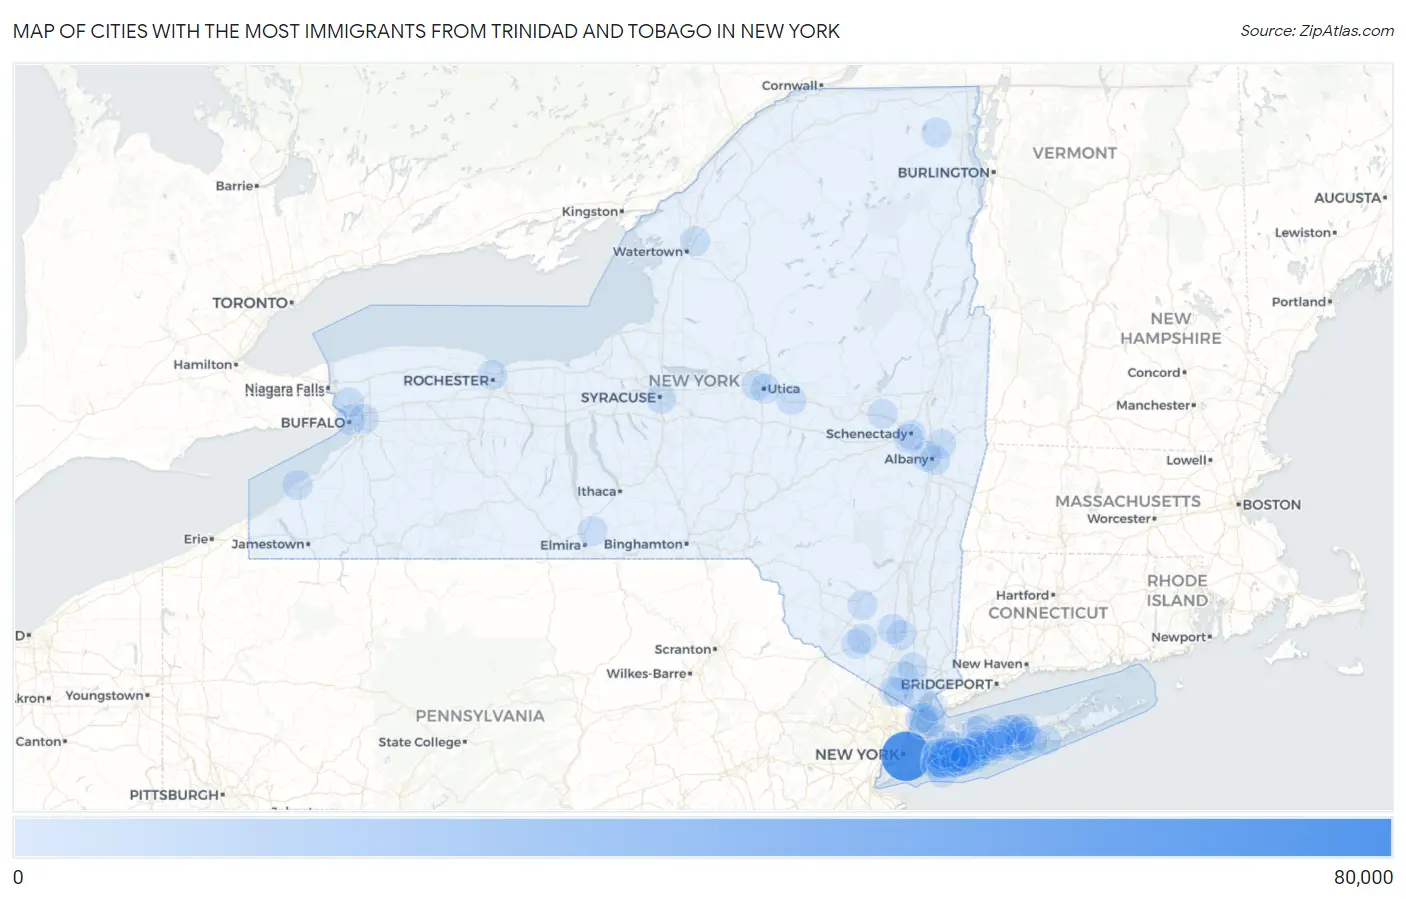
Map of Cities with the Most Immigrants from Trinidad and Tobago in New York
0
80,000
Cities with the Most Immigrants from Trinidad and Tobago in New York
| City | Trinidad and Tobago | vs State | vs National | |
| 1. | New York | 76,393 | 91,428(83.56%)#1 | 231,222(33.04%)#1 |
| 2. | Elmont | 670 | 91,428(0.73%)#2 | 231,222(0.29%)#25 |
| 3. | Mount Vernon | 633 | 91,428(0.69%)#3 | 231,222(0.27%)#27 |
| 4. | Valley Stream | 549 | 91,428(0.60%)#4 | 231,222(0.24%)#31 |
| 5. | North Valley Stream | 523 | 91,428(0.57%)#5 | 231,222(0.23%)#32 |
| 6. | Yonkers | 519 | 91,428(0.57%)#6 | 231,222(0.22%)#33 |
| 7. | Hempstead | 496 | 91,428(0.54%)#7 | 231,222(0.21%)#35 |
| 8. | Buffalo | 431 | 91,428(0.47%)#8 | 231,222(0.19%)#41 |
| 9. | Baldwin | 415 | 91,428(0.45%)#9 | 231,222(0.18%)#45 |
| 10. | North Amityville | 367 | 91,428(0.40%)#10 | 231,222(0.16%)#50 |
| 11. | Brentwood | 348 | 91,428(0.38%)#11 | 231,222(0.15%)#54 |
| 12. | Freeport | 346 | 91,428(0.38%)#12 | 231,222(0.15%)#56 |
| 13. | Roosevelt | 338 | 91,428(0.37%)#13 | 231,222(0.15%)#59 |
| 14. | Schenectady | 281 | 91,428(0.31%)#14 | 231,222(0.12%)#74 |
| 15. | Central Islip | 249 | 91,428(0.27%)#15 | 231,222(0.11%)#89 |
| 16. | Lakeview | 228 | 91,428(0.25%)#16 | 231,222(0.10%)#97 |
| 17. | Rochester | 202 | 91,428(0.22%)#17 | 231,222(0.09%)#111 |
| 18. | Albany | 195 | 91,428(0.21%)#18 | 231,222(0.08%)#120 |
| 19. | East Massapequa | 189 | 91,428(0.21%)#19 | 231,222(0.08%)#126 |
| 20. | South Valley Stream | 186 | 91,428(0.20%)#20 | 231,222(0.08%)#127 |
| 21. | Bay Shore | 159 | 91,428(0.17%)#21 | 231,222(0.07%)#153 |
| 22. | Uniondale | 154 | 91,428(0.17%)#22 | 231,222(0.07%)#155 |
| 23. | Stony Point | 151 | 91,428(0.17%)#23 | 231,222(0.07%)#160 |
| 24. | Scotchtown | 151 | 91,428(0.17%)#24 | 231,222(0.07%)#161 |
| 25. | West Babylon | 142 | 91,428(0.16%)#25 | 231,222(0.06%)#176 |
| 26. | Coram | 141 | 91,428(0.15%)#26 | 231,222(0.06%)#180 |
| 27. | Newburgh | 141 | 91,428(0.15%)#27 | 231,222(0.06%)#181 |
| 28. | Lindenhurst | 136 | 91,428(0.15%)#28 | 231,222(0.06%)#189 |
| 29. | Deer Park | 135 | 91,428(0.15%)#29 | 231,222(0.06%)#191 |
| 30. | East Meadow | 129 | 91,428(0.14%)#30 | 231,222(0.06%)#197 |
| 31. | Franklin Square | 126 | 91,428(0.14%)#31 | 231,222(0.05%)#205 |
| 32. | Syracuse | 124 | 91,428(0.14%)#32 | 231,222(0.05%)#213 |
| 33. | Woodmere | 115 | 91,428(0.13%)#33 | 231,222(0.05%)#233 |
| 34. | Patchogue | 113 | 91,428(0.12%)#34 | 231,222(0.05%)#241 |
| 35. | Holtsville | 109 | 91,428(0.12%)#35 | 231,222(0.05%)#253 |
| 36. | Lynbrook | 98 | 91,428(0.11%)#36 | 231,222(0.04%)#281 |
| 37. | Ronkonkoma | 97 | 91,428(0.11%)#37 | 231,222(0.04%)#284 |
| 38. | Spring Valley | 94 | 91,428(0.10%)#38 | 231,222(0.04%)#293 |
| 39. | West Hempstead | 94 | 91,428(0.10%)#39 | 231,222(0.04%)#294 |
| 40. | East Northport | 94 | 91,428(0.10%)#40 | 231,222(0.04%)#295 |
| 41. | Centereach | 93 | 91,428(0.10%)#41 | 231,222(0.04%)#297 |
| 42. | Medford | 86 | 91,428(0.09%)#42 | 231,222(0.04%)#323 |
| 43. | Herkimer | 86 | 91,428(0.09%)#43 | 231,222(0.04%)#325 |
| 44. | South Floral Park | 81 | 91,428(0.09%)#44 | 231,222(0.04%)#348 |
| 45. | Peekskill | 80 | 91,428(0.09%)#45 | 231,222(0.03%)#350 |
| 46. | Troy | 78 | 91,428(0.09%)#46 | 231,222(0.03%)#362 |
| 47. | Levittown | 78 | 91,428(0.09%)#47 | 231,222(0.03%)#363 |
| 48. | North Bellmore | 77 | 91,428(0.08%)#48 | 231,222(0.03%)#368 |
| 49. | Tonawanda | 76 | 91,428(0.08%)#49 | 231,222(0.03%)#372 |
| 50. | Wyandanch | 75 | 91,428(0.08%)#50 | 231,222(0.03%)#380 |
| 51. | North Babylon | 72 | 91,428(0.08%)#51 | 231,222(0.03%)#398 |
| 52. | East Rockaway | 70 | 91,428(0.08%)#52 | 231,222(0.03%)#413 |
| 53. | East Moriches | 66 | 91,428(0.07%)#53 | 231,222(0.03%)#438 |
| 54. | Dix Hills | 63 | 91,428(0.07%)#54 | 231,222(0.03%)#446 |
| 55. | East Patchogue | 61 | 91,428(0.07%)#55 | 231,222(0.03%)#456 |
| 56. | Bellmore | 61 | 91,428(0.07%)#56 | 231,222(0.03%)#458 |
| 57. | Middle Island | 58 | 91,428(0.06%)#57 | 231,222(0.03%)#479 |
| 58. | North Lindenhurst | 57 | 91,428(0.06%)#58 | 231,222(0.02%)#489 |
| 59. | Greenville Cdp Westchester County | 55 | 91,428(0.06%)#59 | 231,222(0.02%)#502 |
| 60. | Whitesboro | 55 | 91,428(0.06%)#60 | 231,222(0.02%)#504 |
| 61. | Orange Lake | 54 | 91,428(0.06%)#61 | 231,222(0.02%)#507 |
| 62. | New Rochelle | 51 | 91,428(0.06%)#62 | 231,222(0.02%)#521 |
| 63. | Hicksville | 50 | 91,428(0.05%)#63 | 231,222(0.02%)#529 |
| 64. | Utica | 49 | 91,428(0.05%)#64 | 231,222(0.02%)#533 |
| 65. | Greenlawn | 48 | 91,428(0.05%)#65 | 231,222(0.02%)#546 |
| 66. | Sleepy Hollow | 48 | 91,428(0.05%)#66 | 231,222(0.02%)#547 |
| 67. | North Wantagh | 44 | 91,428(0.05%)#67 | 231,222(0.02%)#579 |
| 68. | Cheektowaga | 43 | 91,428(0.05%)#68 | 231,222(0.02%)#582 |
| 69. | Ellenville | 42 | 91,428(0.05%)#69 | 231,222(0.02%)#596 |
| 70. | Amsterdam | 40 | 91,428(0.04%)#70 | 231,222(0.02%)#612 |
| 71. | Yaphank | 40 | 91,428(0.04%)#71 | 231,222(0.02%)#614 |
| 72. | Gordon Heights | 40 | 91,428(0.04%)#72 | 231,222(0.02%)#615 |
| 73. | Selden | 39 | 91,428(0.04%)#73 | 231,222(0.02%)#620 |
| 74. | Tuckahoe | 39 | 91,428(0.04%)#74 | 231,222(0.02%)#625 |
| 75. | Dannemora | 39 | 91,428(0.04%)#75 | 231,222(0.02%)#626 |
| 76. | Long Beach | 38 | 91,428(0.04%)#76 | 231,222(0.02%)#636 |
| 77. | Merrick | 38 | 91,428(0.04%)#77 | 231,222(0.02%)#637 |
| 78. | Seaford | 38 | 91,428(0.04%)#78 | 231,222(0.02%)#638 |
| 79. | Wheatley Heights | 38 | 91,428(0.04%)#79 | 231,222(0.02%)#643 |
| 80. | Rotterdam | 37 | 91,428(0.04%)#80 | 231,222(0.02%)#657 |
| 81. | North Bay Shore | 36 | 91,428(0.04%)#81 | 231,222(0.02%)#675 |
| 82. | Dunkirk | 35 | 91,428(0.04%)#82 | 231,222(0.02%)#685 |
| 83. | Viola | 35 | 91,428(0.04%)#83 | 231,222(0.02%)#688 |
| 84. | Islandia | 35 | 91,428(0.04%)#84 | 231,222(0.02%)#690 |
| 85. | Tuxedo | 35 | 91,428(0.04%)#85 | 231,222(0.02%)#691 |
| 86. | North Great River | 33 | 91,428(0.04%)#86 | 231,222(0.01%)#724 |
| 87. | Westbury | 31 | 91,428(0.03%)#87 | 231,222(0.01%)#746 |
| 88. | South Farmingdale | 30 | 91,428(0.03%)#88 | 231,222(0.01%)#766 |
| 89. | Nesconset | 30 | 91,428(0.03%)#89 | 231,222(0.01%)#768 |
| 90. | Shirley | 29 | 91,428(0.03%)#90 | 231,222(0.01%)#782 |
| 91. | Plainedge | 29 | 91,428(0.03%)#91 | 231,222(0.01%)#788 |
| 92. | White Plains | 28 | 91,428(0.03%)#92 | 231,222(0.01%)#794 |
| 93. | Breesport | 28 | 91,428(0.03%)#93 | 231,222(0.01%)#806 |
| 94. | Massapequa | 27 | 91,428(0.03%)#94 | 231,222(0.01%)#818 |
| 95. | Rensselaer | 27 | 91,428(0.03%)#95 | 231,222(0.01%)#825 |
| 96. | Middletown | 26 | 91,428(0.03%)#96 | 231,222(0.01%)#835 |
| 97. | Flower Hill | 26 | 91,428(0.03%)#97 | 231,222(0.01%)#846 |
| 98. | Calcium | 26 | 91,428(0.03%)#98 | 231,222(0.01%)#847 |
| 99. | Garden City | 25 | 91,428(0.03%)#99 | 231,222(0.01%)#856 |
| 100. | North Merrick | 25 | 91,428(0.03%)#100 | 231,222(0.01%)#862 |
Common Questions
What are the Top 10 Cities with the Most Immigrants from Trinidad and Tobago in New York?
Top 10 Cities with the Most Immigrants from Trinidad and Tobago in New York are:
#1
76,393
#2
670
#3
633
#4
549
#5
523
#6
519
#7
496
#8
431
#9
415
#10
367
What city has the Most Immigrants from Trinidad and Tobago in New York?
New York has the Most Immigrants from Trinidad and Tobago in New York with 76,393.
What is the Total Immigrants from Trinidad and Tobago in the State of New York?
Total Immigrants from Trinidad and Tobago in New York is 91,428.
What is the Total Immigrants from Trinidad and Tobago in the United States?
Total Immigrants from Trinidad and Tobago in the United States is 231,222.