Cities with the Most Immigrants from Trinidad and Tobago in Pennsylvania
RELATED REPORTS & OPTIONS
Trinidad and Tobago
Pennsylvania
Compare Cities
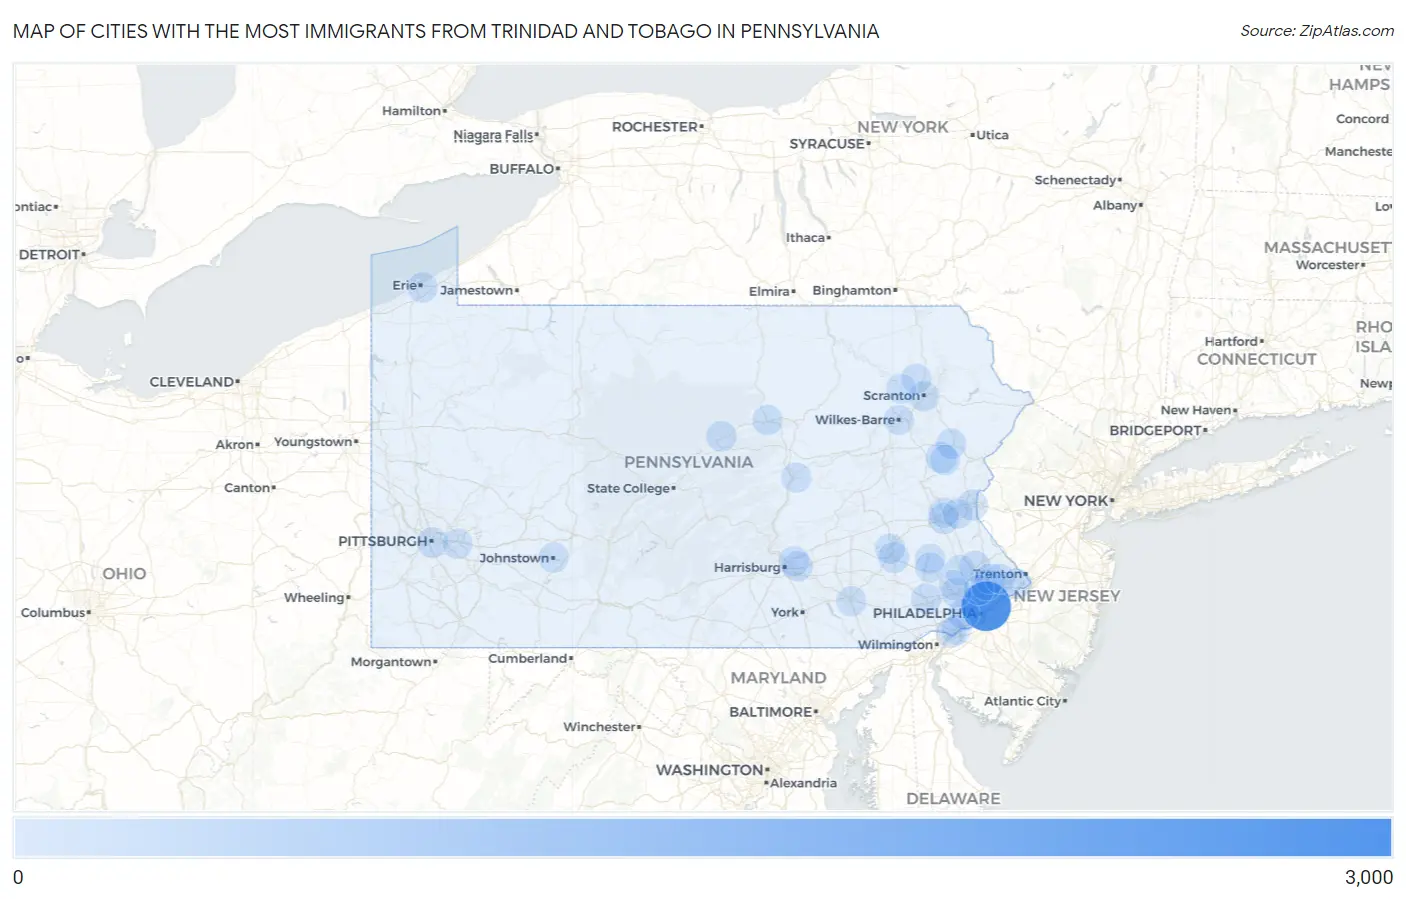
Map of Cities with the Most Immigrants from Trinidad and Tobago in Pennsylvania
0
3,000
Cities with the Most Immigrants from Trinidad and Tobago in Pennsylvania
| City | Trinidad and Tobago | vs State | vs National | |
| 1. | Philadelphia | 2,795 | 7,224(38.69%)#1 | 231,222(1.21%)#3 |
| 2. | Yeadon Borough | 209 | 7,224(2.89%)#2 | 231,222(0.09%)#108 |
| 3. | Pottstown Borough | 123 | 7,224(1.70%)#3 | 231,222(0.05%)#214 |
| 4. | Drexel Hill | 119 | 7,224(1.65%)#4 | 231,222(0.05%)#224 |
| 5. | Brittany Farms The Highlands | 115 | 7,224(1.59%)#5 | 231,222(0.05%)#234 |
| 6. | Easton | 108 | 7,224(1.50%)#6 | 231,222(0.05%)#257 |
| 7. | Indian Mountain Lake | 91 | 7,224(1.26%)#7 | 231,222(0.04%)#303 |
| 8. | Roslyn | 90 | 7,224(1.25%)#8 | 231,222(0.04%)#306 |
| 9. | Allentown | 85 | 7,224(1.18%)#9 | 231,222(0.04%)#327 |
| 10. | Reading | 85 | 7,224(1.18%)#10 | 231,222(0.04%)#328 |
| 11. | Pittsburgh | 83 | 7,224(1.15%)#11 | 231,222(0.04%)#335 |
| 12. | Norristown Borough | 82 | 7,224(1.14%)#12 | 231,222(0.04%)#342 |
| 13. | Wilson Borough | 82 | 7,224(1.14%)#13 | 231,222(0.04%)#346 |
| 14. | Willow Grove | 74 | 7,224(1.02%)#14 | 231,222(0.03%)#385 |
| 15. | Levittown | 73 | 7,224(1.01%)#15 | 231,222(0.03%)#388 |
| 16. | Lionville | 51 | 7,224(0.71%)#16 | 231,222(0.02%)#526 |
| 17. | Rutherford | 49 | 7,224(0.68%)#17 | 231,222(0.02%)#542 |
| 18. | Hollidaysburg Borough | 47 | 7,224(0.65%)#18 | 231,222(0.02%)#554 |
| 19. | New Holland Borough | 46 | 7,224(0.64%)#19 | 231,222(0.02%)#563 |
| 20. | Lock Haven | 41 | 7,224(0.57%)#20 | 231,222(0.02%)#608 |
| 21. | Warminster Heights | 38 | 7,224(0.53%)#21 | 231,222(0.02%)#644 |
| 22. | Chestnut Hill | 37 | 7,224(0.51%)#22 | 231,222(0.02%)#660 |
| 23. | Aldan Borough | 35 | 7,224(0.48%)#23 | 231,222(0.02%)#689 |
| 24. | Dunmore Borough | 34 | 7,224(0.47%)#24 | 231,222(0.01%)#708 |
| 25. | Linwood | 31 | 7,224(0.43%)#25 | 231,222(0.01%)#754 |
| 26. | Emerald Lakes | 30 | 7,224(0.42%)#26 | 231,222(0.01%)#773 |
| 27. | Erie | 24 | 7,224(0.33%)#27 | 231,222(0.01%)#876 |
| 28. | Williamsport | 24 | 7,224(0.33%)#28 | 231,222(0.01%)#882 |
| 29. | Scranton | 22 | 7,224(0.30%)#29 | 231,222(0.01%)#921 |
| 30. | Kulpsville | 22 | 7,224(0.30%)#30 | 231,222(0.01%)#938 |
| 31. | Riverview Park | 22 | 7,224(0.30%)#31 | 231,222(0.01%)#941 |
| 32. | Fullerton | 20 | 7,224(0.28%)#32 | 231,222(0.01%)#979 |
| 33. | Sun Valley | 20 | 7,224(0.28%)#33 | 231,222(0.01%)#988 |
| 34. | Chester | 18 | 7,224(0.25%)#34 | 231,222(0.01%)#1,029 |
| 35. | Colonial Park | 18 | 7,224(0.25%)#35 | 231,222(0.01%)#1,035 |
| 36. | Fleetwood Borough | 17 | 7,224(0.24%)#36 | 231,222(0.01%)#1,091 |
| 37. | Bethlehem | 16 | 7,224(0.22%)#37 | 231,222(0.01%)#1,103 |
| 38. | New Salem Borough | 16 | 7,224(0.22%)#38 | 231,222(0.01%)#1,122 |
| 39. | King Of Prussia | 15 | 7,224(0.21%)#39 | 231,222(0.01%)#1,144 |
| 40. | Akron Borough | 15 | 7,224(0.21%)#40 | 231,222(0.01%)#1,155 |
| 41. | Oreland | 14 | 7,224(0.19%)#41 | 231,222(0.01%)#1,189 |
| 42. | Trooper | 14 | 7,224(0.19%)#42 | 231,222(0.01%)#1,193 |
| 43. | Freemansburg Borough | 13 | 7,224(0.18%)#43 | 231,222(0.01%)#1,228 |
| 44. | Johnstown | 12 | 7,224(0.17%)#44 | 231,222(0.01%)#1,248 |
| 45. | West Reading Borough | 12 | 7,224(0.17%)#45 | 231,222(0.01%)#1,274 |
| 46. | Monroeville | 11 | 7,224(0.15%)#46 | 231,222(0.00%)#1,295 |
| 47. | Churchville | 10 | 7,224(0.14%)#47 | 231,222(0.00%)#1,360 |
| 48. | Jessup Borough | 10 | 7,224(0.14%)#48 | 231,222(0.00%)#1,364 |
| 49. | Lancaster | 9 | 7,224(0.12%)#49 | 231,222(0.00%)#1,383 |
| 50. | Coopersburg Borough | 8 | 7,224(0.11%)#50 | 231,222(0.00%)#1,462 |
| 51. | Laureldale Borough | 7 | 7,224(0.10%)#51 | 231,222(0.00%)#1,506 |
| 52. | Chambersburg Borough | 6 | 7,224(0.08%)#52 | 231,222(0.00%)#1,532 |
| 53. | Glenburn | 6 | 7,224(0.08%)#53 | 231,222(0.00%)#1,562 |
| 54. | Wilkes Barre | 5 | 7,224(0.07%)#54 | 231,222(0.00%)#1,574 |
| 55. | Darby Borough | 5 | 7,224(0.07%)#55 | 231,222(0.00%)#1,588 |
| 56. | Glenolden Borough | 5 | 7,224(0.07%)#56 | 231,222(0.00%)#1,591 |
| 57. | Gilbertsville | 5 | 7,224(0.07%)#57 | 231,222(0.00%)#1,593 |
| 58. | Pottsgrove | 5 | 7,224(0.07%)#58 | 231,222(0.00%)#1,597 |
| 59. | East Prospect Borough | 5 | 7,224(0.07%)#59 | 231,222(0.00%)#1,610 |
| 60. | Berwick Borough | 4 | 7,224(0.06%)#60 | 231,222(0.00%)#1,628 |
| 61. | Ambler Borough | 4 | 7,224(0.06%)#61 | 231,222(0.00%)#1,631 |
| 62. | Swarthmore Borough | 4 | 7,224(0.06%)#62 | 231,222(0.00%)#1,633 |
| 63. | Roseto Borough | 4 | 7,224(0.06%)#63 | 231,222(0.00%)#1,639 |
| 64. | Bowmanstown Borough | 4 | 7,224(0.06%)#64 | 231,222(0.00%)#1,645 |
| 65. | Sunbury | 3 | 7,224(0.04%)#65 | 231,222(0.00%)#1,661 |
| 66. | Upland Borough | 3 | 7,224(0.04%)#66 | 231,222(0.00%)#1,666 |
| 67. | Bath Borough | 3 | 7,224(0.04%)#67 | 231,222(0.00%)#1,668 |
| 68. | Emmaus Borough | 2 | 7,224(0.03%)#68 | 231,222(0.00%)#1,684 |
| 69. | Loretto Borough | 2 | 7,224(0.03%)#69 | 231,222(0.00%)#1,689 |
| 70. | Media Borough | 1 | 7,224(0.01%)#70 | 231,222(0.00%)#1,713 |
| 71. | Narberth Borough | 1 | 7,224(0.01%)#71 | 231,222(0.00%)#1,715 |
| 72. | Sandy Lake Borough | 1 | 7,224(0.01%)#72 | 231,222(0.00%)#1,721 |
| 73. | West Falls | 1 | 7,224(0.01%)#73 | 231,222(0.00%)#1,727 |
Common Questions
What are the Top 10 Cities with the Most Immigrants from Trinidad and Tobago in Pennsylvania?
Top 10 Cities with the Most Immigrants from Trinidad and Tobago in Pennsylvania are:
#1
2,795
#2
119
#3
115
#4
108
#5
91
#6
85
#7
85
#8
83
#9
74
#10
73
What city has the Most Immigrants from Trinidad and Tobago in Pennsylvania?
Philadelphia has the Most Immigrants from Trinidad and Tobago in Pennsylvania with 2,795.
What is the Total Immigrants from Trinidad and Tobago in the State of Pennsylvania?
Total Immigrants from Trinidad and Tobago in Pennsylvania is 7,224.
What is the Total Immigrants from Trinidad and Tobago in the United States?
Total Immigrants from Trinidad and Tobago in the United States is 231,222.