Cities with the Most Immigrants from Taiwan in Maryland
RELATED REPORTS & OPTIONS
Taiwan
Maryland
Compare Cities
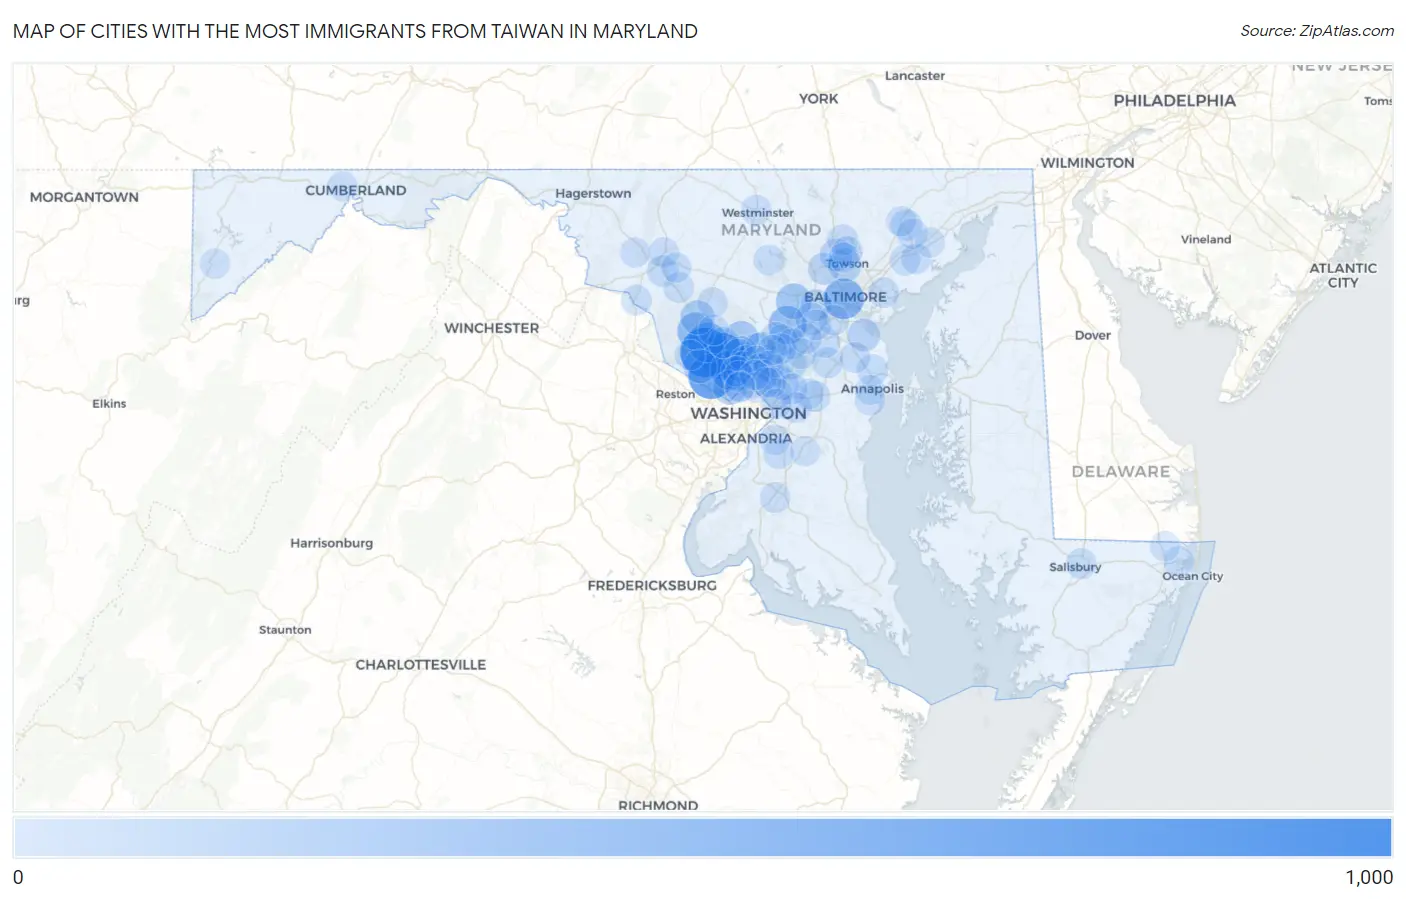
Map of Cities with the Most Immigrants from Taiwan in Maryland
0
1,000
Cities with the Most Immigrants from Taiwan in Maryland
| City | Taiwan | vs State | vs National | |
| 1. | North Potomac | 861 | 8,520(10.11%)#1 | 376,336(0.23%)#65 |
| 2. | Rockville | 714 | 8,520(8.38%)#2 | 376,336(0.19%)#76 |
| 3. | Potomac | 678 | 8,520(7.96%)#3 | 376,336(0.18%)#80 |
| 4. | Baltimore | 454 | 8,520(5.33%)#4 | 376,336(0.12%)#123 |
| 5. | Gaithersburg | 431 | 8,520(5.06%)#5 | 376,336(0.11%)#134 |
| 6. | North Bethesda | 408 | 8,520(4.79%)#6 | 376,336(0.11%)#141 |
| 7. | Columbia | 341 | 8,520(4.00%)#7 | 376,336(0.09%)#159 |
| 8. | Germantown | 335 | 8,520(3.93%)#8 | 376,336(0.09%)#161 |
| 9. | Ellicott City | 239 | 8,520(2.81%)#9 | 376,336(0.06%)#227 |
| 10. | Olney | 226 | 8,520(2.65%)#10 | 376,336(0.06%)#240 |
| 11. | Bethesda | 182 | 8,520(2.14%)#11 | 376,336(0.05%)#294 |
| 12. | Clarksburg | 176 | 8,520(2.07%)#12 | 376,336(0.05%)#309 |
| 13. | Travilah | 164 | 8,520(1.92%)#13 | 376,336(0.04%)#329 |
| 14. | Cloverly | 154 | 8,520(1.81%)#14 | 376,336(0.04%)#342 |
| 15. | Towson | 131 | 8,520(1.54%)#15 | 376,336(0.03%)#399 |
| 16. | Riviera Beach | 114 | 8,520(1.34%)#16 | 376,336(0.03%)#449 |
| 17. | Leisure World | 114 | 8,520(1.34%)#17 | 376,336(0.03%)#450 |
| 18. | Mays Chapel | 109 | 8,520(1.28%)#18 | 376,336(0.03%)#465 |
| 19. | Aspen Hill | 96 | 8,520(1.13%)#19 | 376,336(0.03%)#510 |
| 20. | Greenbelt | 90 | 8,520(1.06%)#20 | 376,336(0.02%)#531 |
| 21. | Wheaton | 89 | 8,520(1.04%)#21 | 376,336(0.02%)#538 |
| 22. | Pikesville | 84 | 8,520(0.99%)#22 | 376,336(0.02%)#567 |
| 23. | Ilchester | 84 | 8,520(0.99%)#23 | 376,336(0.02%)#569 |
| 24. | Glenmont | 75 | 8,520(0.88%)#24 | 376,336(0.02%)#638 |
| 25. | Catonsville | 70 | 8,520(0.82%)#25 | 376,336(0.02%)#676 |
| 26. | Silver Spring | 64 | 8,520(0.75%)#26 | 376,336(0.02%)#730 |
| 27. | Redland | 59 | 8,520(0.69%)#27 | 376,336(0.02%)#781 |
| 28. | South Laurel | 55 | 8,520(0.65%)#28 | 376,336(0.01%)#818 |
| 29. | Ballenger Creek | 52 | 8,520(0.61%)#29 | 376,336(0.01%)#859 |
| 30. | Bel Air | 48 | 8,520(0.56%)#30 | 376,336(0.01%)#903 |
| 31. | Arnold | 47 | 8,520(0.55%)#31 | 376,336(0.01%)#912 |
| 32. | Honeygo | 47 | 8,520(0.55%)#32 | 376,336(0.01%)#916 |
| 33. | Spencerville | 44 | 8,520(0.52%)#33 | 376,336(0.01%)#959 |
| 34. | Fairland | 41 | 8,520(0.48%)#34 | 376,336(0.01%)#993 |
| 35. | Odenton | 37 | 8,520(0.43%)#35 | 376,336(0.01%)#1,058 |
| 36. | Flower Hill | 37 | 8,520(0.43%)#36 | 376,336(0.01%)#1,066 |
| 37. | Scaggsville | 37 | 8,520(0.43%)#37 | 376,336(0.01%)#1,069 |
| 38. | Cockeysville | 35 | 8,520(0.41%)#38 | 376,336(0.01%)#1,105 |
| 39. | Colesville | 34 | 8,520(0.40%)#39 | 376,336(0.01%)#1,126 |
| 40. | Point Of Rocks | 34 | 8,520(0.40%)#40 | 376,336(0.01%)#1,136 |
| 41. | Urbana | 33 | 8,520(0.39%)#41 | 376,336(0.01%)#1,151 |
| 42. | Fulton | 31 | 8,520(0.36%)#42 | 376,336(0.01%)#1,206 |
| 43. | Severn | 30 | 8,520(0.35%)#43 | 376,336(0.01%)#1,218 |
| 44. | White Oak | 30 | 8,520(0.35%)#44 | 376,336(0.01%)#1,224 |
| 45. | Joppatowne | 30 | 8,520(0.35%)#45 | 376,336(0.01%)#1,226 |
| 46. | Montgomery Village | 29 | 8,520(0.34%)#46 | 376,336(0.01%)#1,240 |
| 47. | North Laurel | 29 | 8,520(0.34%)#47 | 376,336(0.01%)#1,244 |
| 48. | Severna Park | 28 | 8,520(0.33%)#48 | 376,336(0.01%)#1,263 |
| 49. | Salisbury | 27 | 8,520(0.32%)#49 | 376,336(0.01%)#1,298 |
| 50. | Essex | 25 | 8,520(0.29%)#50 | 376,336(0.01%)#1,347 |
| 51. | Beltsville | 25 | 8,520(0.29%)#51 | 376,336(0.01%)#1,358 |
| 52. | Bowie | 23 | 8,520(0.27%)#52 | 376,336(0.01%)#1,398 |
| 53. | Maryland City | 23 | 8,520(0.27%)#53 | 376,336(0.01%)#1,412 |
| 54. | South Kensington | 23 | 8,520(0.27%)#54 | 376,336(0.01%)#1,418 |
| 55. | Eldersburg | 22 | 8,520(0.26%)#55 | 376,336(0.01%)#1,441 |
| 56. | Green Valley | 22 | 8,520(0.26%)#56 | 376,336(0.01%)#1,446 |
| 57. | Fairwood | 22 | 8,520(0.26%)#57 | 376,336(0.01%)#1,449 |
| 58. | Waldorf | 21 | 8,520(0.25%)#58 | 376,336(0.01%)#1,462 |
| 59. | Frederick | 19 | 8,520(0.22%)#59 | 376,336(0.01%)#1,549 |
| 60. | Bel Air South | 19 | 8,520(0.22%)#60 | 376,336(0.01%)#1,553 |
| 61. | Seabrook | 19 | 8,520(0.22%)#61 | 376,336(0.01%)#1,570 |
| 62. | Annapolis Neck | 19 | 8,520(0.22%)#62 | 376,336(0.01%)#1,576 |
| 63. | Clinton | 18 | 8,520(0.21%)#63 | 376,336(0.00%)#1,601 |
| 64. | West Laurel | 18 | 8,520(0.21%)#64 | 376,336(0.00%)#1,629 |
| 65. | Calverton | 17 | 8,520(0.20%)#65 | 376,336(0.00%)#1,653 |
| 66. | Lake Arbor | 17 | 8,520(0.20%)#66 | 376,336(0.00%)#1,659 |
| 67. | Ocean Pines | 17 | 8,520(0.20%)#67 | 376,336(0.00%)#1,663 |
| 68. | Hillandale | 17 | 8,520(0.20%)#68 | 376,336(0.00%)#1,671 |
| 69. | Westminster | 16 | 8,520(0.19%)#69 | 376,336(0.00%)#1,702 |
| 70. | Timonium | 16 | 8,520(0.19%)#70 | 376,336(0.00%)#1,714 |
| 71. | Linthicum | 16 | 8,520(0.19%)#71 | 376,336(0.00%)#1,715 |
| 72. | Jessup | 16 | 8,520(0.19%)#72 | 376,336(0.00%)#1,718 |
| 73. | Elkridge | 15 | 8,520(0.18%)#73 | 376,336(0.00%)#1,757 |
| 74. | East Riverdale | 15 | 8,520(0.18%)#74 | 376,336(0.00%)#1,762 |
| 75. | Darnestown | 15 | 8,520(0.18%)#75 | 376,336(0.00%)#1,783 |
| 76. | Takoma Park | 14 | 8,520(0.16%)#76 | 376,336(0.00%)#1,828 |
| 77. | Garrett Park | 14 | 8,520(0.16%)#77 | 376,336(0.00%)#1,854 |
| 78. | College Park | 13 | 8,520(0.15%)#78 | 376,336(0.00%)#1,869 |
| 79. | Edgewood | 12 | 8,520(0.14%)#79 | 376,336(0.00%)#1,928 |
| 80. | Chevy Chase Section Three | 12 | 8,520(0.14%)#80 | 376,336(0.00%)#1,971 |
| 81. | Woodlawn Cdp Baltimore County | 11 | 8,520(0.13%)#81 | 376,336(0.00%)#1,986 |
| 82. | Camp Springs | 11 | 8,520(0.13%)#82 | 376,336(0.00%)#1,996 |
| 83. | Adelphi | 11 | 8,520(0.13%)#83 | 376,336(0.00%)#2,001 |
| 84. | Damascus | 10 | 8,520(0.12%)#84 | 376,336(0.00%)#2,071 |
| 85. | Middletown | 10 | 8,520(0.12%)#85 | 376,336(0.00%)#2,095 |
| 86. | Bel Air North | 8 | 8,520(0.09%)#86 | 376,336(0.00%)#2,197 |
| 87. | Four Corners | 8 | 8,520(0.09%)#87 | 376,336(0.00%)#2,224 |
| 88. | Bartonsville | 8 | 8,520(0.09%)#88 | 376,336(0.00%)#2,242 |
| 89. | Lutherville | 6 | 8,520(0.07%)#89 | 376,336(0.00%)#2,357 |
| 90. | Annapolis | 5 | 8,520(0.06%)#90 | 376,336(0.00%)#2,403 |
| 91. | La Vale | 5 | 8,520(0.06%)#91 | 376,336(0.00%)#2,426 |
| 92. | Cheverly | 4 | 8,520(0.05%)#92 | 376,336(0.00%)#2,466 |
| 93. | Chevy Chase Section Five | 3 | 8,520(0.04%)#93 | 376,336(0.00%)#2,537 |
| 94. | Marlton | 2 | 8,520(0.02%)#94 | 376,336(0.00%)#2,559 |
| 95. | Riverside | 2 | 8,520(0.02%)#95 | 376,336(0.00%)#2,567 |
| 96. | Burtonsville | 1 | 8,520(0.01%)#96 | 376,336(0.00%)#2,623 |
| 97. | Mountain Lake Park | 1 | 8,520(0.01%)#97 | 376,336(0.00%)#2,638 |
| 98. | Bishopville | 1 | 8,520(0.01%)#98 | 376,336(0.00%)#2,652 |
Common Questions
What are the Top 10 Cities with the Most Immigrants from Taiwan in Maryland?
Top 10 Cities with the Most Immigrants from Taiwan in Maryland are:
#1
861
#2
714
#3
678
#4
454
#5
431
#6
408
#7
341
#8
335
#9
239
#10
226
What city has the Most Immigrants from Taiwan in Maryland?
North Potomac has the Most Immigrants from Taiwan in Maryland with 861.
What is the Total Immigrants from Taiwan in the State of Maryland?
Total Immigrants from Taiwan in Maryland is 8,520.
What is the Total Immigrants from Taiwan in the United States?
Total Immigrants from Taiwan in the United States is 376,336.