Cities with the Most Immigrants from Taiwan in Pennsylvania
RELATED REPORTS & OPTIONS
Taiwan
Pennsylvania
Compare Cities
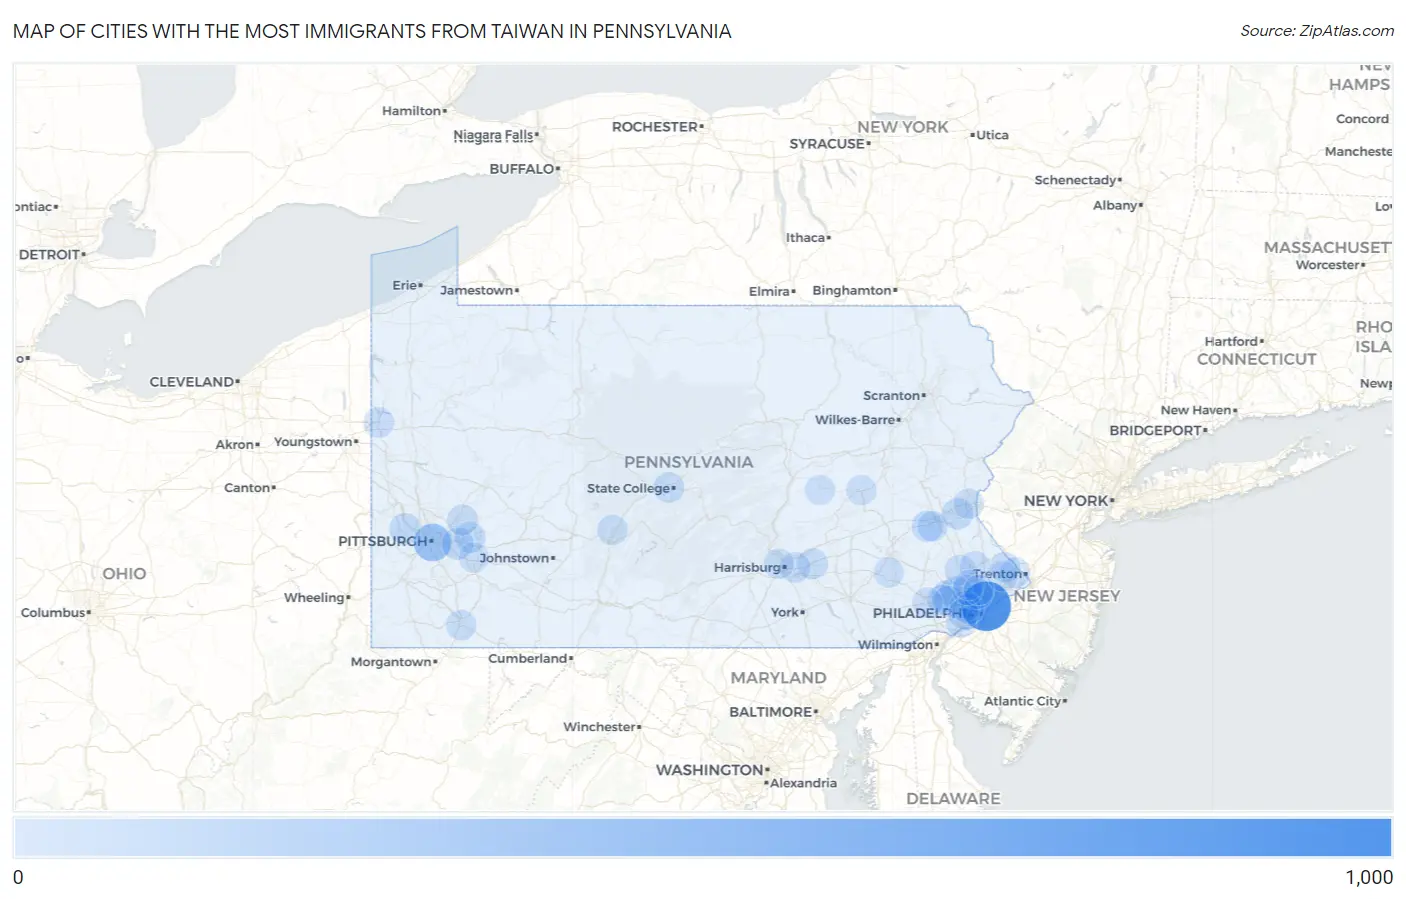
Map of Cities with the Most Immigrants from Taiwan in Pennsylvania
0
1,000
Cities with the Most Immigrants from Taiwan in Pennsylvania
| City | Taiwan | vs State | vs National | |
| 1. | Philadelphia | 862 | 6,097(14.14%)#1 | 376,336(0.23%)#64 |
| 2. | Pittsburgh | 322 | 6,097(5.28%)#2 | 376,336(0.09%)#165 |
| 3. | Aspinwall Borough | 139 | 6,097(2.28%)#3 | 376,336(0.04%)#380 |
| 4. | Morgan Hill | 138 | 6,097(2.26%)#4 | 376,336(0.04%)#383 |
| 5. | King Of Prussia | 90 | 6,097(1.48%)#5 | 376,336(0.02%)#532 |
| 6. | State College Borough | 86 | 6,097(1.41%)#6 | 376,336(0.02%)#559 |
| 7. | Chesterbrook | 77 | 6,097(1.26%)#7 | 376,336(0.02%)#627 |
| 8. | Narberth Borough | 75 | 6,097(1.23%)#8 | 376,336(0.02%)#639 |
| 9. | Monroeville | 71 | 6,097(1.16%)#9 | 376,336(0.02%)#667 |
| 10. | Media Borough | 70 | 6,097(1.15%)#10 | 376,336(0.02%)#683 |
| 11. | Whitehall Borough | 68 | 6,097(1.12%)#11 | 376,336(0.02%)#699 |
| 12. | Wilkinsburg Borough | 58 | 6,097(0.95%)#12 | 376,336(0.02%)#794 |
| 13. | Carnot Moon | 57 | 6,097(0.93%)#13 | 376,336(0.02%)#802 |
| 14. | Bethlehem | 55 | 6,097(0.90%)#14 | 376,336(0.01%)#815 |
| 15. | Northampton Borough | 55 | 6,097(0.90%)#15 | 376,336(0.01%)#824 |
| 16. | Breinigsville | 51 | 6,097(0.84%)#16 | 376,336(0.01%)#875 |
| 17. | Fox Chapel Borough | 51 | 6,097(0.84%)#17 | 376,336(0.01%)#877 |
| 18. | North Belle Vernon Borough | 45 | 6,097(0.74%)#18 | 376,336(0.01%)#944 |
| 19. | Murrysville | 43 | 6,097(0.71%)#19 | 376,336(0.01%)#963 |
| 20. | Mckinley | 41 | 6,097(0.67%)#20 | 376,336(0.01%)#1,006 |
| 21. | Lower Burrell | 34 | 6,097(0.56%)#21 | 376,336(0.01%)#1,127 |
| 22. | Hershey | 33 | 6,097(0.54%)#22 | 376,336(0.01%)#1,150 |
| 23. | Dilworthtown | 31 | 6,097(0.51%)#23 | 376,336(0.01%)#1,211 |
| 24. | Park Forest Village | 29 | 6,097(0.48%)#24 | 376,336(0.01%)#1,248 |
| 25. | Sellersville Borough | 29 | 6,097(0.48%)#25 | 376,336(0.01%)#1,253 |
| 26. | Mechanicsburg Borough | 28 | 6,097(0.46%)#26 | 376,336(0.01%)#1,275 |
| 27. | Lawnton | 28 | 6,097(0.46%)#27 | 376,336(0.01%)#1,278 |
| 28. | Berwyn | 28 | 6,097(0.46%)#28 | 376,336(0.01%)#1,281 |
| 29. | Forest Hills Borough | 26 | 6,097(0.43%)#29 | 376,336(0.01%)#1,334 |
| 30. | Ardmore | 25 | 6,097(0.41%)#30 | 376,336(0.01%)#1,359 |
| 31. | Eagleville Cdp Montgomery County | 22 | 6,097(0.36%)#31 | 376,336(0.01%)#1,452 |
| 32. | Hermitage | 20 | 6,097(0.33%)#32 | 376,336(0.01%)#1,519 |
| 33. | Kulpsville | 20 | 6,097(0.33%)#33 | 376,336(0.01%)#1,532 |
| 34. | Brittany Farms The Highlands | 20 | 6,097(0.33%)#34 | 376,336(0.01%)#1,541 |
| 35. | Trappe Borough | 19 | 6,097(0.31%)#35 | 376,336(0.01%)#1,584 |
| 36. | Penn Wynne | 18 | 6,097(0.30%)#36 | 376,336(0.00%)#1,625 |
| 37. | Wyndmoor | 18 | 6,097(0.30%)#37 | 376,336(0.00%)#1,626 |
| 38. | Weatherly Borough | 18 | 6,097(0.30%)#38 | 376,336(0.00%)#1,632 |
| 39. | Lansdale Borough | 17 | 6,097(0.28%)#39 | 376,336(0.00%)#1,652 |
| 40. | Roslyn | 16 | 6,097(0.26%)#40 | 376,336(0.00%)#1,716 |
| 41. | Chestnut Hill | 16 | 6,097(0.26%)#41 | 376,336(0.00%)#1,724 |
| 42. | Paoli | 16 | 6,097(0.26%)#42 | 376,336(0.00%)#1,725 |
| 43. | Swarthmore Borough | 15 | 6,097(0.25%)#43 | 376,336(0.00%)#1,784 |
| 44. | Franklin Park Borough | 14 | 6,097(0.23%)#44 | 376,336(0.00%)#1,831 |
| 45. | Indiana Borough | 13 | 6,097(0.21%)#45 | 376,336(0.00%)#1,890 |
| 46. | Swissvale Borough | 13 | 6,097(0.21%)#46 | 376,336(0.00%)#1,895 |
| 47. | Ancient Oaks | 13 | 6,097(0.21%)#47 | 376,336(0.00%)#1,898 |
| 48. | Folsom | 12 | 6,097(0.20%)#48 | 376,336(0.00%)#1,945 |
| 49. | Exton | 12 | 6,097(0.20%)#49 | 376,336(0.00%)#1,951 |
| 50. | West Chester Borough | 11 | 6,097(0.18%)#50 | 376,336(0.00%)#1,999 |
| 51. | Enola | 11 | 6,097(0.18%)#51 | 376,336(0.00%)#2,022 |
| 52. | Woodside | 11 | 6,097(0.18%)#52 | 376,336(0.00%)#2,029 |
| 53. | Muncy Borough | 11 | 6,097(0.18%)#53 | 376,336(0.00%)#2,032 |
| 54. | Drexel Hill | 10 | 6,097(0.16%)#54 | 376,336(0.00%)#2,055 |
| 55. | Bala Cynwyd | 10 | 6,097(0.16%)#55 | 376,336(0.00%)#2,087 |
| 56. | North Wales Borough | 10 | 6,097(0.16%)#56 | 376,336(0.00%)#2,101 |
| 57. | Malvern Borough | 10 | 6,097(0.16%)#57 | 376,336(0.00%)#2,102 |
| 58. | Village Shires | 10 | 6,097(0.16%)#58 | 376,336(0.00%)#2,104 |
| 59. | Plymouth Meeting | 9 | 6,097(0.15%)#59 | 376,336(0.00%)#2,154 |
| 60. | Newtown Grant | 9 | 6,097(0.15%)#60 | 376,336(0.00%)#2,159 |
| 61. | Palmer Heights | 9 | 6,097(0.15%)#61 | 376,336(0.00%)#2,162 |
| 62. | Slippery Rock Borough | 9 | 6,097(0.15%)#62 | 376,336(0.00%)#2,166 |
| 63. | Leith Hatfield | 9 | 6,097(0.15%)#63 | 376,336(0.00%)#2,172 |
| 64. | Altoona | 8 | 6,097(0.13%)#64 | 376,336(0.00%)#2,193 |
| 65. | Blue Bell | 8 | 6,097(0.13%)#65 | 376,336(0.00%)#2,226 |
| 66. | Bellefonte Borough | 8 | 6,097(0.13%)#66 | 376,336(0.00%)#2,228 |
| 67. | Phoenixville Borough | 7 | 6,097(0.11%)#67 | 376,336(0.00%)#2,272 |
| 68. | Conyngham Borough | 7 | 6,097(0.11%)#68 | 376,336(0.00%)#2,311 |
| 69. | Blawnox Borough | 7 | 6,097(0.11%)#69 | 376,336(0.00%)#2,312 |
| 70. | Wyomissing Borough | 6 | 6,097(0.10%)#70 | 376,336(0.00%)#2,348 |
| 71. | Hellertown Borough | 6 | 6,097(0.10%)#71 | 376,336(0.00%)#2,361 |
| 72. | Alleghenyville | 6 | 6,097(0.10%)#72 | 376,336(0.00%)#2,390 |
| 73. | East Stroudsburg Borough | 5 | 6,097(0.08%)#73 | 376,336(0.00%)#2,423 |
| 74. | New Oxford Borough | 5 | 6,097(0.08%)#74 | 376,336(0.00%)#2,437 |
| 75. | Leetsdale Borough | 5 | 6,097(0.08%)#75 | 376,336(0.00%)#2,440 |
| 76. | Altamont | 5 | 6,097(0.08%)#76 | 376,336(0.00%)#2,445 |
| 77. | Lewis Run Borough | 4 | 6,097(0.07%)#77 | 376,336(0.00%)#2,489 |
| 78. | Oreland | 3 | 6,097(0.05%)#78 | 376,336(0.00%)#2,510 |
| 79. | Bell Acres Borough | 3 | 6,097(0.05%)#79 | 376,336(0.00%)#2,526 |
| 80. | Long Branch Borough | 3 | 6,097(0.05%)#80 | 376,336(0.00%)#2,542 |
| 81. | Bridgewater Borough | 2 | 6,097(0.03%)#81 | 376,336(0.00%)#2,589 |
| 82. | East Side Borough | 2 | 6,097(0.03%)#82 | 376,336(0.00%)#2,600 |
| 83. | Jeannette | 1 | 6,097(0.02%)#83 | 376,336(0.00%)#2,627 |
| 84. | Fairview Ferndale | 1 | 6,097(0.02%)#84 | 376,336(0.00%)#2,640 |
| 85. | Hydetown Borough | 1 | 6,097(0.02%)#85 | 376,336(0.00%)#2,648 |
Common Questions
What are the Top 10 Cities with the Most Immigrants from Taiwan in Pennsylvania?
Top 10 Cities with the Most Immigrants from Taiwan in Pennsylvania are:
#1
862
#2
322
#3
90
#4
77
#5
71
#6
57
#7
55
#8
51
#9
43
#10
34
What city has the Most Immigrants from Taiwan in Pennsylvania?
Philadelphia has the Most Immigrants from Taiwan in Pennsylvania with 862.
What is the Total Immigrants from Taiwan in the State of Pennsylvania?
Total Immigrants from Taiwan in Pennsylvania is 6,097.
What is the Total Immigrants from Taiwan in the United States?
Total Immigrants from Taiwan in the United States is 376,336.