Cities with the Most Immigrants from Taiwan in Wisconsin
RELATED REPORTS & OPTIONS
Taiwan
Wisconsin
Compare Cities
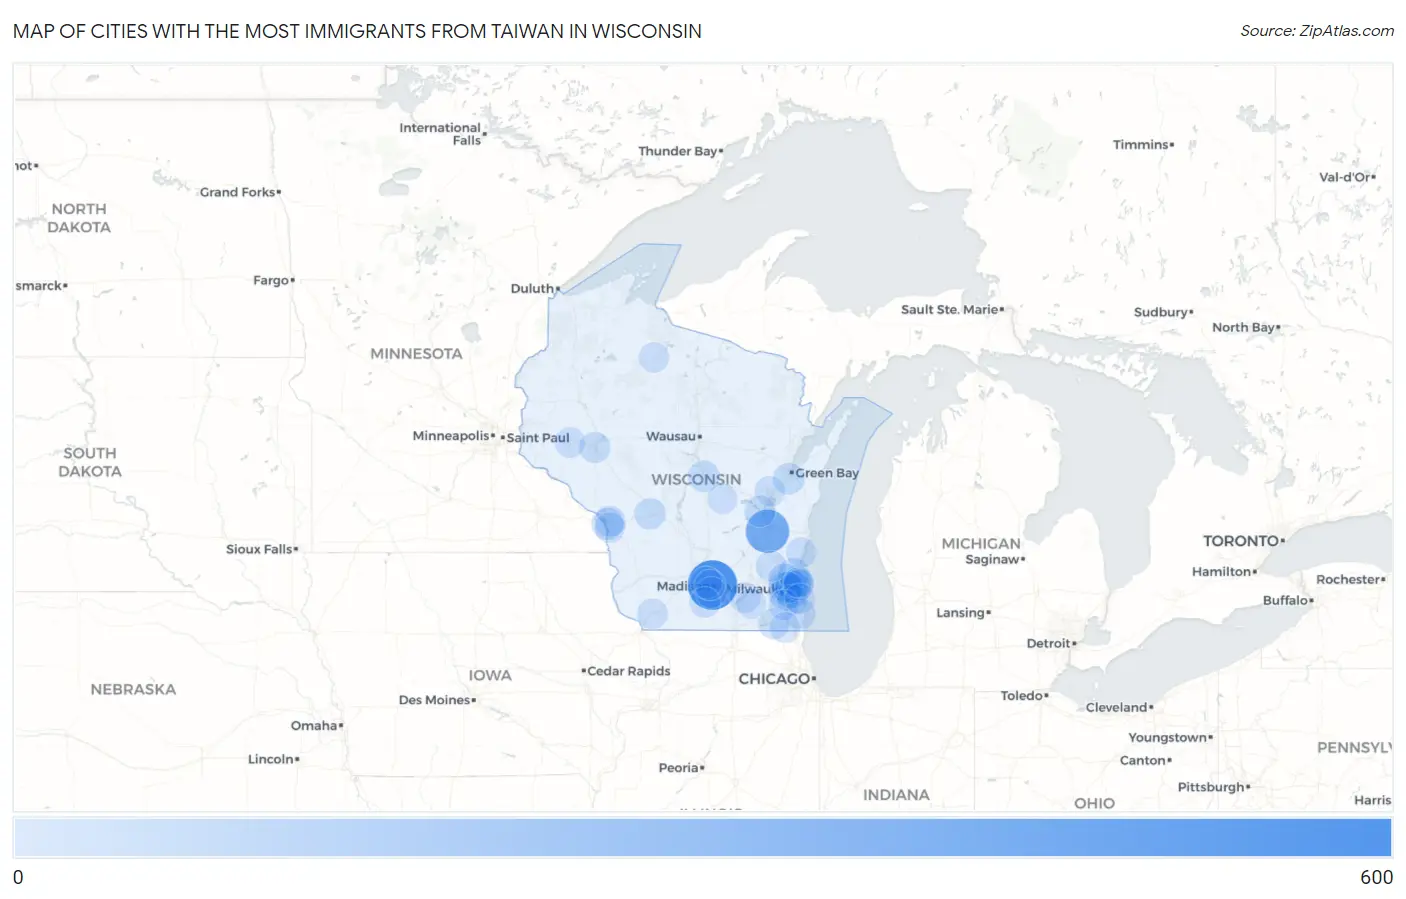
Map of Cities with the Most Immigrants from Taiwan in Wisconsin
0
600
Cities with the Most Immigrants from Taiwan in Wisconsin
| City | Taiwan | vs State | vs National | |
| 1. | Madison | 527 | 1,987(26.52%)#1 | 376,336(0.14%)#105 |
| 2. | Fond Du Lac | 356 | 1,987(17.92%)#2 | 376,336(0.09%)#155 |
| 3. | Brookfield | 75 | 1,987(3.77%)#3 | 376,336(0.02%)#637 |
| 4. | West Allis | 69 | 1,987(3.47%)#4 | 376,336(0.02%)#687 |
| 5. | New Berlin | 63 | 1,987(3.17%)#5 | 376,336(0.02%)#742 |
| 6. | Menomonee Falls | 63 | 1,987(3.17%)#6 | 376,336(0.02%)#743 |
| 7. | Milwaukee | 55 | 1,987(2.77%)#7 | 376,336(0.01%)#813 |
| 8. | Wauwatosa | 47 | 1,987(2.37%)#8 | 376,336(0.01%)#909 |
| 9. | French Island | 42 | 1,987(2.11%)#9 | 376,336(0.01%)#980 |
| 10. | Middleton | 41 | 1,987(2.06%)#10 | 376,336(0.01%)#996 |
| 11. | Mequon | 38 | 1,987(1.91%)#11 | 376,336(0.01%)#1,041 |
| 12. | De Pere | 37 | 1,987(1.86%)#12 | 376,336(0.01%)#1,064 |
| 13. | Plover | 37 | 1,987(1.86%)#13 | 376,336(0.01%)#1,068 |
| 14. | Glendale | 33 | 1,987(1.66%)#14 | 376,336(0.01%)#1,152 |
| 15. | Tomah | 31 | 1,987(1.56%)#15 | 376,336(0.01%)#1,201 |
| 16. | Elm Grove | 31 | 1,987(1.56%)#16 | 376,336(0.01%)#1,204 |
| 17. | Oshkosh | 28 | 1,987(1.41%)#17 | 376,336(0.01%)#1,258 |
| 18. | Mount Pleasant | 28 | 1,987(1.41%)#18 | 376,336(0.01%)#1,268 |
| 19. | Eau Claire | 26 | 1,987(1.31%)#19 | 376,336(0.01%)#1,316 |
| 20. | Fitchburg | 19 | 1,987(0.96%)#20 | 376,336(0.01%)#1,562 |
| 21. | Franklin | 16 | 1,987(0.81%)#21 | 376,336(0.00%)#1,687 |
| 22. | Onalaska | 16 | 1,987(0.81%)#22 | 376,336(0.00%)#1,704 |
| 23. | Hartford | 16 | 1,987(0.81%)#23 | 376,336(0.00%)#1,709 |
| 24. | Shorewood | 15 | 1,987(0.75%)#24 | 376,336(0.00%)#1,766 |
| 25. | Belleville | 14 | 1,987(0.70%)#25 | 376,336(0.00%)#1,852 |
| 26. | Lake Ivanhoe | 14 | 1,987(0.70%)#26 | 376,336(0.00%)#1,855 |
| 27. | Menomonie | 13 | 1,987(0.65%)#27 | 376,336(0.00%)#1,886 |
| 28. | La Crosse | 12 | 1,987(0.60%)#28 | 376,336(0.00%)#1,916 |
| 29. | Platteville | 12 | 1,987(0.60%)#29 | 376,336(0.00%)#1,937 |
| 30. | Fort Atkinson | 11 | 1,987(0.55%)#30 | 376,336(0.00%)#2,007 |
| 31. | Appleton | 9 | 1,987(0.45%)#31 | 376,336(0.00%)#2,120 |
| 32. | Wind Lake | 9 | 1,987(0.45%)#32 | 376,336(0.00%)#2,161 |
| 33. | Salem Lakes | 8 | 1,987(0.40%)#33 | 376,336(0.00%)#2,215 |
| 34. | Wild Rose | 8 | 1,987(0.40%)#34 | 376,336(0.00%)#2,251 |
| 35. | South Milwaukee | 7 | 1,987(0.35%)#35 | 376,336(0.00%)#2,268 |
| 36. | Whitefish Bay | 7 | 1,987(0.35%)#36 | 376,336(0.00%)#2,279 |
| 37. | Shorewood Hills | 6 | 1,987(0.30%)#37 | 376,336(0.00%)#2,379 |
| 38. | Belgium | 5 | 1,987(0.25%)#38 | 376,336(0.00%)#2,431 |
| 39. | Park Falls | 5 | 1,987(0.25%)#39 | 376,336(0.00%)#2,432 |
| 40. | Whitewater | 3 | 1,987(0.15%)#40 | 376,336(0.00%)#2,501 |
Common Questions
What are the Top 10 Cities with the Most Immigrants from Taiwan in Wisconsin?
Top 10 Cities with the Most Immigrants from Taiwan in Wisconsin are:
#1
527
#2
356
#3
75
#4
69
#5
63
#6
63
#7
55
#8
47
#9
42
#10
41
What city has the Most Immigrants from Taiwan in Wisconsin?
Madison has the Most Immigrants from Taiwan in Wisconsin with 527.
What is the Total Immigrants from Taiwan in the State of Wisconsin?
Total Immigrants from Taiwan in Wisconsin is 1,987.
What is the Total Immigrants from Taiwan in the United States?
Total Immigrants from Taiwan in the United States is 376,336.