Cities with the Most Immigrants from Jamaica in Pennsylvania
RELATED REPORTS & OPTIONS
Jamaica
Pennsylvania
Compare Cities
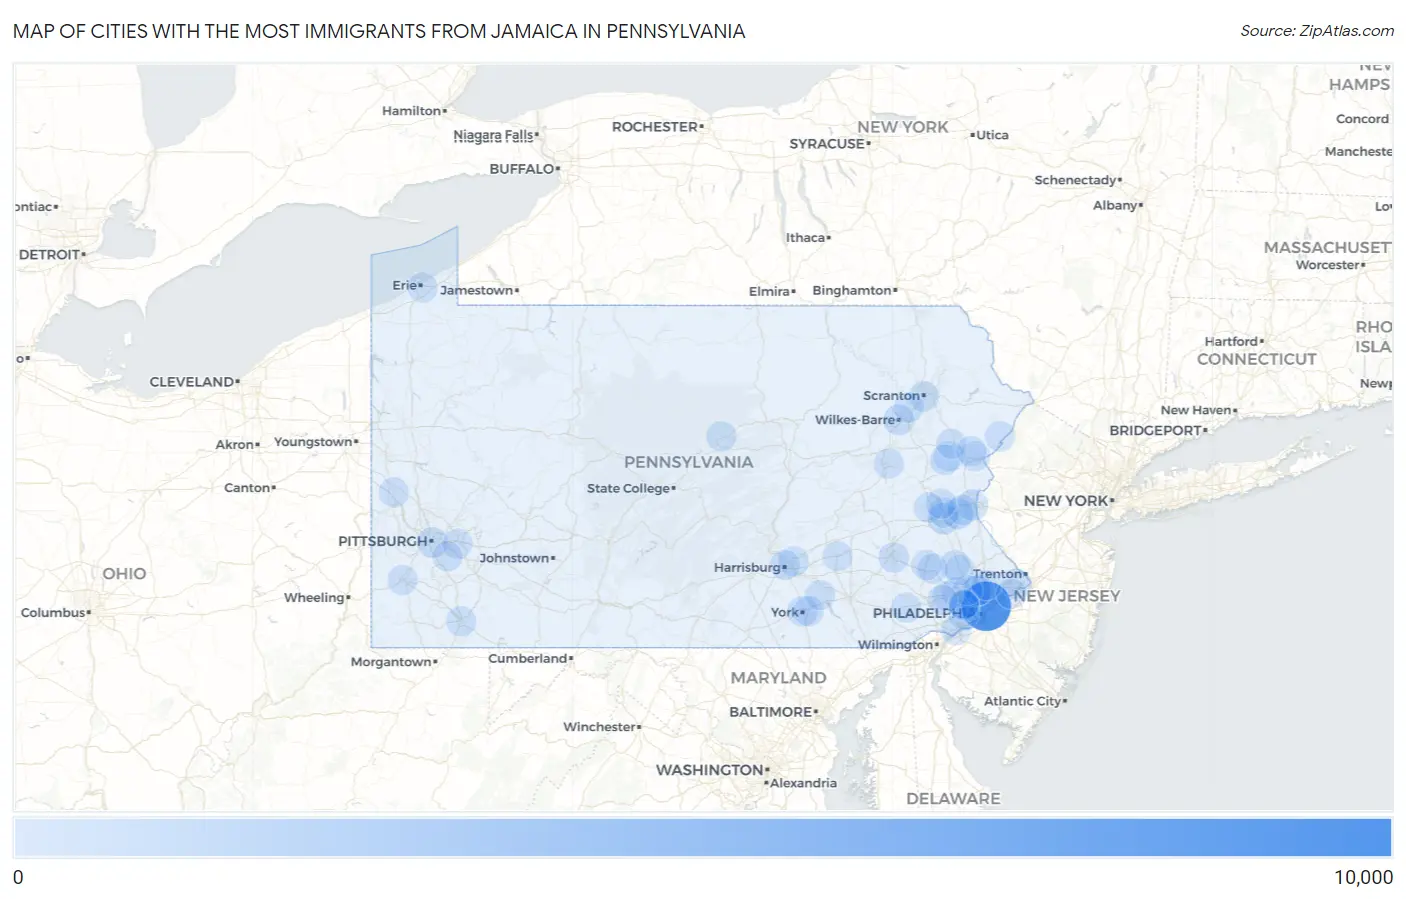
Map of Cities with the Most Immigrants from Jamaica in Pennsylvania
0
10,000
Cities with the Most Immigrants from Jamaica in Pennsylvania
| City | Jamaica | vs State | vs National | |
| 1. | Philadelphia | 9,333 | 22,612(41.27%)#1 | 785,998(1.19%)#5 |
| 2. | Allentown | 651 | 22,612(2.88%)#2 | 785,998(0.08%)#134 |
| 3. | Bethlehem | 538 | 22,612(2.38%)#3 | 785,998(0.07%)#169 |
| 4. | Easton | 513 | 22,612(2.27%)#4 | 785,998(0.07%)#177 |
| 5. | Norristown Borough | 498 | 22,612(2.20%)#5 | 785,998(0.06%)#184 |
| 6. | Yeadon Borough | 330 | 22,612(1.46%)#6 | 785,998(0.04%)#266 |
| 7. | Wilkes Barre | 255 | 22,612(1.13%)#7 | 785,998(0.03%)#314 |
| 8. | Pittsburgh | 252 | 22,612(1.11%)#8 | 785,998(0.03%)#318 |
| 9. | Baldwin Borough | 207 | 22,612(0.92%)#9 | 785,998(0.03%)#380 |
| 10. | York | 182 | 22,612(0.80%)#10 | 785,998(0.02%)#424 |
| 11. | Lansdale Borough | 176 | 22,612(0.78%)#11 | 785,998(0.02%)#438 |
| 12. | Darby Borough | 165 | 22,612(0.73%)#12 | 785,998(0.02%)#467 |
| 13. | Roslyn | 163 | 22,612(0.72%)#13 | 785,998(0.02%)#476 |
| 14. | Drexel Hill | 160 | 22,612(0.71%)#14 | 785,998(0.02%)#482 |
| 15. | King Of Prussia | 158 | 22,612(0.70%)#15 | 785,998(0.02%)#486 |
| 16. | Millersville Borough | 131 | 22,612(0.58%)#16 | 785,998(0.02%)#571 |
| 17. | Chester | 122 | 22,612(0.54%)#17 | 785,998(0.02%)#612 |
| 18. | Chambersburg Borough | 121 | 22,612(0.54%)#18 | 785,998(0.02%)#617 |
| 19. | Collingdale Borough | 118 | 22,612(0.52%)#19 | 785,998(0.02%)#632 |
| 20. | Morrisville Borough | 114 | 22,612(0.50%)#20 | 785,998(0.01%)#652 |
| 21. | East Lansdowne Borough | 108 | 22,612(0.48%)#21 | 785,998(0.01%)#680 |
| 22. | Reading | 106 | 22,612(0.47%)#22 | 785,998(0.01%)#690 |
| 23. | State College Borough | 106 | 22,612(0.47%)#23 | 785,998(0.01%)#692 |
| 24. | Scranton | 97 | 22,612(0.43%)#24 | 785,998(0.01%)#740 |
| 25. | Pine Ridge | 87 | 22,612(0.38%)#25 | 785,998(0.01%)#804 |
| 26. | Hazleton | 74 | 22,612(0.33%)#26 | 785,998(0.01%)#883 |
| 27. | Sharon Hill Borough | 74 | 22,612(0.33%)#27 | 785,998(0.01%)#887 |
| 28. | Levittown | 73 | 22,612(0.32%)#28 | 785,998(0.01%)#893 |
| 29. | Pleasant Hills Borough | 73 | 22,612(0.32%)#29 | 785,998(0.01%)#896 |
| 30. | Uniontown | 70 | 22,612(0.31%)#30 | 785,998(0.01%)#932 |
| 31. | Hayti | 69 | 22,612(0.31%)#31 | 785,998(0.01%)#944 |
| 32. | Monroeville | 65 | 22,612(0.29%)#32 | 785,998(0.01%)#982 |
| 33. | Kittanning Borough | 57 | 22,612(0.25%)#33 | 785,998(0.01%)#1,079 |
| 34. | Sierra View | 56 | 22,612(0.25%)#34 | 785,998(0.01%)#1,093 |
| 35. | West Chester Borough | 52 | 22,612(0.23%)#35 | 785,998(0.01%)#1,136 |
| 36. | Ardmore | 47 | 22,612(0.21%)#36 | 785,998(0.01%)#1,209 |
| 37. | Wyomissing Borough | 47 | 22,612(0.21%)#37 | 785,998(0.01%)#1,210 |
| 38. | Arlington Heights | 47 | 22,612(0.21%)#38 | 785,998(0.01%)#1,213 |
| 39. | Whitehall Borough | 46 | 22,612(0.20%)#39 | 785,998(0.01%)#1,223 |
| 40. | Flourtown | 45 | 22,612(0.20%)#40 | 785,998(0.01%)#1,239 |
| 41. | Blakely Borough | 44 | 22,612(0.19%)#41 | 785,998(0.01%)#1,257 |
| 42. | Sanatoga | 41 | 22,612(0.18%)#42 | 785,998(0.01%)#1,305 |
| 43. | Lansdowne Borough | 40 | 22,612(0.18%)#43 | 785,998(0.01%)#1,316 |
| 44. | Hanover Borough | 39 | 22,612(0.17%)#44 | 785,998(0.00%)#1,334 |
| 45. | Indiana Borough | 37 | 22,612(0.16%)#45 | 785,998(0.00%)#1,371 |
| 46. | Souderton Borough | 35 | 22,612(0.15%)#46 | 785,998(0.00%)#1,419 |
| 47. | Oreland | 35 | 22,612(0.15%)#47 | 785,998(0.00%)#1,421 |
| 48. | Lebanon | 34 | 22,612(0.15%)#48 | 785,998(0.00%)#1,434 |
| 49. | Wilson Borough | 34 | 22,612(0.15%)#49 | 785,998(0.00%)#1,442 |
| 50. | Middletown Borough | 33 | 22,612(0.15%)#50 | 785,998(0.00%)#1,460 |
| 51. | Sun Valley | 33 | 22,612(0.15%)#51 | 785,998(0.00%)#1,467 |
| 52. | Fullerton | 30 | 22,612(0.13%)#52 | 785,998(0.00%)#1,532 |
| 53. | Bala Cynwyd | 30 | 22,612(0.13%)#53 | 785,998(0.00%)#1,534 |
| 54. | Colonial Park | 29 | 22,612(0.13%)#54 | 785,998(0.00%)#1,548 |
| 55. | East Stroudsburg Borough | 29 | 22,612(0.13%)#55 | 785,998(0.00%)#1,559 |
| 56. | Emerald Lakes | 29 | 22,612(0.13%)#56 | 785,998(0.00%)#1,566 |
| 57. | Lock Haven | 28 | 22,612(0.12%)#57 | 785,998(0.00%)#1,590 |
| 58. | Pittston | 26 | 22,612(0.11%)#58 | 785,998(0.00%)#1,662 |
| 59. | Elizabethtown Borough | 25 | 22,612(0.11%)#59 | 785,998(0.00%)#1,683 |
| 60. | Laureldale Borough | 25 | 22,612(0.11%)#60 | 785,998(0.00%)#1,692 |
| 61. | Chesterbrook | 24 | 22,612(0.11%)#61 | 785,998(0.00%)#1,718 |
| 62. | Erie | 23 | 22,612(0.10%)#62 | 785,998(0.00%)#1,728 |
| 63. | Beaver Falls | 23 | 22,612(0.10%)#63 | 785,998(0.00%)#1,743 |
| 64. | Middletown | 23 | 22,612(0.10%)#64 | 785,998(0.00%)#1,745 |
| 65. | Kulpsville | 22 | 22,612(0.10%)#65 | 785,998(0.00%)#1,776 |
| 66. | Aldan Borough | 22 | 22,612(0.10%)#66 | 785,998(0.00%)#1,785 |
| 67. | Ridley Park Borough | 21 | 22,612(0.09%)#67 | 785,998(0.00%)#1,821 |
| 68. | Coaldale Borough Schuylkill County | 21 | 22,612(0.09%)#68 | 785,998(0.00%)#1,831 |
| 69. | Mckeesport | 20 | 22,612(0.09%)#69 | 785,998(0.00%)#1,851 |
| 70. | Mount Penn Borough | 20 | 22,612(0.09%)#70 | 785,998(0.00%)#1,870 |
| 71. | Harrisburg | 19 | 22,612(0.08%)#71 | 785,998(0.00%)#1,882 |
| 72. | Pottstown Borough | 19 | 22,612(0.08%)#72 | 785,998(0.00%)#1,889 |
| 73. | Wilkinsburg Borough | 19 | 22,612(0.08%)#73 | 785,998(0.00%)#1,895 |
| 74. | East York | 19 | 22,612(0.08%)#74 | 785,998(0.00%)#1,899 |
| 75. | Plymouth Meeting | 19 | 22,612(0.08%)#75 | 785,998(0.00%)#1,904 |
| 76. | Bryn Mawr | 19 | 22,612(0.08%)#76 | 785,998(0.00%)#1,911 |
| 77. | Halfway House | 19 | 22,612(0.08%)#77 | 785,998(0.00%)#1,917 |
| 78. | Geistown Borough | 19 | 22,612(0.08%)#78 | 785,998(0.00%)#1,918 |
| 79. | Cementon | 18 | 22,612(0.08%)#79 | 785,998(0.00%)#1,965 |
| 80. | Willow Grove | 17 | 22,612(0.08%)#80 | 785,998(0.00%)#1,984 |
| 81. | Quakertown Borough | 17 | 22,612(0.08%)#81 | 785,998(0.00%)#1,994 |
| 82. | Glassport Borough | 17 | 22,612(0.08%)#82 | 785,998(0.00%)#1,999 |
| 83. | Shenandoah Borough | 17 | 22,612(0.08%)#83 | 785,998(0.00%)#2,002 |
| 84. | Malvern Borough | 17 | 22,612(0.08%)#84 | 785,998(0.00%)#2,003 |
| 85. | Phoenixville Borough | 16 | 22,612(0.07%)#85 | 785,998(0.00%)#2,030 |
| 86. | Croydon | 16 | 22,612(0.07%)#86 | 785,998(0.00%)#2,039 |
| 87. | Paoli | 16 | 22,612(0.07%)#87 | 785,998(0.00%)#2,044 |
| 88. | Harleysville | 15 | 22,612(0.07%)#88 | 785,998(0.00%)#2,087 |
| 89. | Richlandtown Borough | 15 | 22,612(0.07%)#89 | 785,998(0.00%)#2,108 |
| 90. | Penn Estates | 14 | 22,612(0.06%)#90 | 785,998(0.00%)#2,139 |
| 91. | Washington | 13 | 22,612(0.06%)#91 | 785,998(0.00%)#2,168 |
| 92. | Media Borough | 13 | 22,612(0.06%)#92 | 785,998(0.00%)#2,182 |
| 93. | Schnecksville | 13 | 22,612(0.06%)#93 | 785,998(0.00%)#2,189 |
| 94. | St Lawrence Borough | 12 | 22,612(0.05%)#94 | 785,998(0.00%)#2,254 |
| 95. | Haverford College | 12 | 22,612(0.05%)#95 | 785,998(0.00%)#2,256 |
| 96. | Milton Borough | 11 | 22,612(0.05%)#96 | 785,998(0.00%)#2,297 |
| 97. | Maytown | 11 | 22,612(0.05%)#97 | 785,998(0.00%)#2,308 |
| 98. | Eagle | 11 | 22,612(0.05%)#98 | 785,998(0.00%)#2,325 |
| 99. | Coatesville | 10 | 22,612(0.04%)#99 | 785,998(0.00%)#2,356 |
| 100. | West View Borough | 10 | 22,612(0.04%)#100 | 785,998(0.00%)#2,367 |
Common Questions
What are the Top 10 Cities with the Most Immigrants from Jamaica in Pennsylvania?
Top 10 Cities with the Most Immigrants from Jamaica in Pennsylvania are:
#1
9,333
#2
651
#3
538
#4
513
#5
255
#6
252
#7
182
#8
160
#9
158
#10
122
What city has the Most Immigrants from Jamaica in Pennsylvania?
Philadelphia has the Most Immigrants from Jamaica in Pennsylvania with 9,333.
What is the Total Immigrants from Jamaica in the State of Pennsylvania?
Total Immigrants from Jamaica in Pennsylvania is 22,612.
What is the Total Immigrants from Jamaica in the United States?
Total Immigrants from Jamaica in the United States is 785,998.