Cities with the Most Immigrants from Jamaica in Wisconsin
RELATED REPORTS & OPTIONS
Jamaica
Wisconsin
Compare Cities
Map of Cities with the Most Immigrants from Jamaica in Wisconsin
0
800
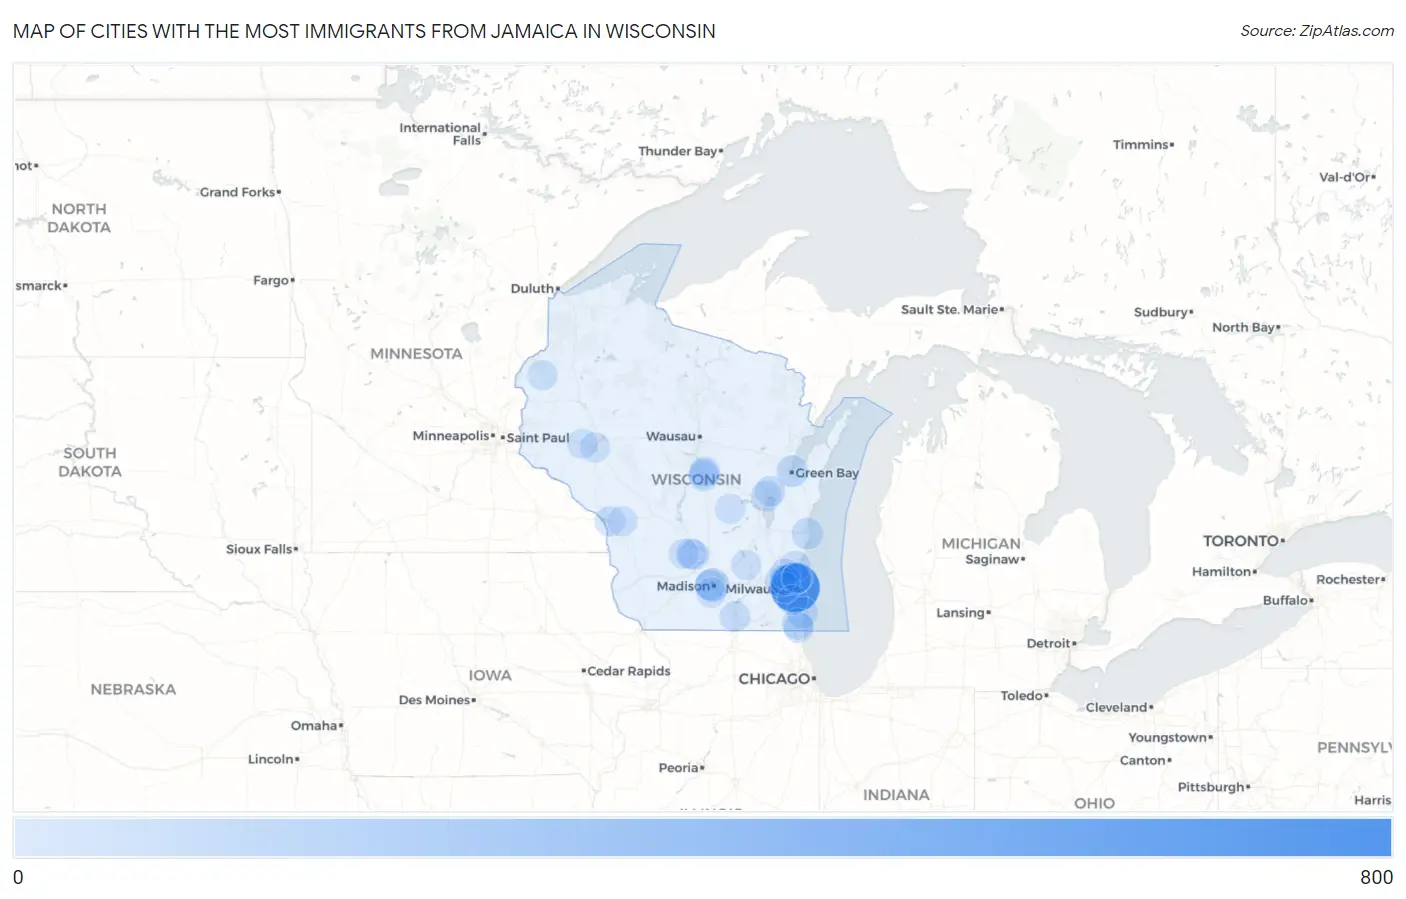
Cities with the Most Immigrants from Jamaica in Wisconsin
| City | Jamaica | vs State | vs National | |
| 1. | Milwaukee | 763 | 1,623(47.01%)#1 | 785,998(0.10%)#113 |
| 2. | Madison | 131 | 1,623(8.07%)#2 | 785,998(0.02%)#569 |
| 3. | Brown Deer | 111 | 1,623(6.84%)#3 | 785,998(0.01%)#666 |
| 4. | Green Bay | 60 | 1,623(3.70%)#4 | 785,998(0.01%)#1,036 |
| 5. | Sheboygan | 46 | 1,623(2.83%)#5 | 785,998(0.01%)#1,219 |
| 6. | Racine | 39 | 1,623(2.40%)#6 | 785,998(0.00%)#1,328 |
| 7. | Kenosha | 36 | 1,623(2.22%)#7 | 785,998(0.00%)#1,388 |
| 8. | Fox Crossing | 28 | 1,623(1.73%)#8 | 785,998(0.00%)#1,581 |
| 9. | Grafton | 27 | 1,623(1.66%)#9 | 785,998(0.00%)#1,623 |
| 10. | Brookfield | 26 | 1,623(1.60%)#10 | 785,998(0.00%)#1,643 |
| 11. | Janesville | 25 | 1,623(1.54%)#11 | 785,998(0.00%)#1,668 |
| 12. | Appleton | 21 | 1,623(1.29%)#12 | 785,998(0.00%)#1,795 |
| 13. | Baraboo | 20 | 1,623(1.23%)#13 | 785,998(0.00%)#1,855 |
| 14. | Sussex | 20 | 1,623(1.23%)#14 | 785,998(0.00%)#1,856 |
| 15. | Plover | 19 | 1,623(1.17%)#15 | 785,998(0.00%)#1,896 |
| 16. | Onalaska | 16 | 1,623(0.99%)#16 | 785,998(0.00%)#2,029 |
| 17. | Pleasant Prairie | 15 | 1,623(0.92%)#17 | 785,998(0.00%)#2,076 |
| 18. | Germantown | 14 | 1,623(0.86%)#18 | 785,998(0.00%)#2,120 |
| 19. | West Baraboo | 13 | 1,623(0.80%)#19 | 785,998(0.00%)#2,196 |
| 20. | Shorewood Hills | 12 | 1,623(0.74%)#20 | 785,998(0.00%)#2,251 |
| 21. | Menomonee Falls | 10 | 1,623(0.62%)#21 | 785,998(0.00%)#2,339 |
| 22. | Franklin | 10 | 1,623(0.62%)#22 | 785,998(0.00%)#2,340 |
| 23. | Bayside | 10 | 1,623(0.62%)#23 | 785,998(0.00%)#2,373 |
| 24. | Lewis | 10 | 1,623(0.62%)#24 | 785,998(0.00%)#2,403 |
| 25. | Redgranite | 6 | 1,623(0.37%)#25 | 785,998(0.00%)#2,670 |
| 26. | Whiting | 6 | 1,623(0.37%)#26 | 785,998(0.00%)#2,674 |
| 27. | Eau Claire | 5 | 1,623(0.31%)#27 | 785,998(0.00%)#2,681 |
| 28. | Fitchburg | 4 | 1,623(0.25%)#28 | 785,998(0.00%)#2,758 |
| 29. | Stevens Point | 4 | 1,623(0.25%)#29 | 785,998(0.00%)#2,760 |
| 30. | Rock Springs | 4 | 1,623(0.25%)#30 | 785,998(0.00%)#2,811 |
| 31. | Lowell | 3 | 1,623(0.18%)#31 | 785,998(0.00%)#2,873 |
| 32. | River Hills | 2 | 1,623(0.12%)#32 | 785,998(0.00%)#2,919 |
| 33. | Bangor | 2 | 1,623(0.12%)#33 | 785,998(0.00%)#2,921 |
| 34. | Elk Mound | 2 | 1,623(0.12%)#34 | 785,998(0.00%)#2,925 |
Common Questions
What are the Top 10 Cities with the Most Immigrants from Jamaica in Wisconsin?
Top 10 Cities with the Most Immigrants from Jamaica in Wisconsin are:
#1
763
#2
131
#3
111
#4
60
#5
46
#6
39
#7
36
#8
28
#9
27
#10
26
What city has the Most Immigrants from Jamaica in Wisconsin?
Milwaukee has the Most Immigrants from Jamaica in Wisconsin with 763.
What is the Total Immigrants from Jamaica in the State of Wisconsin?
Total Immigrants from Jamaica in Wisconsin is 1,623.
What is the Total Immigrants from Jamaica in the United States?
Total Immigrants from Jamaica in the United States is 785,998.