Cities with the Highest Percentage of Population with a Degree in Literature and Languages in Connecticut
RELATED REPORTS & OPTIONS
Literature and Languages
Connecticut
Compare Cities
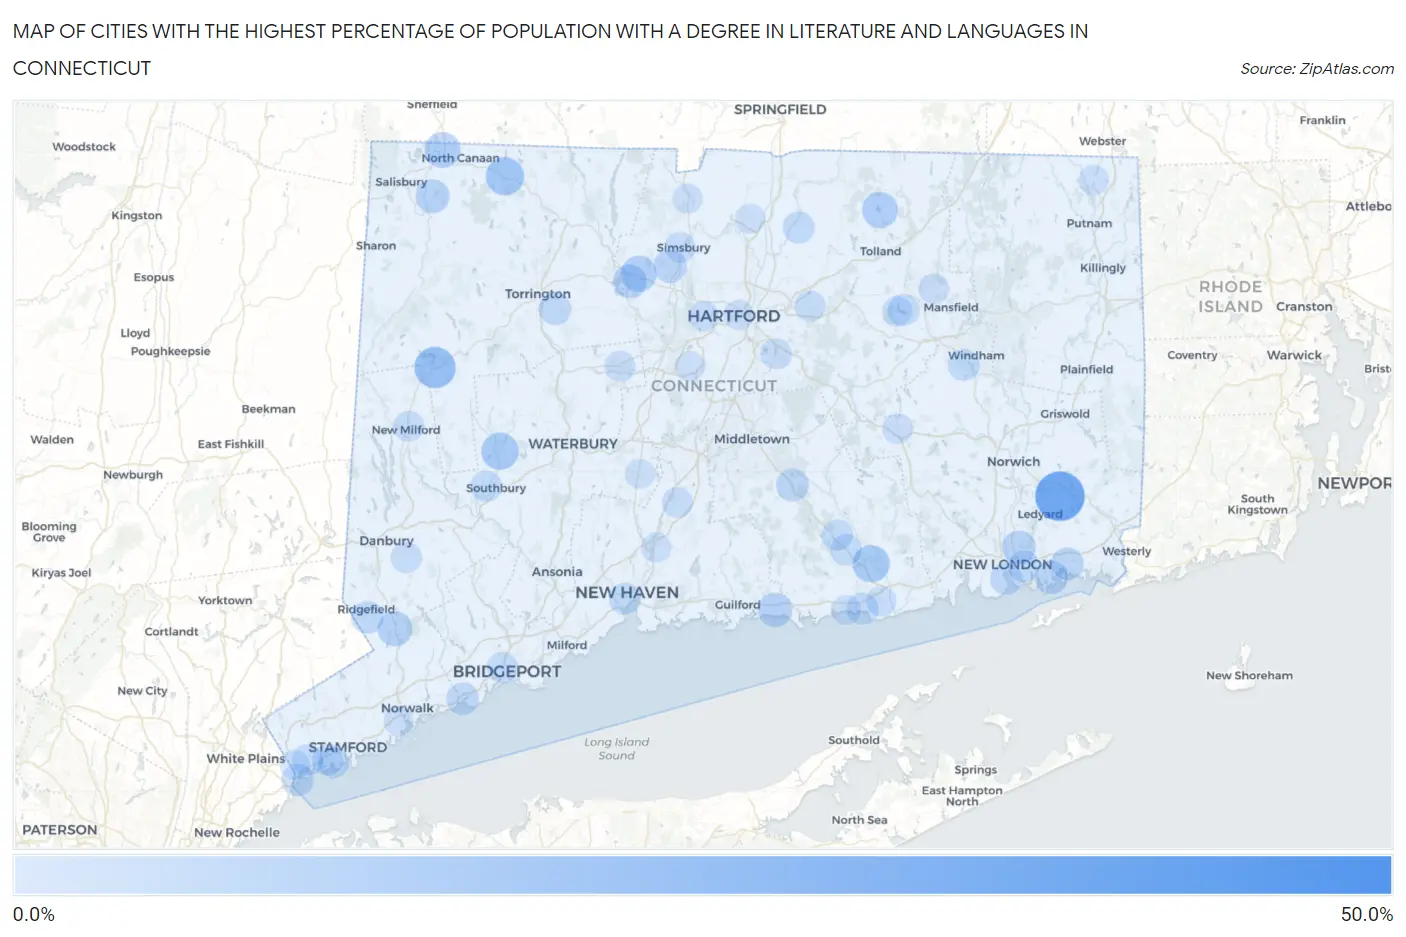
Map of Cities with the Highest Percentage of Population with a Degree in Literature and Languages in Connecticut
0.0%
50.0%
Cities with the Highest Percentage of Population with a Degree in Literature and Languages in Connecticut
| City | % Graduates | vs State | vs National | |
| 1. | Pleasant Valley | 44.6% | 6.1%(+38.4)#1 | 4.4%(+40.2)#121 |
| 2. | Mashantucket | 33.3% | 6.1%(+27.2)#2 | 4.4%(+28.9)#244 |
| 3. | Sail Harbor | 31.0% | 6.1%(+24.9)#3 | 4.4%(+26.6)#287 |
| 4. | Litchfield Borough | 27.9% | 6.1%(+21.8)#4 | 4.4%(+23.5)#353 |
| 5. | Danielson Borough | 21.8% | 6.1%(+15.7)#5 | 4.4%(+17.4)#547 |
| 6. | New Preston | 21.3% | 6.1%(+15.2)#6 | 4.4%(+16.9)#573 |
| 7. | Candlewood Shores | 21.3% | 6.1%(+15.2)#7 | 4.4%(+16.9)#576 |
| 8. | Fenwick Borough | 18.8% | 6.1%(+12.6)#8 | 4.4%(+14.3)#732 |
| 9. | Norfolk | 17.3% | 6.1%(+11.2)#9 | 4.4%(+12.9)#842 |
| 10. | Candlewood Lake Club | 17.1% | 6.1%(+11.0)#10 | 4.4%(+12.7)#856 |
| 11. | Lakeside Woods | 17.1% | 6.1%(+10.9)#11 | 4.4%(+12.7)#857 |
| 12. | Stonington Borough | 16.8% | 6.1%(+10.6)#12 | 4.4%(+12.3)#872 |
| 13. | Woodbury Center | 15.7% | 6.1%(+9.56)#13 | 4.4%(+11.3)#983 |
| 14. | Essex Village | 15.5% | 6.1%(+9.42)#14 | 4.4%(+11.1)#999 |
| 15. | Cornwall Bridge | 14.5% | 6.1%(+8.40)#15 | 4.4%(+10.1)#1,115 |
| 16. | Canton Valley | 13.8% | 6.1%(+7.67)#16 | 4.4%(+9.37)#1,266 |
| 17. | Crystal Lake | 13.7% | 6.1%(+7.61)#17 | 4.4%(+9.32)#1,271 |
| 18. | Canaan | 13.7% | 6.1%(+7.57)#18 | 4.4%(+9.27)#1,278 |
| 19. | Ridgebury | 13.7% | 6.1%(+7.54)#19 | 4.4%(+9.24)#1,284 |
| 20. | Old Hill | 13.3% | 6.1%(+7.15)#20 | 4.4%(+8.86)#1,362 |
| 21. | Georgetown | 12.5% | 6.1%(+6.34)#21 | 4.4%(+8.05)#1,501 |
| 22. | Candlewood Isle | 12.2% | 6.1%(+6.12)#22 | 4.4%(+7.82)#1,534 |
| 23. | Madison Center | 11.9% | 6.1%(+5.82)#23 | 4.4%(+7.53)#1,580 |
| 24. | Noroton | 11.4% | 6.1%(+5.24)#24 | 4.4%(+6.95)#1,704 |
| 25. | Falls Village | 11.4% | 6.1%(+5.23)#25 | 4.4%(+6.94)#1,705 |
| 26. | Candlewood Orchards | 11.3% | 6.1%(+5.19)#26 | 4.4%(+6.90)#1,712 |
| 27. | Collinsville | 11.2% | 6.1%(+5.11)#27 | 4.4%(+6.82)#1,735 |
| 28. | Conning Towers Nautilus Park | 10.8% | 6.1%(+4.68)#28 | 4.4%(+6.38)#1,882 |
| 29. | Lakes East | 10.8% | 6.1%(+4.68)#29 | 4.4%(+6.38)#1,883 |
| 30. | Compo | 10.8% | 6.1%(+4.66)#30 | 4.4%(+6.36)#1,891 |
| 31. | Northford | 10.7% | 6.1%(+4.58)#31 | 4.4%(+6.28)#1,918 |
| 32. | Candlewood Knolls | 10.6% | 6.1%(+4.47)#32 | 4.4%(+6.18)#1,948 |
| 33. | Quasset Lake | 10.4% | 6.1%(+4.30)#33 | 4.4%(+6.01)#2,005 |
| 34. | Noank | 10.3% | 6.1%(+4.13)#34 | 4.4%(+5.84)#2,060 |
| 35. | Weatogue | 10.1% | 6.1%(+3.94)#35 | 4.4%(+5.65)#2,122 |
| 36. | New Canaan | 10.1% | 6.1%(+3.94)#36 | 4.4%(+5.64)#2,123 |
| 37. | Higganum | 9.7% | 6.1%(+3.55)#37 | 4.4%(+5.26)#2,271 |
| 38. | Mystic | 9.6% | 6.1%(+3.45)#38 | 4.4%(+5.16)#2,315 |
| 39. | Northwest Harwinton | 9.4% | 6.1%(+3.24)#39 | 4.4%(+4.95)#2,402 |
| 40. | Southport | 9.3% | 6.1%(+3.17)#40 | 4.4%(+4.88)#2,436 |
| 41. | Lake Chaffee | 9.2% | 6.1%(+3.09)#41 | 4.4%(+4.80)#2,472 |
| 42. | Ridgefield | 9.2% | 6.1%(+3.04)#42 | 4.4%(+4.75)#2,494 |
| 43. | Ball Pond | 9.1% | 6.1%(+3.03)#43 | 4.4%(+4.74)#2,496 |
| 44. | Darien Downtown | 9.1% | 6.1%(+2.94)#44 | 4.4%(+4.65)#2,558 |
| 45. | Taylor Corners | 9.0% | 6.1%(+2.88)#45 | 4.4%(+4.59)#2,586 |
| 46. | New London | 8.9% | 6.1%(+2.82)#46 | 4.4%(+4.53)#2,625 |
| 47. | Byram | 8.9% | 6.1%(+2.79)#47 | 4.4%(+4.50)#2,641 |
| 48. | Saybrook Manor | 8.6% | 6.1%(+2.53)#48 | 4.4%(+4.24)#2,783 |
| 49. | New Haven | 8.6% | 6.1%(+2.51)#49 | 4.4%(+4.22)#2,795 |
| 50. | Broad Brook | 8.5% | 6.1%(+2.41)#50 | 4.4%(+4.11)#2,858 |
| 51. | South Windham | 8.4% | 6.1%(+2.27)#51 | 4.4%(+3.97)#2,929 |
| 52. | Murray | 8.3% | 6.1%(+2.20)#52 | 4.4%(+3.90)#2,992 |
| 53. | Long Hill | 8.3% | 6.1%(+2.16)#53 | 4.4%(+3.87)#3,003 |
| 54. | Bantam Borough | 8.3% | 6.1%(+2.15)#54 | 4.4%(+3.85)#3,010 |
| 55. | South Coventry | 8.1% | 6.1%(+2.00)#55 | 4.4%(+3.70)#3,102 |
| 56. | Deep River Center | 8.1% | 6.1%(+1.97)#56 | 4.4%(+3.67)#3,126 |
| 57. | Woodmont Borough | 8.1% | 6.1%(+1.95)#57 | 4.4%(+3.66)#3,133 |
| 58. | Coleytown | 8.0% | 6.1%(+1.92)#58 | 4.4%(+3.63)#3,151 |
| 59. | Sandy Hook | 7.8% | 6.1%(+1.71)#59 | 4.4%(+3.41)#3,280 |
| 60. | Heritage Village | 7.8% | 6.1%(+1.69)#60 | 4.4%(+3.39)#3,291 |
| 61. | Bridgewater | 7.8% | 6.1%(+1.68)#61 | 4.4%(+3.38)#3,301 |
| 62. | Old Greenwich | 7.7% | 6.1%(+1.57)#62 | 4.4%(+3.28)#3,383 |
| 63. | Bridgeport | 7.7% | 6.1%(+1.55)#63 | 4.4%(+3.26)#3,393 |
| 64. | Jewett City Borough | 7.7% | 6.1%(+1.53)#64 | 4.4%(+3.24)#3,407 |
| 65. | Chester Center | 7.6% | 6.1%(+1.53)#65 | 4.4%(+3.24)#3,411 |
| 66. | Greenwich | 7.6% | 6.1%(+1.52)#66 | 4.4%(+3.22)#3,418 |
| 67. | Newtown Borough | 7.5% | 6.1%(+1.35)#67 | 4.4%(+3.06)#3,531 |
| 68. | Riverside | 7.4% | 6.1%(+1.29)#68 | 4.4%(+3.00)#3,563 |
| 69. | Staples | 7.2% | 6.1%(+1.11)#69 | 4.4%(+2.81)#3,716 |
| 70. | Glastonbury Center | 7.2% | 6.1%(+1.07)#70 | 4.4%(+2.78)#3,753 |
| 71. | Cornwall | 7.1% | 6.1%(+1.03)#71 | 4.4%(+2.73)#3,822 |
| 72. | Simsbury Center | 7.1% | 6.1%(+1.02)#72 | 4.4%(+2.72)#3,825 |
| 73. | Manchester | 7.1% | 6.1%(+1.01)#73 | 4.4%(+2.72)#3,828 |
| 74. | Noroton Heights | 7.1% | 6.1%(+0.976)#74 | 4.4%(+2.68)#3,851 |
| 75. | Oronoque | 7.1% | 6.1%(+0.974)#75 | 4.4%(+2.68)#3,855 |
| 76. | Wallingford Center | 7.0% | 6.1%(+0.930)#76 | 4.4%(+2.64)#3,897 |
| 77. | Tokeneke | 7.0% | 6.1%(+0.889)#77 | 4.4%(+2.60)#3,932 |
| 78. | Bethel | 7.0% | 6.1%(+0.886)#78 | 4.4%(+2.59)#3,936 |
| 79. | Bristol | 7.0% | 6.1%(+0.856)#79 | 4.4%(+2.56)#3,966 |
| 80. | Groton Long Point Borough | 7.0% | 6.1%(+0.853)#80 | 4.4%(+2.56)#3,969 |
| 81. | New Milford | 6.8% | 6.1%(+0.723)#81 | 4.4%(+2.43)#4,104 |
| 82. | West Hartford | 6.6% | 6.1%(+0.530)#82 | 4.4%(+2.24)#4,295 |
| 83. | Colchester | 6.6% | 6.1%(+0.517)#83 | 4.4%(+2.22)#4,304 |
| 84. | Storrs | 6.6% | 6.1%(+0.453)#84 | 4.4%(+2.16)#4,357 |
| 85. | Route 7 Gateway | 6.5% | 6.1%(+0.410)#85 | 4.4%(+2.12)#4,405 |
| 86. | Naugatuck Borough | 6.5% | 6.1%(+0.367)#86 | 4.4%(+2.07)#4,451 |
| 87. | Old Saybrook Center | 6.4% | 6.1%(+0.272)#87 | 4.4%(+1.98)#4,550 |
| 88. | Saugatuck | 6.4% | 6.1%(+0.265)#88 | 4.4%(+1.97)#4,568 |
| 89. | Hartford | 6.3% | 6.1%(+0.201)#89 | 4.4%(+1.91)#4,634 |
| 90. | Coventry Lake | 6.2% | 6.1%(+0.133)#90 | 4.4%(+1.84)#4,709 |
| 91. | Westport | 6.2% | 6.1%(+0.081)#91 | 4.4%(+1.79)#4,786 |
| 92. | Salmon Brook | 6.1% | 6.1%(+0.027)#92 | 4.4%(+1.73)#4,850 |
| 93. | New Britain | 6.1% | 6.1%(-0.015)#93 | 4.4%(+1.69)#4,907 |
| 94. | Pemberwick | 6.1% | 6.1%(-0.031)#94 | 4.4%(+1.68)#4,928 |
| 95. | Westbrook Center | 6.1% | 6.1%(-0.061)#95 | 4.4%(+1.65)#4,971 |
| 96. | Cheshire Village | 6.1% | 6.1%(-0.063)#96 | 4.4%(+1.64)#4,976 |
| 97. | North Grosvenor Dale | 6.0% | 6.1%(-0.102)#97 | 4.4%(+1.61)#5,014 |
| 98. | Norwalk | 6.0% | 6.1%(-0.125)#98 | 4.4%(+1.58)#5,047 |
| 99. | Windsor Locks | 5.9% | 6.1%(-0.233)#99 | 4.4%(+1.47)#5,168 |
| 100. | North Haven | 5.9% | 6.1%(-0.256)#100 | 4.4%(+1.45)#5,221 |
Common Questions
What are the Top 10 Cities with the Highest Percentage of Population with a Degree in Literature and Languages in Connecticut?
Top 10 Cities with the Highest Percentage of Population with a Degree in Literature and Languages in Connecticut are:
#1
33.3%
#2
21.3%
#3
17.3%
#4
15.7%
#5
15.5%
#6
13.8%
#7
13.7%
#8
13.7%
#9
12.5%
#10
11.9%
What city has the Highest Percentage of Population with a Degree in Literature and Languages in Connecticut?
Mashantucket has the Highest Percentage of Population with a Degree in Literature and Languages in Connecticut with 33.3%.
What is the Percentage of Population with a Degree in Literature and Languages in the State of Connecticut?
Percentage of Population with a Degree in Literature and Languages in Connecticut is 6.1%.
What is the Percentage of Population with a Degree in Literature and Languages in the United States?
Percentage of Population with a Degree in Literature and Languages in the United States is 4.4%.