Cities with the Highest Percentage of Population with a Degree in Literature and Languages in Pennsylvania
RELATED REPORTS & OPTIONS
Literature and Languages
Pennsylvania
Compare Cities
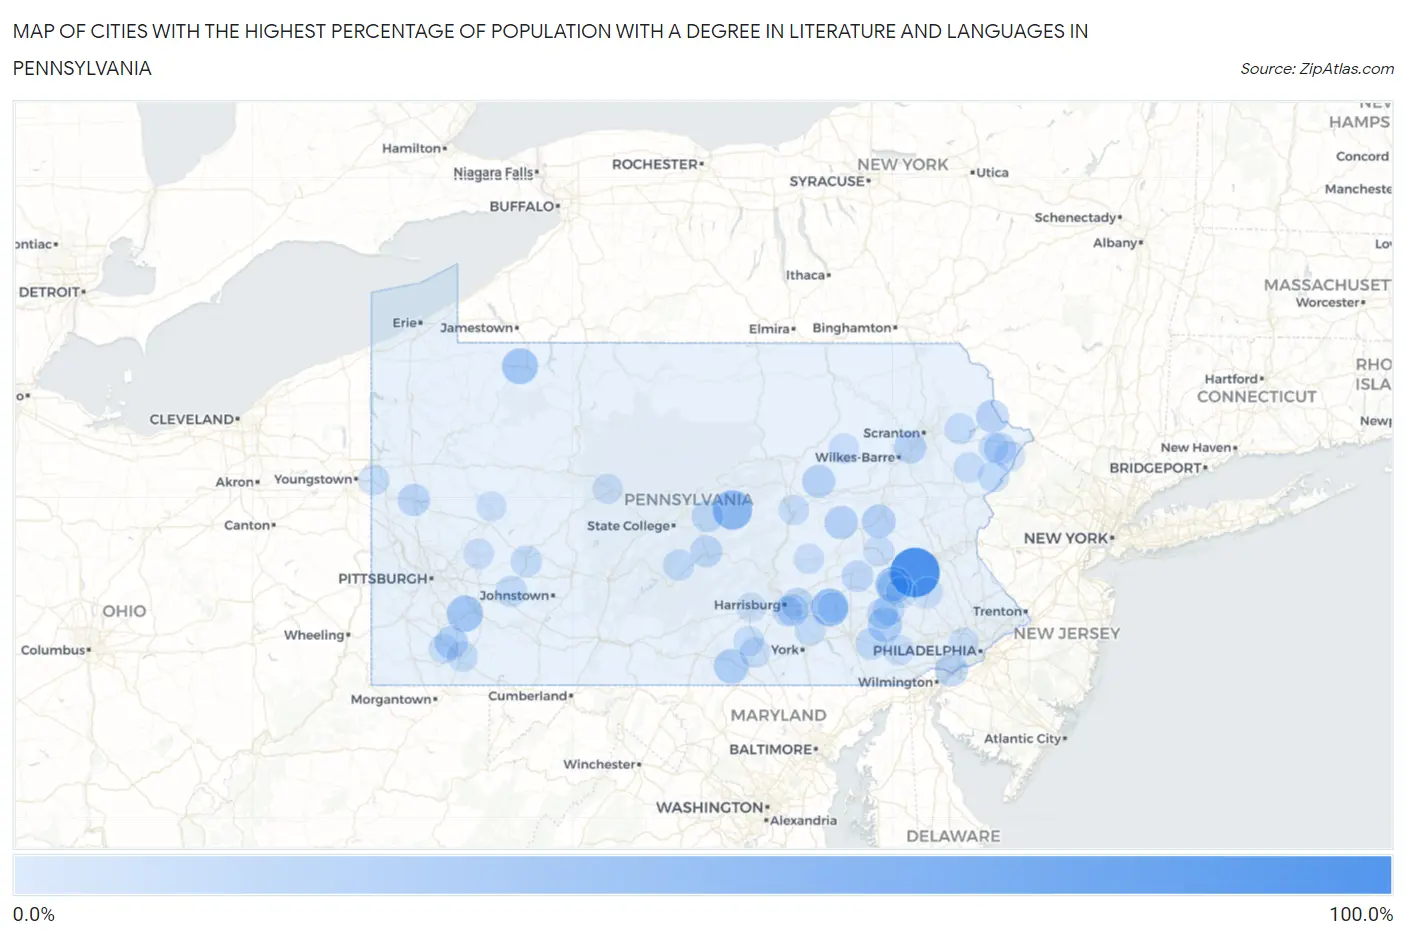
Map of Cities with the Highest Percentage of Population with a Degree in Literature and Languages in Pennsylvania
0.0%
100.0%
Cities with the Highest Percentage of Population with a Degree in Literature and Languages in Pennsylvania
| City | % Graduates | vs State | vs National | |
| 1. | Bowers | 100.0% | 4.3%(+95.7)#1 | 4.4%(+95.6)#13 |
| 2. | Glasgow Borough | 85.7% | 4.3%(+81.4)#2 | 4.4%(+81.3)#40 |
| 3. | Woodward | 52.9% | 4.3%(+48.7)#3 | 4.4%(+48.5)#74 |
| 4. | Clintonville Borough | 51.4% | 4.3%(+47.1)#4 | 4.4%(+47.0)#81 |
| 5. | Timber Hills | 46.0% | 4.3%(+41.7)#5 | 4.4%(+41.6)#115 |
| 6. | Karns City Borough | 42.9% | 4.3%(+38.6)#6 | 4.4%(+38.4)#134 |
| 7. | South Temple | 40.6% | 4.3%(+36.3)#7 | 4.4%(+36.2)#147 |
| 8. | Wyano | 39.1% | 4.3%(+34.8)#8 | 4.4%(+34.7)#165 |
| 9. | Starbrick | 37.9% | 4.3%(+33.6)#9 | 4.4%(+33.5)#175 |
| 10. | Seven Springs Borough | 36.4% | 4.3%(+32.1)#10 | 4.4%(+32.0)#194 |
| 11. | New Baltimore Borough | 33.3% | 4.3%(+29.0)#11 | 4.4%(+28.9)#240 |
| 12. | Austin Borough | 32.0% | 4.3%(+27.7)#12 | 4.4%(+27.6)#266 |
| 13. | Orrtanna | 31.8% | 4.3%(+27.5)#13 | 4.4%(+27.4)#275 |
| 14. | Schellsburg Borough | 31.7% | 4.3%(+27.4)#14 | 4.4%(+27.3)#277 |
| 15. | Goodville | 30.2% | 4.3%(+25.9)#15 | 4.4%(+25.8)#295 |
| 16. | Grier City | 27.5% | 4.3%(+23.2)#16 | 4.4%(+23.0)#364 |
| 17. | Wilburton Number One | 26.2% | 4.3%(+21.9)#17 | 4.4%(+21.8)#398 |
| 18. | Platea Borough | 26.1% | 4.3%(+21.8)#18 | 4.4%(+21.7)#399 |
| 19. | Orangeville Borough | 25.8% | 4.3%(+21.6)#19 | 4.4%(+21.4)#407 |
| 20. | Gilberton Borough | 25.6% | 4.3%(+21.3)#20 | 4.4%(+21.2)#410 |
| 21. | Rowes Run | 25.0% | 4.3%(+20.7)#21 | 4.4%(+20.6)#426 |
| 22. | Jerseytown | 25.0% | 4.3%(+20.7)#22 | 4.4%(+20.6)#432 |
| 23. | Linwood | 24.6% | 4.3%(+20.3)#23 | 4.4%(+20.2)#459 |
| 24. | Fawn Lake Forest | 24.5% | 4.3%(+20.2)#24 | 4.4%(+20.1)#463 |
| 25. | Browntown | 23.4% | 4.3%(+19.1)#25 | 4.4%(+19.0)#493 |
| 26. | Orrstown Borough | 22.2% | 4.3%(+17.9)#26 | 4.4%(+17.8)#527 |
| 27. | Lake Arthur Estates | 22.0% | 4.3%(+17.7)#27 | 4.4%(+17.5)#543 |
| 28. | Halifax Borough | 21.4% | 4.3%(+17.1)#28 | 4.4%(+17.0)#563 |
| 29. | Conashaugh Lakes | 21.0% | 4.3%(+16.7)#29 | 4.4%(+16.6)#591 |
| 30. | Enon Valley Borough | 20.8% | 4.3%(+16.5)#30 | 4.4%(+16.4)#599 |
| 31. | Rutherford | 20.8% | 4.3%(+16.5)#31 | 4.4%(+16.4)#602 |
| 32. | Highland Park | 20.7% | 4.3%(+16.4)#32 | 4.4%(+16.3)#605 |
| 33. | Bressler | 20.4% | 4.3%(+16.1)#33 | 4.4%(+16.0)#619 |
| 34. | Spring Mills | 20.2% | 4.3%(+15.9)#34 | 4.4%(+15.8)#628 |
| 35. | Seven Valleys Borough | 20.0% | 4.3%(+15.7)#35 | 4.4%(+15.6)#634 |
| 36. | Lenhartsville Borough | 20.0% | 4.3%(+15.7)#36 | 4.4%(+15.6)#646 |
| 37. | Paradise | 19.9% | 4.3%(+15.6)#37 | 4.4%(+15.5)#659 |
| 38. | Rehrersburg | 19.6% | 4.3%(+15.4)#38 | 4.4%(+15.2)#672 |
| 39. | Coal Center Borough | 19.2% | 4.3%(+14.9)#39 | 4.4%(+14.8)#693 |
| 40. | Wheatland Borough | 19.0% | 4.3%(+14.7)#40 | 4.4%(+14.6)#709 |
| 41. | Alleghenyville | 18.9% | 4.3%(+14.6)#41 | 4.4%(+14.5)#717 |
| 42. | Lucerne Mines | 18.4% | 4.3%(+14.1)#42 | 4.4%(+14.0)#752 |
| 43. | Saw Creek | 18.4% | 4.3%(+14.1)#43 | 4.4%(+14.0)#756 |
| 44. | Bowmansville | 18.2% | 4.3%(+13.9)#44 | 4.4%(+13.8)#767 |
| 45. | Allensville | 18.2% | 4.3%(+13.9)#45 | 4.4%(+13.8)#773 |
| 46. | Millwood | 18.2% | 4.3%(+13.9)#46 | 4.4%(+13.8)#774 |
| 47. | Manorville Borough | 18.0% | 4.3%(+13.7)#47 | 4.4%(+13.6)#792 |
| 48. | Eau Claire Borough | 17.9% | 4.3%(+13.6)#48 | 4.4%(+13.4)#804 |
| 49. | Stony Creek Mills | 16.9% | 4.3%(+12.6)#49 | 4.4%(+12.5)#868 |
| 50. | Petersburg Borough | 16.7% | 4.3%(+12.4)#50 | 4.4%(+12.3)#886 |
| 51. | Hopewell Borough | 16.7% | 4.3%(+12.4)#51 | 4.4%(+12.3)#900 |
| 52. | Oliver | 16.6% | 4.3%(+12.3)#52 | 4.4%(+12.2)#911 |
| 53. | Bainbridge | 16.5% | 4.3%(+12.2)#53 | 4.4%(+12.1)#919 |
| 54. | Brackenridge Borough | 16.5% | 4.3%(+12.2)#54 | 4.4%(+12.1)#920 |
| 55. | The Hideout | 16.5% | 4.3%(+12.2)#55 | 4.4%(+12.1)#923 |
| 56. | Export Borough | 16.3% | 4.3%(+12.0)#56 | 4.4%(+11.9)#930 |
| 57. | New Bedford | 15.9% | 4.3%(+11.6)#57 | 4.4%(+11.5)#959 |
| 58. | Houston Borough | 15.8% | 4.3%(+11.5)#58 | 4.4%(+11.4)#964 |
| 59. | Pomeroy | 15.7% | 4.3%(+11.4)#59 | 4.4%(+11.3)#980 |
| 60. | Mountainhome | 15.6% | 4.3%(+11.4)#60 | 4.4%(+11.2)#987 |
| 61. | New Berlinville | 15.6% | 4.3%(+11.3)#61 | 4.4%(+11.2)#988 |
| 62. | Deer Lake | 15.5% | 4.3%(+11.2)#62 | 4.4%(+11.1)#1,002 |
| 63. | Muhlenberg Park | 15.5% | 4.3%(+11.2)#63 | 4.4%(+11.1)#1,003 |
| 64. | Heidlersburg | 15.4% | 4.3%(+11.1)#64 | 4.4%(+11.0)#1,014 |
| 65. | Glassport Borough | 15.3% | 4.3%(+11.0)#65 | 4.4%(+10.9)#1,026 |
| 66. | Idaville | 15.0% | 4.3%(+10.7)#66 | 4.4%(+10.6)#1,063 |
| 67. | New Hope Borough | 14.9% | 4.3%(+10.6)#67 | 4.4%(+10.5)#1,072 |
| 68. | Kapp Heights | 14.7% | 4.3%(+10.4)#68 | 4.4%(+10.3)#1,086 |
| 69. | South Fork Borough | 14.6% | 4.3%(+10.3)#69 | 4.4%(+10.2)#1,106 |
| 70. | New Market | 14.5% | 4.3%(+10.2)#70 | 4.4%(+10.0)#1,118 |
| 71. | Wiconsico | 14.3% | 4.3%(+10.00)#71 | 4.4%(+9.88)#1,145 |
| 72. | Jamison City | 14.3% | 4.3%(+10.00)#72 | 4.4%(+9.88)#1,160 |
| 73. | Newry Borough | 14.3% | 4.3%(+10.00)#73 | 4.4%(+9.88)#1,165 |
| 74. | Union Dale Borough | 14.3% | 4.3%(+10.00)#74 | 4.4%(+9.88)#1,168 |
| 75. | Pleasant View | 14.0% | 4.3%(+9.71)#75 | 4.4%(+9.59)#1,220 |
| 76. | Wampum Borough | 14.0% | 4.3%(+9.71)#76 | 4.4%(+9.59)#1,221 |
| 77. | Sharpsburg Borough | 13.9% | 4.3%(+9.65)#77 | 4.4%(+9.53)#1,231 |
| 78. | Mount Gretna Heights | 13.9% | 4.3%(+9.63)#78 | 4.4%(+9.51)#1,236 |
| 79. | Birchwood Lakes | 13.8% | 4.3%(+9.50)#79 | 4.4%(+9.38)#1,255 |
| 80. | Plymptonville | 13.8% | 4.3%(+9.50)#80 | 4.4%(+9.38)#1,257 |
| 81. | Milford Borough | 13.8% | 4.3%(+9.49)#81 | 4.4%(+9.37)#1,267 |
| 82. | Ligonier Borough | 13.8% | 4.3%(+9.47)#82 | 4.4%(+9.35)#1,270 |
| 83. | Laurel Mountain Borough | 13.6% | 4.3%(+9.35)#83 | 4.4%(+9.23)#1,293 |
| 84. | Liverpool Borough | 13.5% | 4.3%(+9.20)#84 | 4.4%(+9.08)#1,315 |
| 85. | Pleasantville Borough Bedford County | 13.3% | 4.3%(+9.04)#85 | 4.4%(+8.92)#1,355 |
| 86. | Stoneboro Borough | 13.2% | 4.3%(+8.87)#86 | 4.4%(+8.75)#1,371 |
| 87. | Hemlock Farms | 13.1% | 4.3%(+8.81)#87 | 4.4%(+8.69)#1,376 |
| 88. | Loretto Borough | 13.1% | 4.3%(+8.79)#88 | 4.4%(+8.67)#1,377 |
| 89. | Republic | 13.0% | 4.3%(+8.72)#89 | 4.4%(+8.60)#1,384 |
| 90. | Trafford Borough | 12.7% | 4.3%(+8.45)#90 | 4.4%(+8.33)#1,441 |
| 91. | Haverford College | 12.7% | 4.3%(+8.40)#91 | 4.4%(+8.28)#1,449 |
| 92. | Hayti | 12.6% | 4.3%(+8.35)#92 | 4.4%(+8.23)#1,455 |
| 93. | Eldred Borough | 12.5% | 4.3%(+8.21)#93 | 4.4%(+8.09)#1,480 |
| 94. | Garrett Borough | 12.5% | 4.3%(+8.21)#94 | 4.4%(+8.09)#1,482 |
| 95. | Templeton | 12.5% | 4.3%(+8.21)#95 | 4.4%(+8.09)#1,488 |
| 96. | Robeson Extension | 12.5% | 4.3%(+8.21)#96 | 4.4%(+8.09)#1,494 |
| 97. | Schlusser | 12.3% | 4.3%(+8.00)#97 | 4.4%(+7.88)#1,525 |
| 98. | Lewisburg Borough | 12.3% | 4.3%(+7.98)#98 | 4.4%(+7.86)#1,528 |
| 99. | North Bend | 12.2% | 4.3%(+7.91)#99 | 4.4%(+7.79)#1,543 |
| 100. | Rose Valley Borough | 12.1% | 4.3%(+7.81)#100 | 4.4%(+7.69)#1,554 |
Common Questions
What are the Top 10 Cities with the Highest Percentage of Population with a Degree in Literature and Languages in Pennsylvania?
Top 10 Cities with the Highest Percentage of Population with a Degree in Literature and Languages in Pennsylvania are:
#1
100.0%
#2
52.9%
#3
46.0%
#4
40.6%
#5
39.1%
#6
37.9%
#7
31.8%
#8
30.2%
#9
27.5%
#10
26.2%
What city has the Highest Percentage of Population with a Degree in Literature and Languages in Pennsylvania?
Bowers has the Highest Percentage of Population with a Degree in Literature and Languages in Pennsylvania with 100.0%.
What is the Percentage of Population with a Degree in Literature and Languages in the State of Pennsylvania?
Percentage of Population with a Degree in Literature and Languages in Pennsylvania is 4.3%.
What is the Percentage of Population with a Degree in Literature and Languages in the United States?
Percentage of Population with a Degree in Literature and Languages in the United States is 4.4%.