Cities with the Highest Percentage of Population with a Degree in Literature and Languages in Vermont
RELATED REPORTS & OPTIONS
Literature and Languages
Vermont
Compare Cities
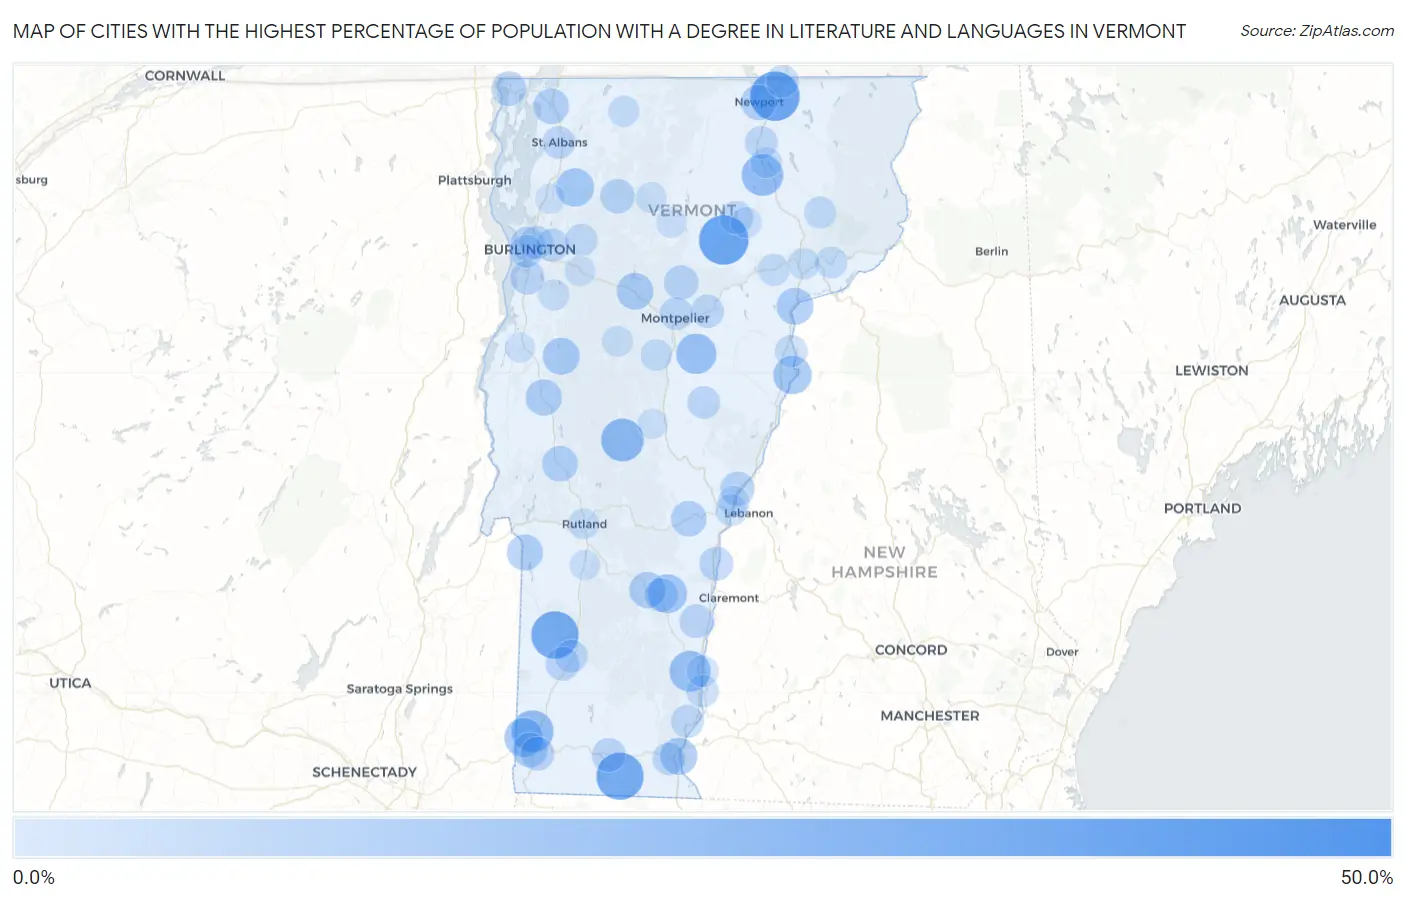
Map of Cities with the Highest Percentage of Population with a Degree in Literature and Languages in Vermont
0.0%
50.0%
Cities with the Highest Percentage of Population with a Degree in Literature and Languages in Vermont
| City | % Graduates | vs State | vs National | |
| 1. | East Charlotte | 48.6% | 8.2%(+40.5)#1 | 4.4%(+44.2)#106 |
| 2. | Hardwick | 37.2% | 8.2%(+29.0)#2 | 4.4%(+32.8)#182 |
| 3. | Derby Center | 37.0% | 8.2%(+28.9)#3 | 4.4%(+32.6)#185 |
| 4. | Dorset | 33.4% | 8.2%(+25.3)#4 | 4.4%(+29.0)#225 |
| 5. | Jacksonville | 33.3% | 8.2%(+25.2)#5 | 4.4%(+28.9)#238 |
| 6. | Chittenden | 30.0% | 8.2%(+21.8)#6 | 4.4%(+25.6)#301 |
| 7. | Sutton | 30.0% | 8.2%(+21.8)#7 | 4.4%(+25.6)#302 |
| 8. | Wardsboro | 26.3% | 8.2%(+18.2)#8 | 4.4%(+21.9)#394 |
| 9. | West Woodstock | 26.1% | 8.2%(+17.9)#9 | 4.4%(+21.7)#400 |
| 10. | Rochester | 25.2% | 8.2%(+17.1)#10 | 4.4%(+20.8)#418 |
| 11. | South Shaftsbury | 23.8% | 8.2%(+15.6)#11 | 4.4%(+19.4)#476 |
| 12. | Stratton Mountain | 23.8% | 8.2%(+15.6)#12 | 4.4%(+19.4)#480 |
| 13. | Glover | 23.2% | 8.2%(+15.0)#13 | 4.4%(+18.8)#499 |
| 14. | Saxtons River | 22.0% | 8.2%(+13.9)#14 | 4.4%(+17.6)#542 |
| 15. | West Dummerston | 21.4% | 8.2%(+13.3)#15 | 4.4%(+17.0)#572 |
| 16. | Graniteville | 21.0% | 8.2%(+12.9)#16 | 4.4%(+16.6)#592 |
| 17. | North Hyde Park | 20.8% | 8.2%(+12.6)#17 | 4.4%(+16.4)#604 |
| 18. | Pawlet | 20.0% | 8.2%(+11.8)#18 | 4.4%(+15.6)#639 |
| 19. | Cavendish | 18.8% | 8.2%(+10.6)#19 | 4.4%(+14.3)#729 |
| 20. | North Bennington | 18.7% | 8.2%(+10.5)#20 | 4.4%(+14.3)#734 |
| 21. | Whitingham | 18.2% | 8.2%(+10.0)#21 | 4.4%(+13.8)#782 |
| 22. | Newbury | 17.8% | 8.2%(+9.64)#22 | 4.4%(+13.4)#811 |
| 23. | East Poultney | 17.7% | 8.2%(+9.56)#23 | 4.4%(+13.3)#818 |
| 24. | Harmonyville | 17.6% | 8.2%(+9.48)#24 | 4.4%(+13.2)#824 |
| 25. | Weston | 17.6% | 8.2%(+9.48)#25 | 4.4%(+13.2)#825 |
| 26. | Fairfax | 17.3% | 8.2%(+9.18)#26 | 4.4%(+12.9)#839 |
| 27. | Brattleboro | 15.4% | 8.2%(+7.24)#27 | 4.4%(+11.0)#1,011 |
| 28. | Bristol | 15.2% | 8.2%(+7.07)#28 | 4.4%(+10.8)#1,037 |
| 29. | Barnet | 15.0% | 8.2%(+6.84)#29 | 4.4%(+10.6)#1,064 |
| 30. | Waterbury | 14.6% | 8.2%(+6.48)#30 | 4.4%(+10.2)#1,098 |
| 31. | North Pownal | 14.5% | 8.2%(+6.29)#31 | 4.4%(+10.0)#1,119 |
| 32. | Middlebury | 14.1% | 8.2%(+5.94)#32 | 4.4%(+9.70)#1,196 |
| 33. | Ludlow | 14.1% | 8.2%(+5.93)#33 | 4.4%(+9.69)#1,200 |
| 34. | Poultney | 13.8% | 8.2%(+5.63)#34 | 4.4%(+9.38)#1,256 |
| 35. | Brandon | 13.0% | 8.2%(+4.86)#35 | 4.4%(+8.61)#1,382 |
| 36. | Woodstock | 12.9% | 8.2%(+4.76)#36 | 4.4%(+8.51)#1,402 |
| 37. | Underhill Flats | 12.8% | 8.2%(+4.63)#37 | 4.4%(+8.38)#1,429 |
| 38. | Newport | 12.8% | 8.2%(+4.63)#38 | 4.4%(+8.38)#1,430 |
| 39. | Swanton | 12.7% | 8.2%(+4.55)#39 | 4.4%(+8.30)#1,446 |
| 40. | South Hero | 12.0% | 8.2%(+3.84)#40 | 4.4%(+7.59)#1,571 |
| 41. | Grafton | 11.8% | 8.2%(+3.60)#41 | 4.4%(+7.36)#1,624 |
| 42. | Old Bennington | 11.7% | 8.2%(+3.49)#42 | 4.4%(+7.24)#1,646 |
| 43. | Alburgh | 11.5% | 8.2%(+3.29)#43 | 4.4%(+7.05)#1,676 |
| 44. | Jeffersonville | 11.2% | 8.2%(+3.00)#44 | 4.4%(+6.76)#1,749 |
| 45. | Danby | 11.1% | 8.2%(+2.95)#45 | 4.4%(+6.70)#1,792 |
| 46. | Norwich | 10.9% | 8.2%(+2.70)#46 | 4.4%(+6.46)#1,860 |
| 47. | Worcester | 10.8% | 8.2%(+2.65)#47 | 4.4%(+6.40)#1,880 |
| 48. | Shelburne | 10.6% | 8.2%(+2.42)#48 | 4.4%(+6.18)#1,949 |
| 49. | Burlington | 10.2% | 8.2%(+2.08)#49 | 4.4%(+5.83)#2,063 |
| 50. | Windsor | 10.1% | 8.2%(+1.93)#50 | 4.4%(+5.68)#2,116 |
| 51. | Bennington | 10.0% | 8.2%(+1.85)#51 | 4.4%(+5.60)#2,137 |
| 52. | Wilmington | 10.0% | 8.2%(+1.84)#52 | 4.4%(+5.59)#2,155 |
| 53. | Manchester | 9.9% | 8.2%(+1.77)#53 | 4.4%(+5.53)#2,178 |
| 54. | Springfield | 9.9% | 8.2%(+1.69)#54 | 4.4%(+5.45)#2,198 |
| 55. | Proctorsville | 9.8% | 8.2%(+1.64)#55 | 4.4%(+5.39)#2,216 |
| 56. | Winooski | 9.3% | 8.2%(+1.16)#56 | 4.4%(+4.91)#2,409 |
| 57. | Greensboro | 9.1% | 8.2%(+0.927)#57 | 4.4%(+4.68)#2,545 |
| 58. | Essex Junction | 8.8% | 8.2%(+0.667)#58 | 4.4%(+4.42)#2,681 |
| 59. | Plainfield | 8.8% | 8.2%(+0.628)#59 | 4.4%(+4.38)#2,696 |
| 60. | Montpelier | 8.8% | 8.2%(+0.625)#60 | 4.4%(+4.38)#2,697 |
| 61. | Manchester Center | 8.5% | 8.2%(+0.325)#61 | 4.4%(+4.08)#2,880 |
| 62. | Putney | 8.4% | 8.2%(+0.228)#62 | 4.4%(+3.98)#2,920 |
| 63. | Derby Line | 8.3% | 8.2%(+0.170)#63 | 4.4%(+3.92)#2,961 |
| 64. | Orleans | 8.2% | 8.2%(+0.064)#64 | 4.4%(+3.82)#3,031 |
| 65. | South Burlington | 8.2% | 8.2%(+0.056)#65 | 4.4%(+3.81)#3,040 |
| 66. | St Albans | 8.1% | 8.2%(-0.049)#66 | 4.4%(+3.70)#3,100 |
| 67. | West Brattleboro | 8.1% | 8.2%(-0.094)#67 | 4.4%(+3.66)#3,134 |
| 68. | Chelsea | 8.0% | 8.2%(-0.117)#68 | 4.4%(+3.64)#3,150 |
| 69. | Algiers | 7.8% | 8.2%(-0.320)#69 | 4.4%(+3.43)#3,264 |
| 70. | Westminster | 7.8% | 8.2%(-0.386)#70 | 4.4%(+3.37)#3,306 |
| 71. | Jericho | 7.7% | 8.2%(-0.431)#71 | 4.4%(+3.32)#3,329 |
| 72. | Wells River | 7.5% | 8.2%(-0.663)#72 | 4.4%(+3.09)#3,509 |
| 73. | Proctor | 7.2% | 8.2%(-0.953)#73 | 4.4%(+2.80)#3,731 |
| 74. | Concord | 7.0% | 8.2%(-1.19)#74 | 4.4%(+2.57)#3,963 |
| 75. | Huntington | 6.9% | 8.2%(-1.23)#75 | 4.4%(+2.52)#4,012 |
| 76. | White River Junction | 6.9% | 8.2%(-1.24)#76 | 4.4%(+2.51)#4,020 |
| 77. | East Burke | 6.8% | 8.2%(-1.31)#77 | 4.4%(+2.44)#4,098 |
| 78. | Danville | 6.8% | 8.2%(-1.38)#78 | 4.4%(+2.37)#4,165 |
| 79. | Bellows Falls | 6.5% | 8.2%(-1.63)#79 | 4.4%(+2.13)#4,399 |
| 80. | Northfield | 6.4% | 8.2%(-1.79)#80 | 4.4%(+1.96)#4,581 |
| 81. | Castleton Four Corners | 6.3% | 8.2%(-1.85)#81 | 4.4%(+1.91)#4,639 |
| 82. | St Johnsbury | 6.1% | 8.2%(-2.04)#82 | 4.4%(+1.72)#4,872 |
| 83. | Enosburg Falls | 6.0% | 8.2%(-2.16)#83 | 4.4%(+1.59)#5,036 |
| 84. | Barton | 5.7% | 8.2%(-2.45)#84 | 4.4%(+1.30)#5,385 |
| 85. | Stamford | 5.6% | 8.2%(-2.57)#85 | 4.4%(+1.18)#5,563 |
| 86. | Waitsfield | 5.4% | 8.2%(-2.77)#86 | 4.4%(+0.980)#5,862 |
| 87. | Wilder | 5.3% | 8.2%(-2.84)#87 | 4.4%(+0.910)#5,970 |
| 88. | Rutland | 5.2% | 8.2%(-2.96)#88 | 4.4%(+0.796)#6,171 |
| 89. | Hinesburg | 5.1% | 8.2%(-3.04)#89 | 4.4%(+0.719)#6,306 |
| 90. | Greensboro Bend | 5.1% | 8.2%(-3.08)#90 | 4.4%(+0.675)#6,388 |
| 91. | Johnson | 5.1% | 8.2%(-3.09)#91 | 4.4%(+0.659)#6,415 |
| 92. | Morrisville | 4.7% | 8.2%(-3.47)#92 | 4.4%(+0.280)#7,122 |
| 93. | Lincoln | 4.6% | 8.2%(-3.57)#93 | 4.4%(+0.188)#7,280 |
| 94. | Richmond | 4.6% | 8.2%(-3.60)#94 | 4.4%(+0.157)#7,333 |
| 95. | Middletown Springs | 4.5% | 8.2%(-3.62)#95 | 4.4%(+0.136)#7,394 |
| 96. | Wallingford | 4.3% | 8.2%(-3.87)#96 | 4.4%(-0.118)#7,890 |
| 97. | Townshend | 4.1% | 8.2%(-4.11)#97 | 4.4%(-0.356)#8,436 |
| 98. | Randolph | 3.8% | 8.2%(-4.33)#98 | 4.4%(-0.575)#8,968 |
| 99. | Milton | 3.8% | 8.2%(-4.33)#99 | 4.4%(-0.575)#8,969 |
| 100. | Vergennes | 3.7% | 8.2%(-4.42)#100 | 4.4%(-0.662)#9,137 |
1
2Common Questions
What are the Top 10 Cities with the Highest Percentage of Population with a Degree in Literature and Languages in Vermont?
Top 10 Cities with the Highest Percentage of Population with a Degree in Literature and Languages in Vermont are:
#1
37.2%
#2
37.0%
#3
33.4%
#4
33.3%
#5
25.2%
#6
23.8%
#7
23.2%
#8
22.0%
#9
21.0%
#10
18.8%
What city has the Highest Percentage of Population with a Degree in Literature and Languages in Vermont?
Hardwick has the Highest Percentage of Population with a Degree in Literature and Languages in Vermont with 37.2%.
What is the Percentage of Population with a Degree in Literature and Languages in the State of Vermont?
Percentage of Population with a Degree in Literature and Languages in Vermont is 8.2%.
What is the Percentage of Population with a Degree in Literature and Languages in the United States?
Percentage of Population with a Degree in Literature and Languages in the United States is 4.4%.