Cities with the Highest Percentage of Population with a Degree in Literature and Languages in Tennessee
RELATED REPORTS & OPTIONS
Literature and Languages
Tennessee
Compare Cities
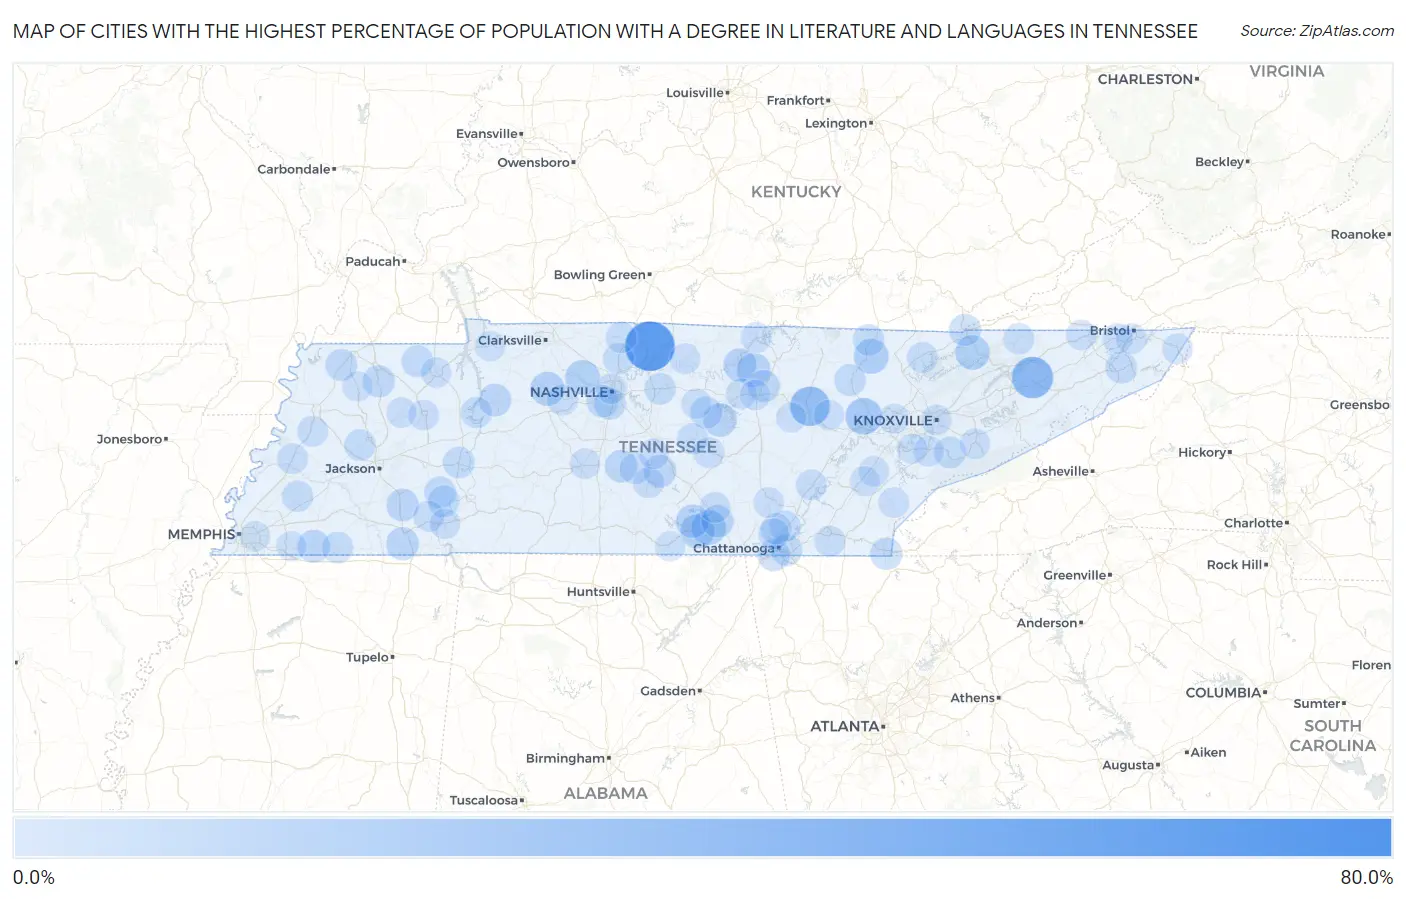
Map of Cities with the Highest Percentage of Population with a Degree in Literature and Languages in Tennessee
0.0%
80.0%
Cities with the Highest Percentage of Population with a Degree in Literature and Languages in Tennessee
| City | % Graduates | vs State | vs National | |
| 1. | Russellville | 61.0% | 3.6%(+57.4)#1 | 4.4%(+56.6)#57 |
| 2. | Graball | 52.6% | 3.6%(+49.0)#2 | 4.4%(+48.2)#76 |
| 3. | Taft | 38.9% | 3.6%(+35.3)#3 | 4.4%(+34.5)#168 |
| 4. | Bulls Gap | 31.9% | 3.6%(+28.2)#4 | 4.4%(+27.4)#271 |
| 5. | Bowman | 27.6% | 3.6%(+24.0)#5 | 4.4%(+23.2)#361 |
| 6. | Hickman | 21.1% | 3.6%(+17.4)#6 | 4.4%(+16.6)#589 |
| 7. | Oakdale | 20.0% | 3.6%(+16.4)#7 | 4.4%(+15.6)#642 |
| 8. | Huntsville | 16.1% | 3.6%(+12.5)#8 | 4.4%(+11.7)#947 |
| 9. | Sewanee | 15.3% | 3.6%(+11.7)#9 | 4.4%(+10.9)#1,025 |
| 10. | Ashland City | 15.1% | 3.6%(+11.5)#10 | 4.4%(+10.7)#1,045 |
| 11. | New Tazewell | 15.1% | 3.6%(+11.4)#11 | 4.4%(+10.6)#1,052 |
| 12. | Cowan | 14.2% | 3.6%(+10.6)#12 | 4.4%(+9.76)#1,184 |
| 13. | Delano | 14.1% | 3.6%(+10.5)#13 | 4.4%(+9.67)#1,204 |
| 14. | Charlotte | 13.8% | 3.6%(+10.2)#14 | 4.4%(+9.38)#1,254 |
| 15. | Dodson Branch | 13.4% | 3.6%(+9.80)#15 | 4.4%(+9.00)#1,329 |
| 16. | Smithville | 12.4% | 3.6%(+8.78)#16 | 4.4%(+7.99)#1,507 |
| 17. | Decherd | 12.0% | 3.6%(+8.44)#17 | 4.4%(+7.64)#1,561 |
| 18. | Gainesboro | 11.7% | 3.6%(+8.10)#18 | 4.4%(+7.30)#1,630 |
| 19. | Ramer | 11.1% | 3.6%(+7.50)#19 | 4.4%(+6.70)#1,774 |
| 20. | Moscow | 10.7% | 3.6%(+7.10)#20 | 4.4%(+6.30)#1,905 |
| 21. | Bell Buckle | 10.5% | 3.6%(+6.91)#21 | 4.4%(+6.12)#1,963 |
| 22. | Chapel Hill | 10.4% | 3.6%(+6.77)#22 | 4.4%(+5.97)#2,015 |
| 23. | Finger | 10.3% | 3.6%(+6.73)#23 | 4.4%(+5.94)#2,026 |
| 24. | Waverly | 10.2% | 3.6%(+6.59)#24 | 4.4%(+5.79)#2,081 |
| 25. | Monteagle | 10.2% | 3.6%(+6.54)#25 | 4.4%(+5.74)#2,093 |
| 26. | Lookout Mountain | 9.5% | 3.6%(+5.89)#26 | 4.4%(+5.09)#2,347 |
| 27. | Sharon | 9.4% | 3.6%(+5.81)#27 | 4.4%(+5.01)#2,378 |
| 28. | Algood | 9.3% | 3.6%(+5.70)#28 | 4.4%(+4.91)#2,414 |
| 29. | Belle Meade | 9.1% | 3.6%(+5.51)#29 | 4.4%(+4.72)#2,503 |
| 30. | Dowelltown | 9.1% | 3.6%(+5.48)#30 | 4.4%(+4.68)#2,529 |
| 31. | Troy | 9.0% | 3.6%(+5.34)#31 | 4.4%(+4.55)#2,613 |
| 32. | Copperhill | 8.9% | 3.6%(+5.32)#32 | 4.4%(+4.52)#2,629 |
| 33. | Hampton | 8.9% | 3.6%(+5.29)#33 | 4.4%(+4.49)#2,648 |
| 34. | Cumberland Gap | 8.8% | 3.6%(+5.16)#34 | 4.4%(+4.36)#2,705 |
| 35. | Ridgeside | 8.6% | 3.6%(+5.00)#35 | 4.4%(+4.20)#2,800 |
| 36. | Central | 8.6% | 3.6%(+4.96)#36 | 4.4%(+4.16)#2,816 |
| 37. | Sardis | 8.6% | 3.6%(+4.96)#37 | 4.4%(+4.16)#2,819 |
| 38. | Walland | 8.3% | 3.6%(+4.72)#38 | 4.4%(+3.92)#2,968 |
| 39. | Cottage Grove | 8.3% | 3.6%(+4.72)#39 | 4.4%(+3.92)#2,987 |
| 40. | Saltillo | 8.2% | 3.6%(+4.61)#40 | 4.4%(+3.81)#3,037 |
| 41. | Oak Hill | 8.2% | 3.6%(+4.59)#41 | 4.4%(+3.80)#3,048 |
| 42. | Sunbright | 8.1% | 3.6%(+4.50)#42 | 4.4%(+3.70)#3,108 |
| 43. | Parsons | 7.9% | 3.6%(+4.34)#43 | 4.4%(+3.54)#3,201 |
| 44. | Lebanon | 7.9% | 3.6%(+4.30)#44 | 4.4%(+3.51)#3,221 |
| 45. | Oneida | 7.8% | 3.6%(+4.22)#45 | 4.4%(+3.42)#3,276 |
| 46. | Grand Junction | 7.7% | 3.6%(+4.08)#46 | 4.4%(+3.28)#3,364 |
| 47. | Gadsden | 7.7% | 3.6%(+4.08)#47 | 4.4%(+3.28)#3,366 |
| 48. | New Johnsonville | 7.2% | 3.6%(+3.63)#48 | 4.4%(+2.84)#3,699 |
| 49. | Millersville | 7.2% | 3.6%(+3.57)#49 | 4.4%(+2.77)#3,755 |
| 50. | Mason | 7.1% | 3.6%(+3.47)#50 | 4.4%(+2.67)#3,869 |
| 51. | Falling Water | 6.9% | 3.6%(+3.24)#51 | 4.4%(+2.45)#4,092 |
| 52. | Woodbury | 6.7% | 3.6%(+3.13)#52 | 4.4%(+2.33)#4,200 |
| 53. | Fincastle | 6.7% | 3.6%(+3.05)#53 | 4.4%(+2.26)#4,258 |
| 54. | Fairmount | 6.6% | 3.6%(+3.02)#54 | 4.4%(+2.22)#4,306 |
| 55. | White Bluff | 6.6% | 3.6%(+3.00)#55 | 4.4%(+2.21)#4,317 |
| 56. | Unionville | 6.6% | 3.6%(+2.99)#56 | 4.4%(+2.19)#4,335 |
| 57. | Sneedville | 6.6% | 3.6%(+2.97)#57 | 4.4%(+2.17)#4,352 |
| 58. | Cross Plains | 6.5% | 3.6%(+2.93)#58 | 4.4%(+2.13)#4,398 |
| 59. | Signal Mountain | 6.5% | 3.6%(+2.91)#59 | 4.4%(+2.11)#4,408 |
| 60. | Wildwood Lake | 6.5% | 3.6%(+2.84)#60 | 4.4%(+2.04)#4,484 |
| 61. | Shelbyville | 6.3% | 3.6%(+2.72)#61 | 4.4%(+1.92)#4,627 |
| 62. | Pelham | 6.3% | 3.6%(+2.70)#62 | 4.4%(+1.91)#4,641 |
| 63. | Halls | 6.2% | 3.6%(+2.59)#63 | 4.4%(+1.80)#4,774 |
| 64. | Henning | 6.2% | 3.6%(+2.56)#64 | 4.4%(+1.76)#4,813 |
| 65. | Dayton | 6.1% | 3.6%(+2.50)#65 | 4.4%(+1.70)#4,902 |
| 66. | Adamsville | 6.1% | 3.6%(+2.47)#66 | 4.4%(+1.67)#4,936 |
| 67. | Centertown | 6.1% | 3.6%(+2.45)#67 | 4.4%(+1.65)#4,966 |
| 68. | Knoxville | 5.8% | 3.6%(+2.23)#68 | 4.4%(+1.44)#5,234 |
| 69. | Celina | 5.8% | 3.6%(+2.23)#69 | 4.4%(+1.43)#5,244 |
| 70. | Hartsville Trousdale County | 5.8% | 3.6%(+2.20)#70 | 4.4%(+1.40)#5,273 |
| 71. | Tellico Plains | 5.7% | 3.6%(+2.13)#71 | 4.4%(+1.33)#5,362 |
| 72. | Baxter | 5.7% | 3.6%(+2.10)#72 | 4.4%(+1.30)#5,380 |
| 73. | Mountain City | 5.6% | 3.6%(+2.04)#73 | 4.4%(+1.24)#5,482 |
| 74. | Christiana | 5.6% | 3.6%(+1.99)#74 | 4.4%(+1.20)#5,551 |
| 75. | Columbia | 5.5% | 3.6%(+1.92)#75 | 4.4%(+1.12)#5,660 |
| 76. | Huntingdon | 5.5% | 3.6%(+1.91)#76 | 4.4%(+1.12)#5,665 |
| 77. | Mount Carmel | 5.4% | 3.6%(+1.75)#77 | 4.4%(+0.948)#5,912 |
| 78. | Dunlap | 5.4% | 3.6%(+1.74)#78 | 4.4%(+0.944)#5,922 |
| 79. | Maryville | 5.3% | 3.6%(+1.71)#79 | 4.4%(+0.910)#5,969 |
| 80. | Bristol | 5.3% | 3.6%(+1.67)#80 | 4.4%(+0.871)#6,029 |
| 81. | Nashville | 5.2% | 3.6%(+1.61)#81 | 4.4%(+0.814)#6,148 |
| 82. | Fairfield Glade | 5.2% | 3.6%(+1.57)#82 | 4.4%(+0.768)#6,230 |
| 83. | Savannah | 5.2% | 3.6%(+1.55)#83 | 4.4%(+0.753)#6,254 |
| 84. | Blountville | 5.2% | 3.6%(+1.54)#84 | 4.4%(+0.742)#6,276 |
| 85. | Cookeville | 5.1% | 3.6%(+1.48)#85 | 4.4%(+0.686)#6,360 |
| 86. | Sweetwater | 5.1% | 3.6%(+1.46)#86 | 4.4%(+0.659)#6,414 |
| 87. | Paris | 5.0% | 3.6%(+1.41)#87 | 4.4%(+0.617)#6,490 |
| 88. | Trezevant | 5.0% | 3.6%(+1.39)#88 | 4.4%(+0.590)#6,536 |
| 89. | Pigeon Forge | 5.0% | 3.6%(+1.38)#89 | 4.4%(+0.580)#6,568 |
| 90. | Alexandria | 4.9% | 3.6%(+1.33)#90 | 4.4%(+0.529)#6,646 |
| 91. | Kenton | 4.9% | 3.6%(+1.27)#91 | 4.4%(+0.468)#6,758 |
| 92. | Oak Ridge | 4.9% | 3.6%(+1.25)#92 | 4.4%(+0.447)#6,801 |
| 93. | Lynchburg | 4.8% | 3.6%(+1.17)#93 | 4.4%(+0.368)#6,944 |
| 94. | Friendsville | 4.7% | 3.6%(+1.09)#94 | 4.4%(+0.296)#7,093 |
| 95. | Dover | 4.7% | 3.6%(+1.08)#95 | 4.4%(+0.278)#7,127 |
| 96. | Memphis | 4.7% | 3.6%(+1.07)#96 | 4.4%(+0.270)#7,142 |
| 97. | Huntland | 4.6% | 3.6%(+1.02)#97 | 4.4%(+0.220)#7,232 |
| 98. | Niota | 4.6% | 3.6%(+1.00)#98 | 4.4%(+0.206)#7,252 |
| 99. | Piperton | 4.6% | 3.6%(+0.963)#99 | 4.4%(+0.165)#7,314 |
| 100. | Pleasant Hill | 4.5% | 3.6%(+0.866)#100 | 4.4%(+0.068)#7,512 |
Common Questions
What are the Top 10 Cities with the Highest Percentage of Population with a Degree in Literature and Languages in Tennessee?
Top 10 Cities with the Highest Percentage of Population with a Degree in Literature and Languages in Tennessee are:
#1
52.6%
#2
31.9%
#3
27.6%
#4
20.0%
#5
16.1%
#6
15.3%
#7
15.1%
#8
15.1%
#9
14.2%
#10
13.8%
What city has the Highest Percentage of Population with a Degree in Literature and Languages in Tennessee?
Graball has the Highest Percentage of Population with a Degree in Literature and Languages in Tennessee with 52.6%.
What is the Percentage of Population with a Degree in Literature and Languages in the State of Tennessee?
Percentage of Population with a Degree in Literature and Languages in Tennessee is 3.6%.
What is the Percentage of Population with a Degree in Literature and Languages in the United States?
Percentage of Population with a Degree in Literature and Languages in the United States is 4.4%.