Cities with the Highest Percentage of Population with a Degree in Literature and Languages in Kentucky
RELATED REPORTS & OPTIONS
Literature and Languages
Kentucky
Compare Cities
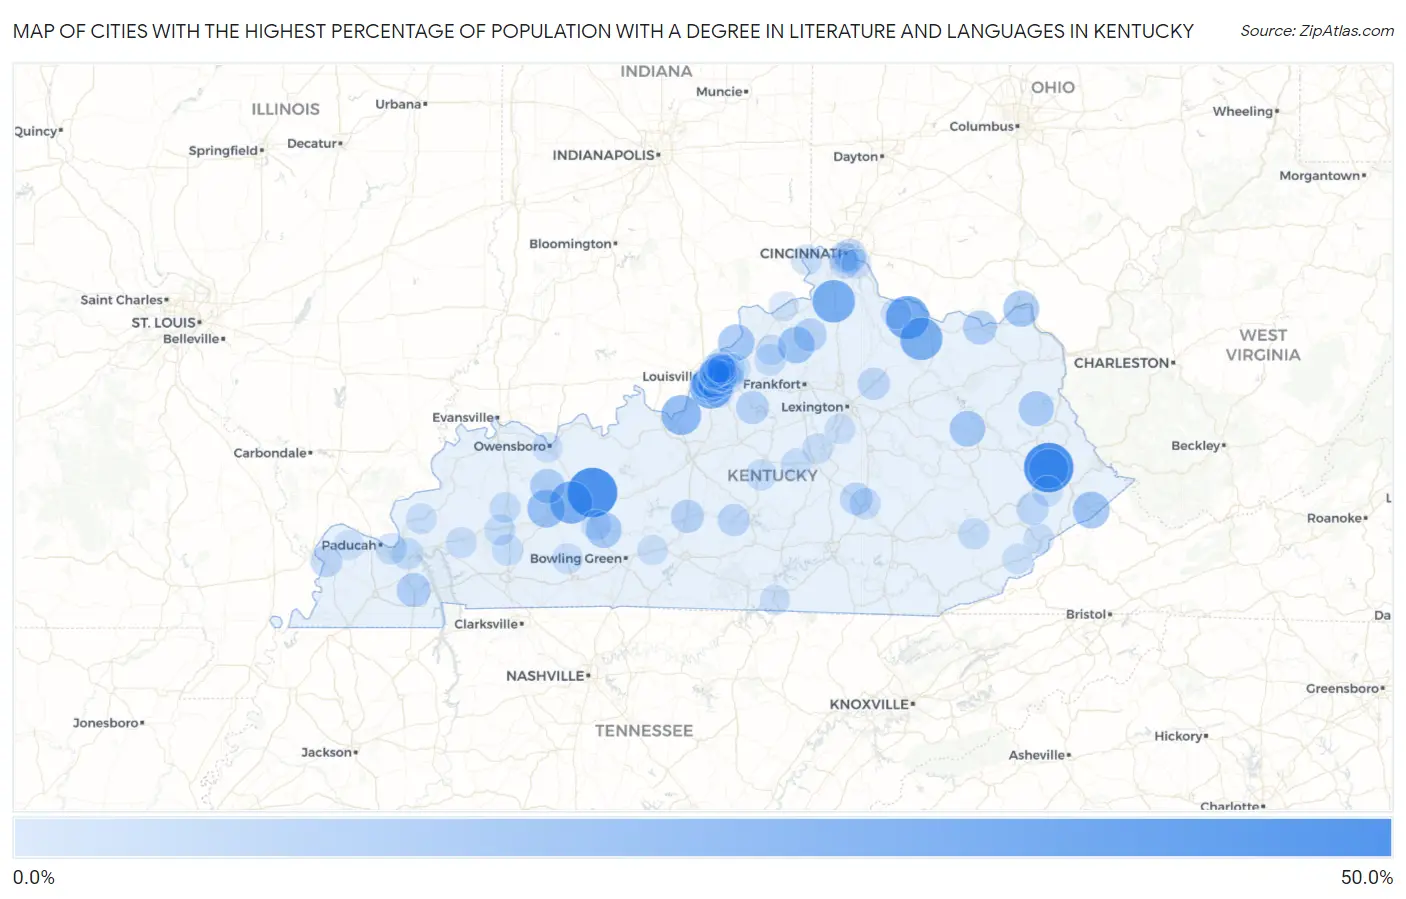
Map of Cities with the Highest Percentage of Population with a Degree in Literature and Languages in Kentucky
0.0%
50.0%
Cities with the Highest Percentage of Population with a Degree in Literature and Languages in Kentucky
| City | % Graduates | vs State | vs National | |
| 1. | Dwale | 50.0% | 3.8%(+46.2)#1 | 4.4%(+45.6)#86 |
| 2. | Rosine | 50.0% | 3.8%(+46.2)#2 | 4.4%(+45.6)#89 |
| 3. | Germantown | 35.0% | 3.8%(+31.2)#3 | 4.4%(+30.6)#213 |
| 4. | Crittenden | 33.7% | 3.8%(+29.9)#4 | 4.4%(+29.3)#224 |
| 5. | Poplar Hills | 33.3% | 3.8%(+29.6)#5 | 4.4%(+28.9)#227 |
| 6. | Mchenry | 33.3% | 3.8%(+29.6)#6 | 4.4%(+28.9)#231 |
| 7. | Mays Lick | 33.3% | 3.8%(+29.6)#7 | 4.4%(+28.9)#245 |
| 8. | West Point | 27.1% | 3.8%(+23.4)#8 | 4.4%(+22.7)#369 |
| 9. | Allen | 26.7% | 3.8%(+22.9)#9 | 4.4%(+22.3)#382 |
| 10. | South Carrollton | 22.6% | 3.8%(+18.8)#10 | 4.4%(+18.2)#518 |
| 11. | Elkhorn City | 20.3% | 3.8%(+16.6)#11 | 4.4%(+15.9)#621 |
| 12. | Gratz | 20.0% | 3.8%(+16.2)#12 | 4.4%(+15.6)#653 |
| 13. | Westport | 19.1% | 3.8%(+15.4)#13 | 4.4%(+14.7)#699 |
| 14. | South Shore | 18.9% | 3.8%(+15.1)#14 | 4.4%(+14.5)#716 |
| 15. | Woodbury | 18.2% | 3.8%(+14.4)#15 | 4.4%(+13.8)#784 |
| 16. | Ezel | 17.9% | 3.8%(+14.2)#16 | 4.4%(+13.5)#797 |
| 17. | Blaine | 16.7% | 3.8%(+12.9)#17 | 4.4%(+12.3)#905 |
| 18. | Livermore | 15.5% | 3.8%(+11.7)#18 | 4.4%(+11.1)#1,007 |
| 19. | Meadowview Estates | 15.3% | 3.8%(+11.5)#19 | 4.4%(+10.9)#1,031 |
| 20. | Thornhill | 15.2% | 3.8%(+11.4)#20 | 4.4%(+10.7)#1,043 |
| 21. | Hardin | 14.3% | 3.8%(+10.5)#21 | 4.4%(+9.88)#1,149 |
| 22. | Vanceburg | 14.2% | 3.8%(+10.4)#22 | 4.4%(+9.74)#1,190 |
| 23. | Brownsboro Village | 13.5% | 3.8%(+9.75)#23 | 4.4%(+9.10)#1,310 |
| 24. | Kingsley | 13.1% | 3.8%(+9.32)#24 | 4.4%(+8.67)#1,378 |
| 25. | Owenton | 12.6% | 3.8%(+8.84)#25 | 4.4%(+8.19)#1,462 |
| 26. | Munfordville | 12.5% | 3.8%(+8.74)#26 | 4.4%(+8.09)#1,474 |
| 27. | Taylorsville | 12.2% | 3.8%(+8.43)#27 | 4.4%(+7.79)#1,539 |
| 28. | Rolling Hills | 11.7% | 3.8%(+7.91)#28 | 4.4%(+7.27)#1,639 |
| 29. | Brodhead | 11.0% | 3.8%(+7.27)#29 | 4.4%(+6.62)#1,809 |
| 30. | Lynnview | 10.9% | 3.8%(+7.16)#30 | 4.4%(+6.51)#1,845 |
| 31. | Bellewood | 10.9% | 3.8%(+7.12)#31 | 4.4%(+6.47)#1,852 |
| 32. | Woodlawn | 10.6% | 3.8%(+6.84)#32 | 4.4%(+6.20)#1,942 |
| 33. | Pippa Passes | 10.5% | 3.8%(+6.76)#33 | 4.4%(+6.12)#1,966 |
| 34. | Greensburg | 10.5% | 3.8%(+6.74)#34 | 4.4%(+6.09)#1,979 |
| 35. | Paris | 10.4% | 3.8%(+6.61)#35 | 4.4%(+5.96)#2,016 |
| 36. | Watterson Park | 10.3% | 3.8%(+6.53)#36 | 4.4%(+5.88)#2,042 |
| 37. | Plantation | 10.3% | 3.8%(+6.51)#37 | 4.4%(+5.87)#2,047 |
| 38. | West Buechel | 10.2% | 3.8%(+6.41)#38 | 4.4%(+5.77)#2,086 |
| 39. | Wickliffe | 9.8% | 3.8%(+6.04)#39 | 4.4%(+5.39)#2,214 |
| 40. | Hills And Dales | 9.8% | 3.8%(+5.99)#40 | 4.4%(+5.35)#2,239 |
| 41. | Maryhill Estates | 9.6% | 3.8%(+5.89)#41 | 4.4%(+5.24)#2,279 |
| 42. | Calvert City | 8.9% | 3.8%(+5.10)#42 | 4.4%(+4.46)#2,669 |
| 43. | Ledbetter | 8.8% | 3.8%(+5.02)#43 | 4.4%(+4.37)#2,699 |
| 44. | Norbourne Estates | 8.8% | 3.8%(+5.02)#44 | 4.4%(+4.37)#2,701 |
| 45. | Eminence | 8.7% | 3.8%(+4.96)#45 | 4.4%(+4.32)#2,730 |
| 46. | Beechwood Village | 8.7% | 3.8%(+4.94)#46 | 4.4%(+4.30)#2,741 |
| 47. | Strathmoor Village | 8.6% | 3.8%(+4.82)#47 | 4.4%(+4.17)#2,812 |
| 48. | Cambridge | 8.5% | 3.8%(+4.71)#48 | 4.4%(+4.06)#2,886 |
| 49. | Mount Vernon | 8.4% | 3.8%(+4.65)#49 | 4.4%(+4.00)#2,907 |
| 50. | Parkway Village | 8.3% | 3.8%(+4.57)#50 | 4.4%(+3.92)#2,964 |
| 51. | Hyden | 8.3% | 3.8%(+4.52)#51 | 4.4%(+3.87)#3,002 |
| 52. | Richlawn | 8.2% | 3.8%(+4.45)#52 | 4.4%(+3.80)#3,043 |
| 53. | Audubon Park | 8.1% | 3.8%(+4.39)#53 | 4.4%(+3.74)#3,077 |
| 54. | Crofton | 8.1% | 3.8%(+4.34)#54 | 4.4%(+3.70)#3,112 |
| 55. | Wellington | 8.1% | 3.8%(+4.30)#55 | 4.4%(+3.65)#3,140 |
| 56. | Lebanon | 8.0% | 3.8%(+4.25)#56 | 4.4%(+3.61)#3,162 |
| 57. | Pewee Valley | 7.7% | 3.8%(+3.94)#57 | 4.4%(+3.30)#3,343 |
| 58. | St Charles | 7.7% | 3.8%(+3.93)#58 | 4.4%(+3.28)#3,372 |
| 59. | Prospect | 7.6% | 3.8%(+3.85)#59 | 4.4%(+3.21)#3,425 |
| 60. | St Matthews | 7.6% | 3.8%(+3.82)#60 | 4.4%(+3.17)#3,455 |
| 61. | Madisonville | 7.5% | 3.8%(+3.73)#61 | 4.4%(+3.09)#3,511 |
| 62. | Woodlawn Park | 7.5% | 3.8%(+3.69)#62 | 4.4%(+3.05)#3,537 |
| 63. | Princeton | 7.4% | 3.8%(+3.63)#63 | 4.4%(+2.99)#3,588 |
| 64. | Glenview | 7.4% | 3.8%(+3.60)#64 | 4.4%(+2.95)#3,615 |
| 65. | Mcdowell | 7.3% | 3.8%(+3.58)#65 | 4.4%(+2.93)#3,631 |
| 66. | Lewisburg | 7.2% | 3.8%(+3.48)#66 | 4.4%(+2.84)#3,702 |
| 67. | Morgantown | 7.2% | 3.8%(+3.45)#67 | 4.4%(+2.81)#3,722 |
| 68. | Southgate | 7.2% | 3.8%(+3.45)#68 | 4.4%(+2.80)#3,729 |
| 69. | Petersburg | 7.1% | 3.8%(+3.30)#69 | 4.4%(+2.65)#3,892 |
| 70. | Perryville | 7.0% | 3.8%(+3.25)#70 | 4.4%(+2.60)#3,929 |
| 71. | Burgin | 7.0% | 3.8%(+3.21)#71 | 4.4%(+2.57)#3,956 |
| 72. | Salem | 7.0% | 3.8%(+3.21)#72 | 4.4%(+2.57)#3,958 |
| 73. | New Castle | 6.9% | 3.8%(+3.18)#73 | 4.4%(+2.53)#3,990 |
| 74. | Yelvington | 6.9% | 3.8%(+3.16)#74 | 4.4%(+2.51)#4,023 |
| 75. | Whitesburg | 6.9% | 3.8%(+3.09)#75 | 4.4%(+2.44)#4,094 |
| 76. | Park Hills | 6.8% | 3.8%(+3.07)#76 | 4.4%(+2.42)#4,110 |
| 77. | Norwood | 6.8% | 3.8%(+3.06)#77 | 4.4%(+2.41)#4,133 |
| 78. | Ten Broeck | 6.7% | 3.8%(+2.90)#78 | 4.4%(+2.26)#4,287 |
| 79. | Worthington Hills | 6.7% | 3.8%(+2.89)#79 | 4.4%(+2.24)#4,291 |
| 80. | Druid Hills | 6.6% | 3.8%(+2.79)#80 | 4.4%(+2.14)#4,384 |
| 81. | Smiths Grove | 6.5% | 3.8%(+2.73)#81 | 4.4%(+2.08)#4,440 |
| 82. | Covington | 6.5% | 3.8%(+2.71)#82 | 4.4%(+2.07)#4,463 |
| 83. | Brooksville | 6.4% | 3.8%(+2.65)#83 | 4.4%(+2.00)#4,535 |
| 84. | Nicholasville | 6.3% | 3.8%(+2.54)#84 | 4.4%(+1.89)#4,657 |
| 85. | Douglass Hills | 6.3% | 3.8%(+2.51)#85 | 4.4%(+1.86)#4,686 |
| 86. | Owensboro | 6.2% | 3.8%(+2.45)#86 | 4.4%(+1.80)#4,771 |
| 87. | Glenview Manor | 6.2% | 3.8%(+2.43)#87 | 4.4%(+1.79)#4,789 |
| 88. | Cumberland | 6.2% | 3.8%(+2.43)#88 | 4.4%(+1.78)#4,792 |
| 89. | Spring Mill | 6.1% | 3.8%(+2.38)#89 | 4.4%(+1.73)#4,853 |
| 90. | Albany | 6.1% | 3.8%(+2.35)#90 | 4.4%(+1.71)#4,890 |
| 91. | Anchorage | 6.1% | 3.8%(+2.34)#91 | 4.4%(+1.69)#4,911 |
| 92. | Bellemeade | 6.1% | 3.8%(+2.32)#92 | 4.4%(+1.67)#4,932 |
| 93. | Indian Hills | 6.0% | 3.8%(+2.25)#93 | 4.4%(+1.60)#5,019 |
| 94. | Rolling Fields | 6.0% | 3.8%(+2.23)#94 | 4.4%(+1.58)#5,044 |
| 95. | Barbourmeade | 5.9% | 3.8%(+2.15)#95 | 4.4%(+1.50)#5,138 |
| 96. | Crestview | 5.9% | 3.8%(+2.12)#96 | 4.4%(+1.47)#5,188 |
| 97. | Ghent | 5.9% | 3.8%(+2.12)#97 | 4.4%(+1.47)#5,196 |
| 98. | Brownsboro Farm | 5.7% | 3.8%(+1.96)#98 | 4.4%(+1.31)#5,371 |
| 99. | Kevil | 5.7% | 3.8%(+1.95)#99 | 4.4%(+1.30)#5,386 |
| 100. | Green Spring | 5.6% | 3.8%(+1.87)#100 | 4.4%(+1.22)#5,516 |
Common Questions
What are the Top 10 Cities with the Highest Percentage of Population with a Degree in Literature and Languages in Kentucky?
Top 10 Cities with the Highest Percentage of Population with a Degree in Literature and Languages in Kentucky are:
#1
50.0%
#2
50.0%
#3
35.0%
#4
33.7%
#5
33.3%
#6
33.3%
#7
33.3%
#8
27.1%
#9
26.7%
#10
22.6%
What city has the Highest Percentage of Population with a Degree in Literature and Languages in Kentucky?
Dwale has the Highest Percentage of Population with a Degree in Literature and Languages in Kentucky with 50.0%.
What is the Percentage of Population with a Degree in Literature and Languages in the State of Kentucky?
Percentage of Population with a Degree in Literature and Languages in Kentucky is 3.8%.
What is the Percentage of Population with a Degree in Literature and Languages in the United States?
Percentage of Population with a Degree in Literature and Languages in the United States is 4.4%.