Cities with the Highest Percentage of Population with a Degree in Literature and Languages in Texas
RELATED REPORTS & OPTIONS
Literature and Languages
Texas
Compare Cities
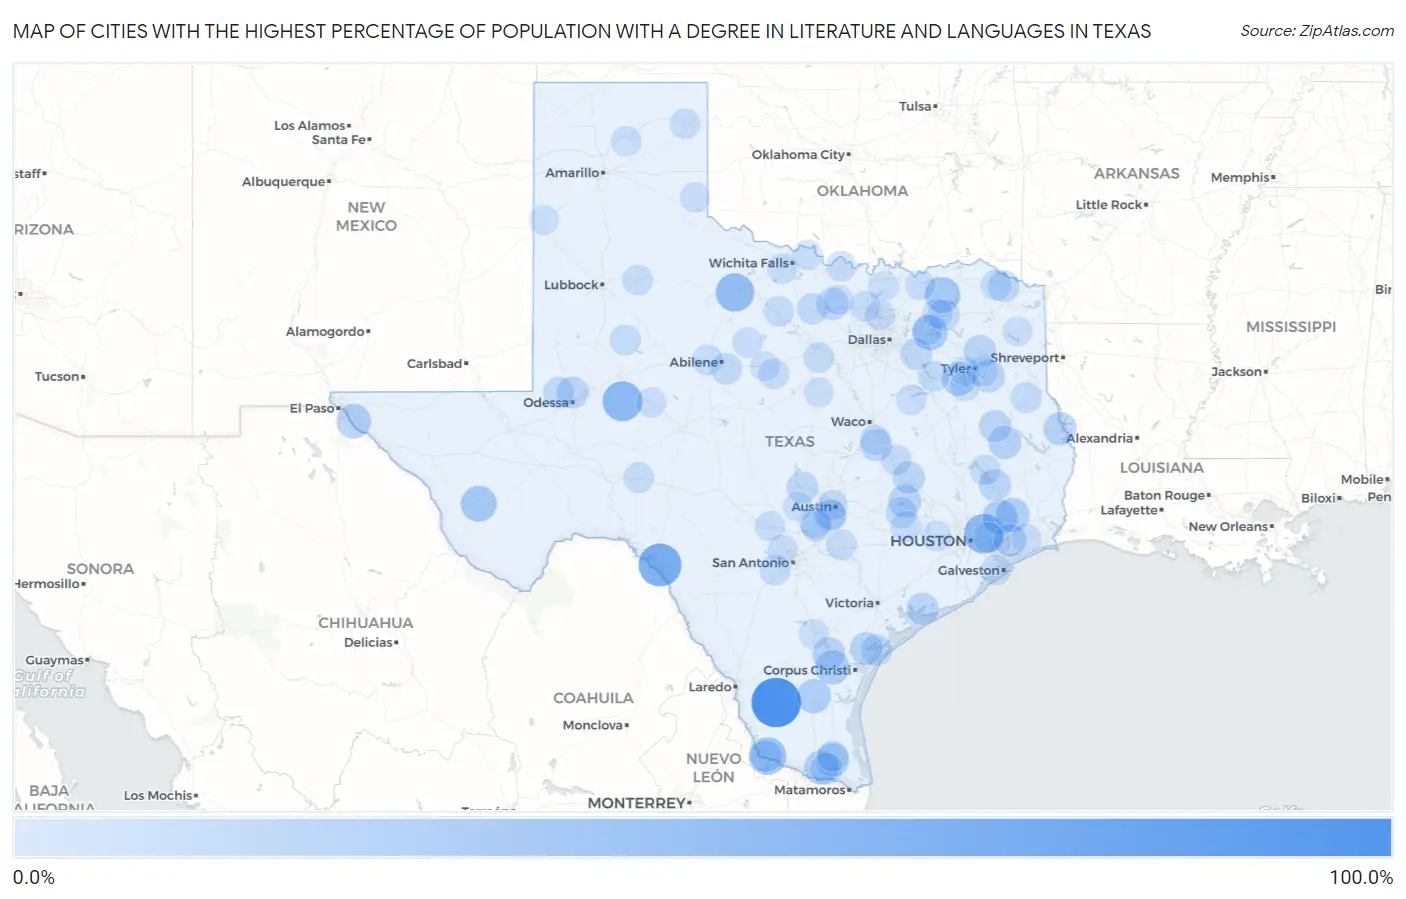
Map of Cities with the Highest Percentage of Population with a Degree in Literature and Languages in Texas
0.0%
100.0%
Cities with the Highest Percentage of Population with a Degree in Literature and Languages in Texas
| City | % Graduates | vs State | vs National | |
| 1. | Grangerland | 100.0% | 3.4%(+96.6)#1 | 4.4%(+95.6)#4 |
| 2. | Thompsonville | 100.0% | 3.4%(+96.6)#2 | 4.4%(+95.6)#21 |
| 3. | Los Ebanos Cdp Starr County | 100.0% | 3.4%(+96.6)#3 | 4.4%(+95.6)#23 |
| 4. | Val Verde Park | 68.6% | 3.4%(+65.2)#4 | 4.4%(+64.2)#49 |
| 5. | Garden City | 53.7% | 3.4%(+50.2)#5 | 4.4%(+49.2)#70 |
| 6. | Rowena | 52.9% | 3.4%(+49.5)#6 | 4.4%(+48.5)#73 |
| 7. | Sheldon | 51.6% | 3.4%(+48.1)#7 | 4.4%(+47.2)#80 |
| 8. | Goree | 47.4% | 3.4%(+43.9)#8 | 4.4%(+43.0)#108 |
| 9. | Garceno | 42.9% | 3.4%(+39.4)#9 | 4.4%(+38.4)#136 |
| 10. | Marfa | 35.5% | 3.4%(+32.1)#10 | 4.4%(+31.1)#205 |
| 11. | Pecan Gap | 34.8% | 3.4%(+31.3)#11 | 4.4%(+30.4)#215 |
| 12. | Hawk Cove | 31.8% | 3.4%(+28.4)#12 | 4.4%(+27.4)#272 |
| 13. | Kenefick | 30.6% | 3.4%(+27.1)#13 | 4.4%(+26.1)#293 |
| 14. | Morning Glory | 29.5% | 3.4%(+26.1)#14 | 4.4%(+25.1)#313 |
| 15. | Hamshire | 28.3% | 3.4%(+24.8)#15 | 4.4%(+23.9)#342 |
| 16. | Hull | 28.2% | 3.4%(+24.7)#16 | 4.4%(+23.8)#344 |
| 17. | Banquete | 28.1% | 3.4%(+24.7)#17 | 4.4%(+23.7)#345 |
| 18. | Premont | 27.8% | 3.4%(+24.4)#18 | 4.4%(+23.4)#356 |
| 19. | Moore Station | 27.8% | 3.4%(+24.3)#19 | 4.4%(+23.4)#357 |
| 20. | Olivarez | 27.0% | 3.4%(+23.5)#20 | 4.4%(+22.6)#374 |
| 21. | Sebastian | 25.4% | 3.4%(+22.0)#21 | 4.4%(+21.0)#413 |
| 22. | Burke | 23.6% | 3.4%(+20.2)#22 | 4.4%(+19.2)#487 |
| 23. | Milam | 23.3% | 3.4%(+19.9)#23 | 4.4%(+18.9)#495 |
| 24. | Sandia | 21.8% | 3.4%(+18.4)#24 | 4.4%(+17.4)#548 |
| 25. | Bayside | 21.4% | 3.4%(+18.0)#25 | 4.4%(+17.0)#566 |
| 26. | Anahuac | 21.2% | 3.4%(+17.7)#26 | 4.4%(+16.7)#581 |
| 27. | Somerville | 21.1% | 3.4%(+17.7)#27 | 4.4%(+16.7)#584 |
| 28. | Manchaca | 20.9% | 3.4%(+17.5)#28 | 4.4%(+16.5)#596 |
| 29. | Hawkins | 20.3% | 3.4%(+16.9)#29 | 4.4%(+15.9)#622 |
| 30. | Palacios | 20.3% | 3.4%(+16.8)#30 | 4.4%(+15.9)#627 |
| 31. | Chico | 19.7% | 3.4%(+16.3)#31 | 4.4%(+15.3)#665 |
| 32. | Lott | 19.7% | 3.4%(+16.3)#32 | 4.4%(+15.3)#667 |
| 33. | Arp | 19.6% | 3.4%(+16.2)#33 | 4.4%(+15.2)#674 |
| 34. | Lake Bryan | 19.3% | 3.4%(+15.9)#34 | 4.4%(+14.9)#687 |
| 35. | Escobares | 18.9% | 3.4%(+15.4)#35 | 4.4%(+14.5)#718 |
| 36. | Wells | 18.8% | 3.4%(+15.3)#36 | 4.4%(+14.3)#724 |
| 37. | Goodrich | 18.8% | 3.4%(+15.3)#37 | 4.4%(+14.3)#727 |
| 38. | Gardendale | 18.4% | 3.4%(+15.0)#38 | 4.4%(+14.0)#751 |
| 39. | Kaufman | 17.5% | 3.4%(+14.0)#39 | 4.4%(+13.1)#832 |
| 40. | Cottonwood Shores | 17.1% | 3.4%(+13.7)#40 | 4.4%(+12.7)#851 |
| 41. | Indian Hills | 17.1% | 3.4%(+13.7)#41 | 4.4%(+12.7)#853 |
| 42. | Fulton | 16.7% | 3.4%(+13.2)#42 | 4.4%(+12.3)#877 |
| 43. | Avery | 16.6% | 3.4%(+13.1)#43 | 4.4%(+12.1)#915 |
| 44. | Potosi | 16.2% | 3.4%(+12.8)#44 | 4.4%(+11.8)#937 |
| 45. | Jacksboro | 16.0% | 3.4%(+12.6)#45 | 4.4%(+11.6)#954 |
| 46. | Goldsmith | 15.9% | 3.4%(+12.5)#46 | 4.4%(+11.5)#962 |
| 47. | Burton | 15.7% | 3.4%(+12.2)#47 | 4.4%(+11.3)#982 |
| 48. | Cumby | 15.7% | 3.4%(+12.2)#48 | 4.4%(+11.3)#985 |
| 49. | Woodcreek | 15.6% | 3.4%(+12.1)#49 | 4.4%(+11.2)#995 |
| 50. | Timpson | 14.5% | 3.4%(+11.1)#50 | 4.4%(+10.1)#1,112 |
| 51. | Log Cabin | 14.4% | 3.4%(+11.0)#51 | 4.4%(+9.99)#1,127 |
| 52. | Lyford | 13.5% | 3.4%(+10.1)#52 | 4.4%(+9.12)#1,305 |
| 53. | Wimberley | 13.5% | 3.4%(+10.1)#53 | 4.4%(+9.12)#1,307 |
| 54. | Gail | 13.5% | 3.4%(+10.1)#54 | 4.4%(+9.10)#1,311 |
| 55. | New Chapel Hill | 13.5% | 3.4%(+10.0)#55 | 4.4%(+9.04)#1,324 |
| 56. | Annona | 13.3% | 3.4%(+9.90)#56 | 4.4%(+8.92)#1,348 |
| 57. | Onalaska | 13.2% | 3.4%(+9.72)#57 | 4.4%(+8.75)#1,370 |
| 58. | Ozona | 13.0% | 3.4%(+9.57)#58 | 4.4%(+8.60)#1,387 |
| 59. | Highlands | 12.9% | 3.4%(+9.48)#59 | 4.4%(+8.51)#1,400 |
| 60. | Lacoste | 12.9% | 3.4%(+9.48)#60 | 4.4%(+8.51)#1,404 |
| 61. | Luling | 12.9% | 3.4%(+9.42)#61 | 4.4%(+8.45)#1,413 |
| 62. | Calvert | 12.8% | 3.4%(+9.38)#62 | 4.4%(+8.41)#1,422 |
| 63. | Merkel | 12.8% | 3.4%(+9.36)#63 | 4.4%(+8.38)#1,426 |
| 64. | Crosbyton | 12.4% | 3.4%(+8.98)#64 | 4.4%(+8.01)#1,504 |
| 65. | Newcastle | 12.3% | 3.4%(+8.89)#65 | 4.4%(+7.92)#1,515 |
| 66. | Industry | 12.2% | 3.4%(+8.73)#66 | 4.4%(+7.75)#1,547 |
| 67. | Krum | 12.2% | 3.4%(+8.72)#67 | 4.4%(+7.75)#1,548 |
| 68. | Nocona Hills | 12.1% | 3.4%(+8.63)#68 | 4.4%(+7.66)#1,558 |
| 69. | Carbon | 12.0% | 3.4%(+8.56)#69 | 4.4%(+7.59)#1,569 |
| 70. | Lipan | 11.9% | 3.4%(+8.47)#70 | 4.4%(+7.50)#1,586 |
| 71. | Holliday | 11.8% | 3.4%(+8.40)#71 | 4.4%(+7.42)#1,601 |
| 72. | Canadian | 11.8% | 3.4%(+8.37)#72 | 4.4%(+7.40)#1,605 |
| 73. | Quinlan | 11.2% | 3.4%(+7.80)#73 | 4.4%(+6.83)#1,732 |
| 74. | Pattison | 11.2% | 3.4%(+7.79)#74 | 4.4%(+6.82)#1,734 |
| 75. | Borger | 11.1% | 3.4%(+7.69)#75 | 4.4%(+6.71)#1,755 |
| 76. | Albany | 11.0% | 3.4%(+7.61)#76 | 4.4%(+6.64)#1,804 |
| 77. | Stowell | 11.0% | 3.4%(+7.58)#77 | 4.4%(+6.61)#1,815 |
| 78. | Tiki Island | 11.0% | 3.4%(+7.58)#78 | 4.4%(+6.61)#1,816 |
| 79. | Sterling City | 10.9% | 3.4%(+7.49)#79 | 4.4%(+6.51)#1,844 |
| 80. | Campbell | 10.9% | 3.4%(+7.45)#80 | 4.4%(+6.48)#1,849 |
| 81. | Richland | 10.9% | 3.4%(+7.43)#81 | 4.4%(+6.46)#1,857 |
| 82. | Wellington | 10.8% | 3.4%(+7.40)#82 | 4.4%(+6.42)#1,872 |
| 83. | Chilton | 10.7% | 3.4%(+7.28)#83 | 4.4%(+6.30)#1,903 |
| 84. | Petrolia | 10.6% | 3.4%(+7.17)#84 | 4.4%(+6.20)#1,941 |
| 85. | Grey Forest | 10.5% | 3.4%(+7.05)#85 | 4.4%(+6.07)#1,984 |
| 86. | Ector | 10.3% | 3.4%(+6.91)#86 | 4.4%(+5.94)#2,023 |
| 87. | Comfort | 10.3% | 3.4%(+6.86)#87 | 4.4%(+5.88)#2,041 |
| 88. | Lakewood Village | 10.2% | 3.4%(+6.77)#88 | 4.4%(+5.79)#2,076 |
| 89. | West Lake Hills | 10.2% | 3.4%(+6.77)#89 | 4.4%(+5.79)#2,079 |
| 90. | Avinger | 10.0% | 3.4%(+6.56)#90 | 4.4%(+5.59)#2,149 |
| 91. | George West | 9.9% | 3.4%(+6.51)#91 | 4.4%(+5.54)#2,175 |
| 92. | Bovina | 9.8% | 3.4%(+6.32)#92 | 4.4%(+5.35)#2,234 |
| 93. | Collinsville | 9.6% | 3.4%(+6.21)#93 | 4.4%(+5.24)#2,282 |
| 94. | Johnson City | 9.6% | 3.4%(+6.18)#94 | 4.4%(+5.21)#2,292 |
| 95. | Cisco | 9.6% | 3.4%(+6.11)#95 | 4.4%(+5.14)#2,317 |
| 96. | Chandler | 9.5% | 3.4%(+6.10)#96 | 4.4%(+5.12)#2,322 |
| 97. | Berryville | 9.5% | 3.4%(+6.09)#97 | 4.4%(+5.11)#2,323 |
| 98. | San Leanna | 9.5% | 3.4%(+6.07)#98 | 4.4%(+5.09)#2,349 |
| 99. | Hico | 9.5% | 3.4%(+6.02)#99 | 4.4%(+5.05)#2,361 |
| 100. | Alvord | 9.4% | 3.4%(+6.00)#100 | 4.4%(+5.02)#2,365 |
Common Questions
What are the Top 10 Cities with the Highest Percentage of Population with a Degree in Literature and Languages in Texas?
Top 10 Cities with the Highest Percentage of Population with a Degree in Literature and Languages in Texas are:
#1
100.0%
#2
68.6%
#3
53.7%
#4
51.6%
#5
47.4%
#6
42.9%
#7
35.5%
#8
34.8%
#9
31.8%
#10
30.6%
What city has the Highest Percentage of Population with a Degree in Literature and Languages in Texas?
Thompsonville has the Highest Percentage of Population with a Degree in Literature and Languages in Texas with 100.0%.
What is the Percentage of Population with a Degree in Literature and Languages in the State of Texas?
Percentage of Population with a Degree in Literature and Languages in Texas is 3.4%.
What is the Percentage of Population with a Degree in Literature and Languages in the United States?
Percentage of Population with a Degree in Literature and Languages in the United States is 4.4%.