Cities with the Highest Percentage of Population with a Degree in Literature and Languages in North Carolina
RELATED REPORTS & OPTIONS
Literature and Languages
North Carolina
Compare Cities
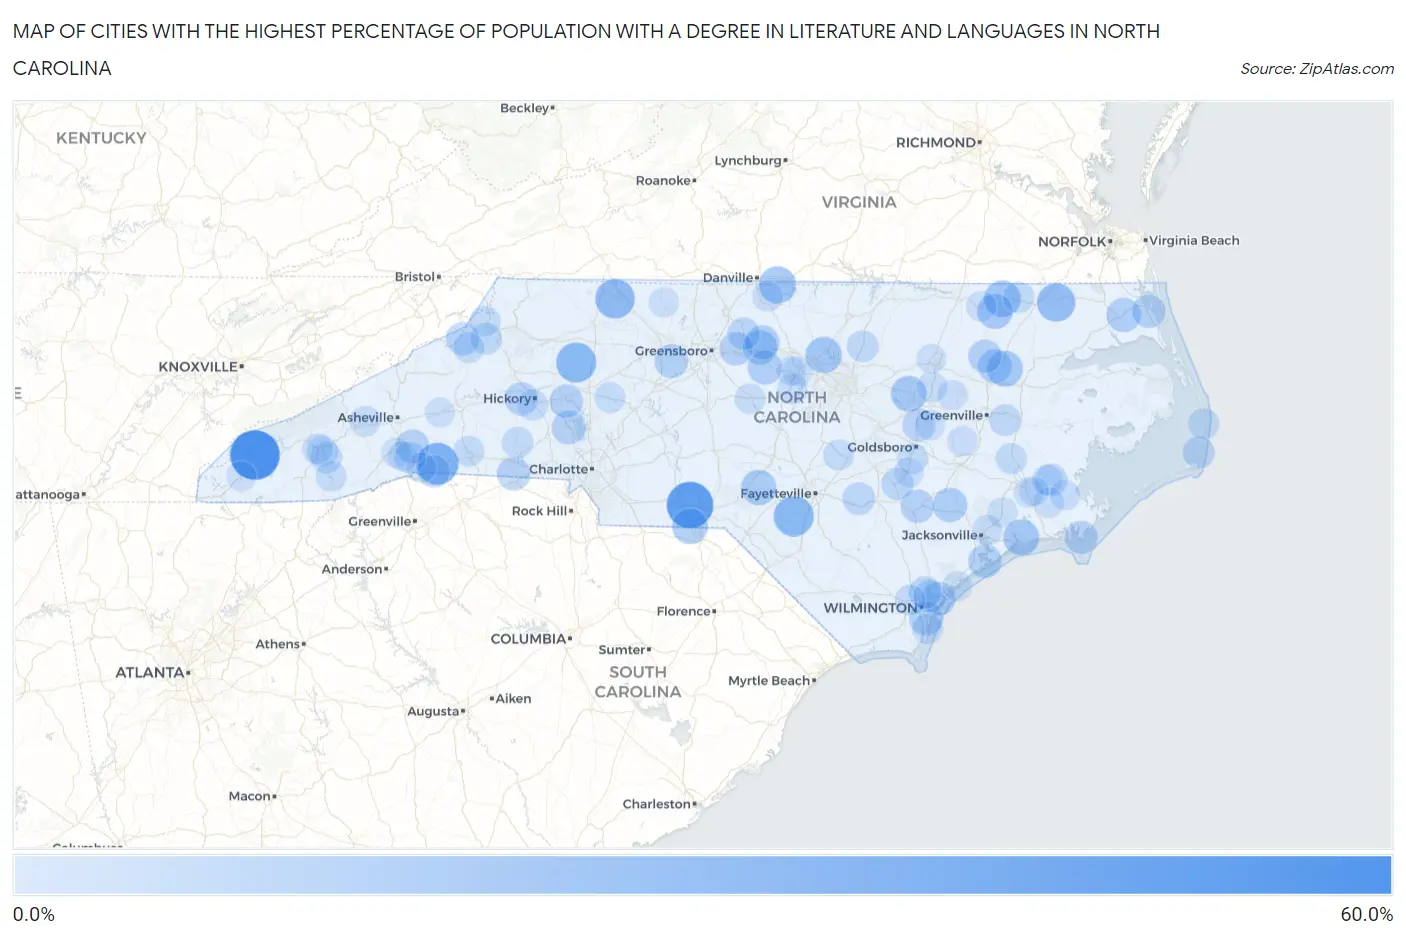
Map of Cities with the Highest Percentage of Population with a Degree in Literature and Languages in North Carolina
0.0%
60.0%
Cities with the Highest Percentage of Population with a Degree in Literature and Languages in North Carolina
| City | % Graduates | vs State | vs National | |
| 1. | Robbinsville | 58.3% | 4.2%(+54.1)#1 | 4.4%(+53.9)#62 |
| 2. | Lilesville | 50.0% | 4.2%(+45.8)#2 | 4.4%(+45.6)#82 |
| 3. | Yadkin College | 39.3% | 4.2%(+35.1)#3 | 4.4%(+34.9)#162 |
| 4. | Columbus | 38.1% | 4.2%(+33.9)#4 | 4.4%(+33.7)#173 |
| 5. | Love Valley | 33.3% | 4.2%(+29.1)#5 | 4.4%(+28.9)#242 |
| 6. | Lumber Bridge | 33.3% | 4.2%(+29.1)#6 | 4.4%(+28.9)#248 |
| 7. | White Plains | 31.9% | 4.2%(+27.6)#7 | 4.4%(+27.5)#270 |
| 8. | Gatesville | 28.9% | 4.2%(+24.7)#8 | 4.4%(+24.5)#329 |
| 9. | Carolina Meadows | 27.0% | 4.2%(+22.8)#9 | 4.4%(+22.6)#372 |
| 10. | Milton | 25.9% | 4.2%(+21.7)#10 | 4.4%(+21.5)#406 |
| 11. | Conway | 24.6% | 4.2%(+20.3)#11 | 4.4%(+20.2)#458 |
| 12. | Gorman | 23.6% | 4.2%(+19.4)#12 | 4.4%(+19.2)#485 |
| 13. | Peletier | 22.8% | 4.2%(+18.6)#13 | 4.4%(+18.4)#512 |
| 14. | Hamilton | 22.7% | 4.2%(+18.5)#14 | 4.4%(+18.3)#516 |
| 15. | Sims | 22.4% | 4.2%(+18.2)#15 | 4.4%(+18.0)#522 |
| 16. | Mcfarlan | 22.2% | 4.2%(+18.0)#16 | 4.4%(+17.8)#539 |
| 17. | Lasker | 21.4% | 4.2%(+17.2)#17 | 4.4%(+17.0)#570 |
| 18. | Ashley Heights | 21.1% | 4.2%(+16.8)#18 | 4.4%(+16.6)#588 |
| 19. | Potters Hill | 19.1% | 4.2%(+14.9)#19 | 4.4%(+14.7)#698 |
| 20. | Haw River | 19.0% | 4.2%(+14.8)#20 | 4.4%(+14.6)#708 |
| 21. | Camden | 18.5% | 4.2%(+14.3)#21 | 4.4%(+14.1)#742 |
| 22. | Saxapahaw | 18.5% | 4.2%(+14.2)#22 | 4.4%(+14.1)#746 |
| 23. | Green Level | 18.0% | 4.2%(+13.8)#23 | 4.4%(+13.6)#788 |
| 24. | Oak City | 17.9% | 4.2%(+13.6)#24 | 4.4%(+13.4)#803 |
| 25. | Denver | 17.7% | 4.2%(+13.5)#25 | 4.4%(+13.3)#820 |
| 26. | Bayshore | 17.5% | 4.2%(+13.2)#26 | 4.4%(+13.1)#831 |
| 27. | Silver Lake | 17.3% | 4.2%(+13.1)#27 | 4.4%(+12.9)#841 |
| 28. | Sneads Ferry | 17.2% | 4.2%(+13.0)#28 | 4.4%(+12.8)#848 |
| 29. | Wallburg | 17.0% | 4.2%(+12.8)#29 | 4.4%(+12.6)#864 |
| 30. | Catawba | 16.7% | 4.2%(+12.4)#30 | 4.4%(+12.3)#880 |
| 31. | Whitsett | 16.7% | 4.2%(+12.4)#31 | 4.4%(+12.3)#882 |
| 32. | Earl | 16.7% | 4.2%(+12.4)#32 | 4.4%(+12.3)#887 |
| 33. | Coinjock | 16.7% | 4.2%(+12.4)#33 | 4.4%(+12.3)#893 |
| 34. | Hobgood | 16.7% | 4.2%(+12.4)#34 | 4.4%(+12.3)#894 |
| 35. | Kenansville | 16.5% | 4.2%(+12.2)#35 | 4.4%(+12.1)#921 |
| 36. | Fruitland | 16.4% | 4.2%(+12.2)#36 | 4.4%(+12.0)#926 |
| 37. | Icard | 16.0% | 4.2%(+11.8)#37 | 4.4%(+11.6)#949 |
| 38. | Elk Park | 15.9% | 4.2%(+11.7)#38 | 4.4%(+11.5)#958 |
| 39. | Gloucester | 15.7% | 4.2%(+11.4)#39 | 4.4%(+11.2)#986 |
| 40. | Grandy | 15.5% | 4.2%(+11.2)#40 | 4.4%(+11.0)#1,010 |
| 41. | Fremont | 15.1% | 4.2%(+10.9)#41 | 4.4%(+10.7)#1,048 |
| 42. | Tryon | 14.3% | 4.2%(+10.1)#42 | 4.4%(+9.93)#1,139 |
| 43. | Salemburg | 14.3% | 4.2%(+10.1)#43 | 4.4%(+9.88)#1,157 |
| 44. | Northchase | 14.2% | 4.2%(+9.94)#44 | 4.4%(+9.77)#1,182 |
| 45. | Skippers Corner | 14.1% | 4.2%(+9.83)#45 | 4.4%(+9.66)#1,207 |
| 46. | Altamahaw | 14.1% | 4.2%(+9.83)#46 | 4.4%(+9.65)#1,210 |
| 47. | Faison | 14.0% | 4.2%(+9.72)#47 | 4.4%(+9.54)#1,228 |
| 48. | Alliance | 13.9% | 4.2%(+9.65)#48 | 4.4%(+9.48)#1,239 |
| 49. | Avon | 13.0% | 4.2%(+8.79)#49 | 4.4%(+8.61)#1,383 |
| 50. | Grimesland | 12.5% | 4.2%(+8.27)#50 | 4.4%(+8.09)#1,484 |
| 51. | Franklinton | 12.4% | 4.2%(+8.19)#51 | 4.4%(+8.01)#1,503 |
| 52. | Cullowhee | 12.4% | 4.2%(+8.15)#52 | 4.4%(+7.97)#1,508 |
| 53. | Foscoe | 12.1% | 4.2%(+7.90)#53 | 4.4%(+7.72)#1,549 |
| 54. | Barker Heights | 12.0% | 4.2%(+7.77)#54 | 4.4%(+7.59)#1,566 |
| 55. | Vanceboro | 11.4% | 4.2%(+7.19)#55 | 4.4%(+7.02)#1,681 |
| 56. | Murfreesboro | 11.4% | 4.2%(+7.18)#56 | 4.4%(+7.01)#1,687 |
| 57. | Fallston | 11.3% | 4.2%(+7.07)#57 | 4.4%(+6.89)#1,713 |
| 58. | Webster | 11.0% | 4.2%(+6.79)#58 | 4.4%(+6.61)#1,814 |
| 59. | New Hope | 10.9% | 4.2%(+6.71)#59 | 4.4%(+6.54)#1,838 |
| 60. | Mountain View | 10.9% | 4.2%(+6.70)#60 | 4.4%(+6.52)#1,842 |
| 61. | Brogden | 10.8% | 4.2%(+6.61)#61 | 4.4%(+6.43)#1,866 |
| 62. | Salvo | 10.8% | 4.2%(+6.61)#62 | 4.4%(+6.43)#1,868 |
| 63. | Cove Creek | 10.6% | 4.2%(+6.37)#63 | 4.4%(+6.20)#1,940 |
| 64. | Spindale | 10.5% | 4.2%(+6.31)#64 | 4.4%(+6.14)#1,958 |
| 65. | Newland | 10.4% | 4.2%(+6.20)#65 | 4.4%(+6.03)#1,997 |
| 66. | Erwin | 10.3% | 4.2%(+6.08)#66 | 4.4%(+5.90)#2,037 |
| 67. | Cleveland | 10.3% | 4.2%(+6.07)#67 | 4.4%(+5.89)#2,039 |
| 68. | Glenville | 10.2% | 4.2%(+5.97)#68 | 4.4%(+5.79)#2,078 |
| 69. | Yanceyville | 10.1% | 4.2%(+5.88)#69 | 4.4%(+5.70)#2,107 |
| 70. | Sea Breeze | 10.1% | 4.2%(+5.82)#70 | 4.4%(+5.64)#2,124 |
| 71. | Dillsboro | 10.0% | 4.2%(+5.77)#71 | 4.4%(+5.59)#2,162 |
| 72. | Siler City | 9.9% | 4.2%(+5.70)#72 | 4.4%(+5.52)#2,180 |
| 73. | Navassa | 9.8% | 4.2%(+5.54)#73 | 4.4%(+5.37)#2,226 |
| 74. | Canton | 9.6% | 4.2%(+5.34)#74 | 4.4%(+5.17)#2,313 |
| 75. | Jackson | 9.4% | 4.2%(+5.14)#75 | 4.4%(+4.97)#2,392 |
| 76. | Grantsboro | 9.2% | 4.2%(+5.00)#76 | 4.4%(+4.82)#2,461 |
| 77. | Hookerton | 9.1% | 4.2%(+4.86)#77 | 4.4%(+4.68)#2,522 |
| 78. | Macclesfield | 9.1% | 4.2%(+4.86)#78 | 4.4%(+4.68)#2,531 |
| 79. | Fearrington Village | 9.1% | 4.2%(+4.82)#79 | 4.4%(+4.65)#2,556 |
| 80. | Minnesott Beach | 9.0% | 4.2%(+4.80)#80 | 4.4%(+4.63)#2,565 |
| 81. | Elm City | 9.0% | 4.2%(+4.79)#81 | 4.4%(+4.62)#2,571 |
| 82. | Cape Colony | 9.0% | 4.2%(+4.79)#82 | 4.4%(+4.61)#2,574 |
| 83. | Oriental | 9.0% | 4.2%(+4.75)#83 | 4.4%(+4.57)#2,597 |
| 84. | Maysville | 9.0% | 4.2%(+4.74)#84 | 4.4%(+4.56)#2,603 |
| 85. | Nebo | 8.9% | 4.2%(+4.64)#85 | 4.4%(+4.47)#2,662 |
| 86. | Chapel Hill | 8.9% | 4.2%(+4.64)#86 | 4.4%(+4.47)#2,663 |
| 87. | Eureka | 8.8% | 4.2%(+4.59)#87 | 4.4%(+4.41)#2,685 |
| 88. | Saluda | 8.8% | 4.2%(+4.58)#88 | 4.4%(+4.40)#2,691 |
| 89. | Pumpkin Center | 8.8% | 4.2%(+4.54)#89 | 4.4%(+4.36)#2,703 |
| 90. | James City | 8.7% | 4.2%(+4.51)#90 | 4.4%(+4.34)#2,719 |
| 91. | Carrboro | 8.6% | 4.2%(+4.37)#91 | 4.4%(+4.20)#2,801 |
| 92. | Horse Shoe | 8.6% | 4.2%(+4.34)#92 | 4.4%(+4.17)#2,814 |
| 93. | Old Fort | 8.5% | 4.2%(+4.29)#93 | 4.4%(+4.12)#2,855 |
| 94. | Marble | 8.5% | 4.2%(+4.28)#94 | 4.4%(+4.10)#2,869 |
| 95. | Laurel Park | 8.5% | 4.2%(+4.23)#95 | 4.4%(+4.06)#2,887 |
| 96. | Danbury | 8.3% | 4.2%(+4.10)#96 | 4.4%(+3.92)#2,973 |
| 97. | Fairfield Harbour | 8.3% | 4.2%(+4.07)#97 | 4.4%(+3.90)#2,995 |
| 98. | Dortches | 8.3% | 4.2%(+4.02)#98 | 4.4%(+3.85)#3,016 |
| 99. | Topsail Beach | 8.2% | 4.2%(+4.01)#99 | 4.4%(+3.84)#3,022 |
| 100. | Mount Olive | 8.2% | 4.2%(+3.98)#100 | 4.4%(+3.80)#3,045 |
Common Questions
What are the Top 10 Cities with the Highest Percentage of Population with a Degree in Literature and Languages in North Carolina?
Top 10 Cities with the Highest Percentage of Population with a Degree in Literature and Languages in North Carolina are:
#1
58.3%
#2
50.0%
#3
38.1%
#4
33.3%
#5
33.3%
#6
31.9%
#7
28.9%
#8
25.9%
#9
24.6%
#10
23.6%
What city has the Highest Percentage of Population with a Degree in Literature and Languages in North Carolina?
Robbinsville has the Highest Percentage of Population with a Degree in Literature and Languages in North Carolina with 58.3%.
What is the Percentage of Population with a Degree in Literature and Languages in the State of North Carolina?
Percentage of Population with a Degree in Literature and Languages in North Carolina is 4.2%.
What is the Percentage of Population with a Degree in Literature and Languages in the United States?
Percentage of Population with a Degree in Literature and Languages in the United States is 4.4%.