Cities with the Highest Percentage of Population with a Degree in Literature and Languages in Oklahoma
RELATED REPORTS & OPTIONS
Literature and Languages
Oklahoma
Compare Cities
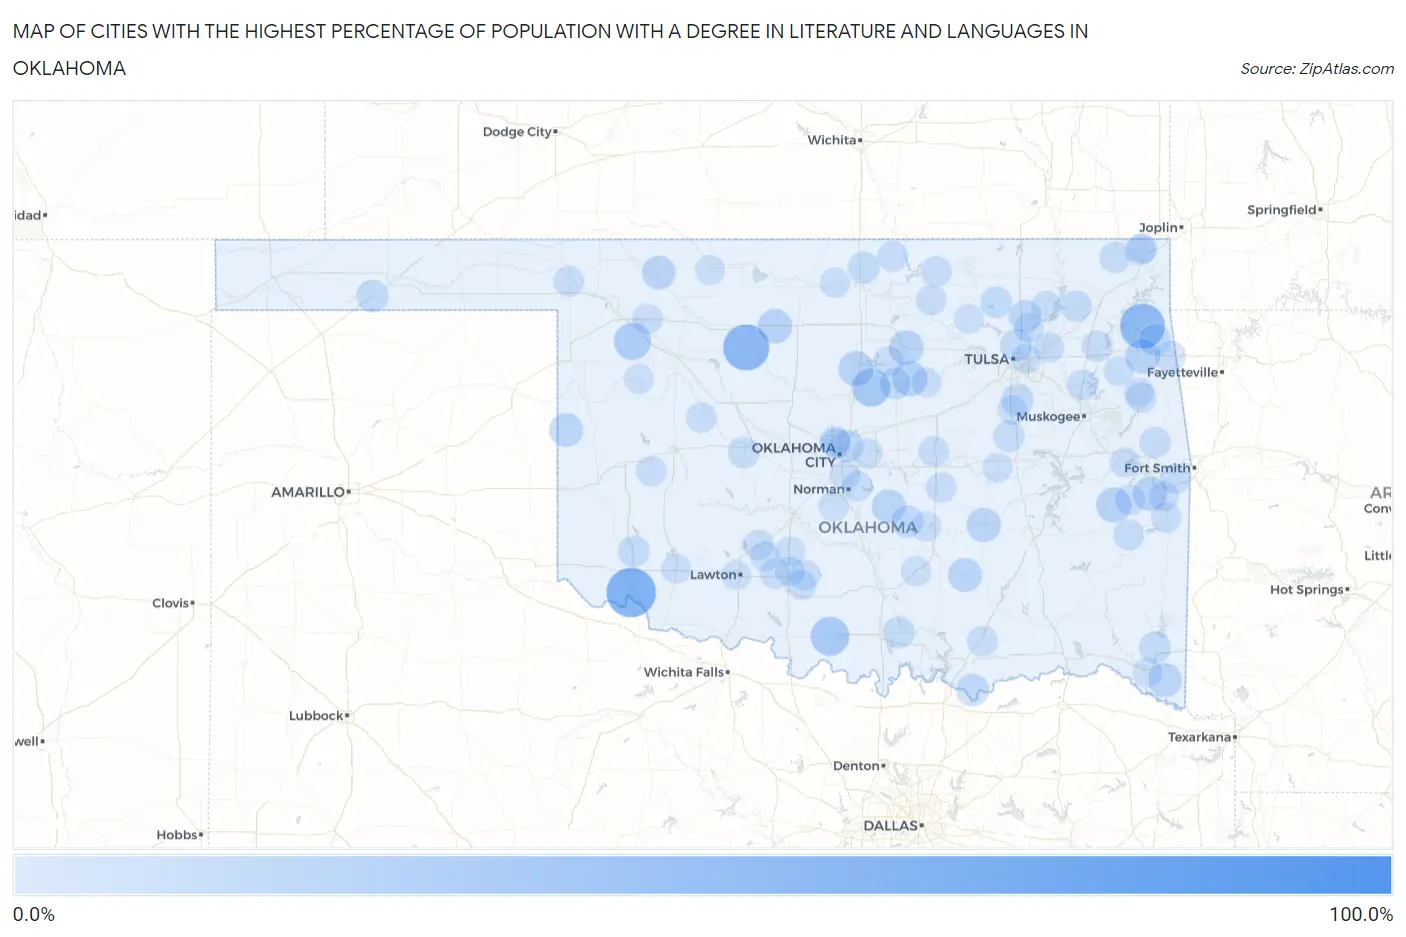
Map of Cities with the Highest Percentage of Population with a Degree in Literature and Languages in Oklahoma
0.0%
100.0%
Cities with the Highest Percentage of Population with a Degree in Literature and Languages in Oklahoma
| City | % Graduates | vs State | vs National | |
| 1. | Avard | 100.0% | 2.8%(+97.2)#1 | 4.4%(+95.6)#37 |
| 2. | Elmer | 60.0% | 2.8%(+57.2)#2 | 4.4%(+55.6)#59 |
| 3. | Isabella | 50.0% | 2.8%(+47.2)#3 | 4.4%(+45.6)#93 |
| 4. | New Eucha | 47.1% | 2.8%(+44.2)#4 | 4.4%(+42.6)#110 |
| 5. | Earl | 33.3% | 2.8%(+30.5)#5 | 4.4%(+28.9)#246 |
| 6. | Cornish | 28.0% | 2.8%(+25.2)#6 | 4.4%(+23.6)#351 |
| 7. | Coyle | 27.0% | 2.8%(+24.2)#7 | 4.4%(+22.6)#371 |
| 8. | Sharon | 23.8% | 2.8%(+21.0)#8 | 4.4%(+19.4)#478 |
| 9. | Mulhall | 18.8% | 2.8%(+15.9)#9 | 4.4%(+14.3)#728 |
| 10. | Ripley | 18.2% | 2.8%(+15.4)#10 | 4.4%(+13.8)#775 |
| 11. | Lequire | 18.2% | 2.8%(+15.4)#11 | 4.4%(+13.8)#781 |
| 12. | Glencoe | 16.7% | 2.8%(+13.8)#12 | 4.4%(+12.3)#884 |
| 13. | Oaks | 16.7% | 2.8%(+13.8)#13 | 4.4%(+12.3)#895 |
| 14. | Lahoma | 16.2% | 2.8%(+13.4)#14 | 4.4%(+11.8)#941 |
| 15. | Bokoshe | 16.0% | 2.8%(+13.2)#15 | 4.4%(+11.6)#952 |
| 16. | Calvin | 15.5% | 2.8%(+12.7)#16 | 4.4%(+11.1)#1,001 |
| 17. | Tupelo | 14.3% | 2.8%(+11.5)#17 | 4.4%(+9.88)#1,152 |
| 18. | Tribbey | 14.3% | 2.8%(+11.5)#18 | 4.4%(+9.88)#1,155 |
| 19. | Haworth | 14.3% | 2.8%(+11.5)#19 | 4.4%(+9.88)#1,162 |
| 20. | Reydon | 14.3% | 2.8%(+11.5)#20 | 4.4%(+9.88)#1,167 |
| 21. | Freedom | 13.8% | 2.8%(+11.0)#21 | 4.4%(+9.38)#1,264 |
| 22. | Vera | 11.2% | 2.8%(+8.41)#22 | 4.4%(+6.83)#1,733 |
| 23. | Keefton | 11.1% | 2.8%(+8.29)#23 | 4.4%(+6.70)#1,761 |
| 24. | Kemp | 11.1% | 2.8%(+8.29)#24 | 4.4%(+6.70)#1,784 |
| 25. | Asher | 10.5% | 2.8%(+7.71)#25 | 4.4%(+6.12)#1,967 |
| 26. | Liberty | 10.5% | 2.8%(+7.71)#26 | 4.4%(+6.12)#1,972 |
| 27. | Turley | 10.1% | 2.8%(+7.27)#27 | 4.4%(+5.68)#2,114 |
| 28. | Lake Aluma | 9.5% | 2.8%(+6.70)#28 | 4.4%(+5.11)#2,344 |
| 29. | Goodwell | 9.5% | 2.8%(+6.68)#29 | 4.4%(+5.09)#2,348 |
| 30. | Cloud Creek | 9.4% | 2.8%(+6.61)#30 | 4.4%(+5.02)#2,370 |
| 31. | Broken Bow | 9.2% | 2.8%(+6.38)#31 | 4.4%(+4.79)#2,479 |
| 32. | Lowrey | 8.7% | 2.8%(+5.87)#32 | 4.4%(+4.29)#2,754 |
| 33. | Barnsdall | 8.5% | 2.8%(+5.73)#33 | 4.4%(+4.14)#2,842 |
| 34. | Blackwell | 8.4% | 2.8%(+5.56)#34 | 4.4%(+3.98)#2,925 |
| 35. | Dickson | 8.3% | 2.8%(+5.44)#35 | 4.4%(+3.85)#3,009 |
| 36. | Perkins | 8.3% | 2.8%(+5.44)#36 | 4.4%(+3.85)#3,015 |
| 37. | Pickett | 7.8% | 2.8%(+4.99)#37 | 4.4%(+3.40)#3,287 |
| 38. | Chelsea | 7.7% | 2.8%(+4.87)#38 | 4.4%(+3.28)#3,349 |
| 39. | Blair | 7.7% | 2.8%(+4.87)#39 | 4.4%(+3.28)#3,358 |
| 40. | Cave Spring | 7.7% | 2.8%(+4.87)#40 | 4.4%(+3.28)#3,382 |
| 41. | Okmulgee | 7.5% | 2.8%(+4.66)#41 | 4.4%(+3.08)#3,520 |
| 42. | Hinton | 7.5% | 2.8%(+4.64)#42 | 4.4%(+3.05)#3,536 |
| 43. | Sportsmen Acres | 7.4% | 2.8%(+4.59)#43 | 4.4%(+3.00)#3,573 |
| 44. | Norwood | 7.3% | 2.8%(+4.46)#44 | 4.4%(+2.87)#3,675 |
| 45. | West Siloam Springs | 7.1% | 2.8%(+4.26)#45 | 4.4%(+2.67)#3,868 |
| 46. | Welch | 7.0% | 2.8%(+4.16)#46 | 4.4%(+2.57)#3,960 |
| 47. | Brushy | 6.9% | 2.8%(+4.08)#47 | 4.4%(+2.49)#4,047 |
| 48. | Wagoner | 6.4% | 2.8%(+3.62)#48 | 4.4%(+2.04)#4,501 |
| 49. | Bug Tussle | 6.4% | 2.8%(+3.56)#49 | 4.4%(+1.97)#4,567 |
| 50. | North Miami | 6.2% | 2.8%(+3.43)#50 | 4.4%(+1.84)#4,727 |
| 51. | Le Flore | 6.2% | 2.8%(+3.43)#51 | 4.4%(+1.84)#4,735 |
| 52. | Nichols Hills | 6.0% | 2.8%(+3.13)#52 | 4.4%(+1.54)#5,090 |
| 53. | Mccurtain | 5.9% | 2.8%(+3.06)#53 | 4.4%(+1.47)#5,191 |
| 54. | Caddo | 5.7% | 2.8%(+2.89)#54 | 4.4%(+1.30)#5,383 |
| 55. | Shidler | 5.7% | 2.8%(+2.89)#55 | 4.4%(+1.30)#5,390 |
| 56. | Newkirk | 5.6% | 2.8%(+2.78)#56 | 4.4%(+1.19)#5,556 |
| 57. | Welling | 5.6% | 2.8%(+2.73)#57 | 4.4%(+1.15)#5,617 |
| 58. | Laverne | 5.5% | 2.8%(+2.68)#58 | 4.4%(+1.09)#5,695 |
| 59. | Fletcher | 5.4% | 2.8%(+2.62)#59 | 4.4%(+1.03)#5,784 |
| 60. | Burns Flat | 5.4% | 2.8%(+2.55)#60 | 4.4%(+0.959)#5,902 |
| 61. | Poteau | 5.3% | 2.8%(+2.53)#61 | 4.4%(+0.938)#5,932 |
| 62. | Bray | 5.3% | 2.8%(+2.44)#62 | 4.4%(+0.854)#6,057 |
| 63. | Prague | 5.2% | 2.8%(+2.41)#63 | 4.4%(+0.826)#6,119 |
| 64. | Fairfax | 5.2% | 2.8%(+2.40)#64 | 4.4%(+0.808)#6,154 |
| 65. | Panama | 5.0% | 2.8%(+2.18)#65 | 4.4%(+0.590)#6,535 |
| 66. | Talala | 5.0% | 2.8%(+2.18)#66 | 4.4%(+0.590)#6,554 |
| 67. | Seminole | 4.9% | 2.8%(+2.11)#67 | 4.4%(+0.517)#6,673 |
| 68. | Stillwater | 4.9% | 2.8%(+2.06)#68 | 4.4%(+0.474)#6,750 |
| 69. | Central High | 4.9% | 2.8%(+2.06)#69 | 4.4%(+0.468)#6,757 |
| 70. | Thomas | 4.8% | 2.8%(+1.94)#70 | 4.4%(+0.352)#6,974 |
| 71. | Verdigris | 4.7% | 2.8%(+1.89)#71 | 4.4%(+0.300)#7,083 |
| 72. | Norman | 4.6% | 2.8%(+1.82)#72 | 4.4%(+0.232)#7,203 |
| 73. | Fort Coffee | 4.6% | 2.8%(+1.79)#73 | 4.4%(+0.206)#7,254 |
| 74. | Tamaha | 4.5% | 2.8%(+1.72)#74 | 4.4%(+0.136)#7,392 |
| 75. | The Village | 4.5% | 2.8%(+1.70)#75 | 4.4%(+0.111)#7,437 |
| 76. | Mooreland | 4.5% | 2.8%(+1.64)#76 | 4.4%(+0.049)#7,547 |
| 77. | Roff | 4.3% | 2.8%(+1.53)#77 | 4.4%(-0.062)#7,767 |
| 78. | Duncan | 4.3% | 2.8%(+1.48)#78 | 4.4%(-0.104)#7,860 |
| 79. | Cole | 4.3% | 2.8%(+1.47)#79 | 4.4%(-0.115)#7,883 |
| 80. | Tulsa | 4.2% | 2.8%(+1.42)#80 | 4.4%(-0.166)#8,014 |
| 81. | Rush Springs | 4.2% | 2.8%(+1.42)#81 | 4.4%(-0.172)#8,026 |
| 82. | Peggs | 4.2% | 2.8%(+1.39)#82 | 4.4%(-0.199)#8,087 |
| 83. | Moore | 4.2% | 2.8%(+1.36)#83 | 4.4%(-0.230)#8,133 |
| 84. | Konawa | 4.1% | 2.8%(+1.30)#84 | 4.4%(-0.286)#8,285 |
| 85. | Marlow | 4.1% | 2.8%(+1.24)#85 | 4.4%(-0.353)#8,427 |
| 86. | Cushing | 4.0% | 2.8%(+1.21)#86 | 4.4%(-0.376)#8,470 |
| 87. | Collinsville | 4.0% | 2.8%(+1.19)#87 | 4.4%(-0.398)#8,522 |
| 88. | Weleetka | 4.0% | 2.8%(+1.18)#88 | 4.4%(-0.410)#8,552 |
| 89. | Lamont | 4.0% | 2.8%(+1.18)#89 | 4.4%(-0.410)#8,566 |
| 90. | Camargo | 4.0% | 2.8%(+1.18)#90 | 4.4%(-0.410)#8,574 |
| 91. | Sterling | 3.9% | 2.8%(+1.10)#91 | 4.4%(-0.488)#8,730 |
| 92. | Briggs | 3.9% | 2.8%(+1.07)#92 | 4.4%(-0.521)#8,818 |
| 93. | Winchester | 3.8% | 2.8%(+1.03)#93 | 4.4%(-0.563)#8,934 |
| 94. | Lawton | 3.8% | 2.8%(+1.02)#94 | 4.4%(-0.573)#8,966 |
| 95. | Snyder | 3.8% | 2.8%(+0.953)#95 | 4.4%(-0.636)#9,088 |
| 96. | Idabel | 3.8% | 2.8%(+0.936)#96 | 4.4%(-0.653)#9,116 |
| 97. | Hominy | 3.7% | 2.8%(+0.910)#97 | 4.4%(-0.678)#9,173 |
| 98. | Choctaw | 3.7% | 2.8%(+0.875)#98 | 4.4%(-0.713)#9,275 |
| 99. | Commerce | 3.6% | 2.8%(+0.829)#99 | 4.4%(-0.760)#9,364 |
| 100. | Alva | 3.6% | 2.8%(+0.788)#100 | 4.4%(-0.800)#9,473 |
Common Questions
What are the Top 10 Cities with the Highest Percentage of Population with a Degree in Literature and Languages in Oklahoma?
Top 10 Cities with the Highest Percentage of Population with a Degree in Literature and Languages in Oklahoma are:
What city has the Highest Percentage of Population with a Degree in Literature and Languages in Oklahoma?
Elmer has the Highest Percentage of Population with a Degree in Literature and Languages in Oklahoma with 60.0%.
What is the Percentage of Population with a Degree in Literature and Languages in the State of Oklahoma?
Percentage of Population with a Degree in Literature and Languages in Oklahoma is 2.8%.
What is the Percentage of Population with a Degree in Literature and Languages in the United States?
Percentage of Population with a Degree in Literature and Languages in the United States is 4.4%.