Cities with the Highest Percentage of Population with a Degree in Literature and Languages in Utah
RELATED REPORTS & OPTIONS
Literature and Languages
Utah
Compare Cities
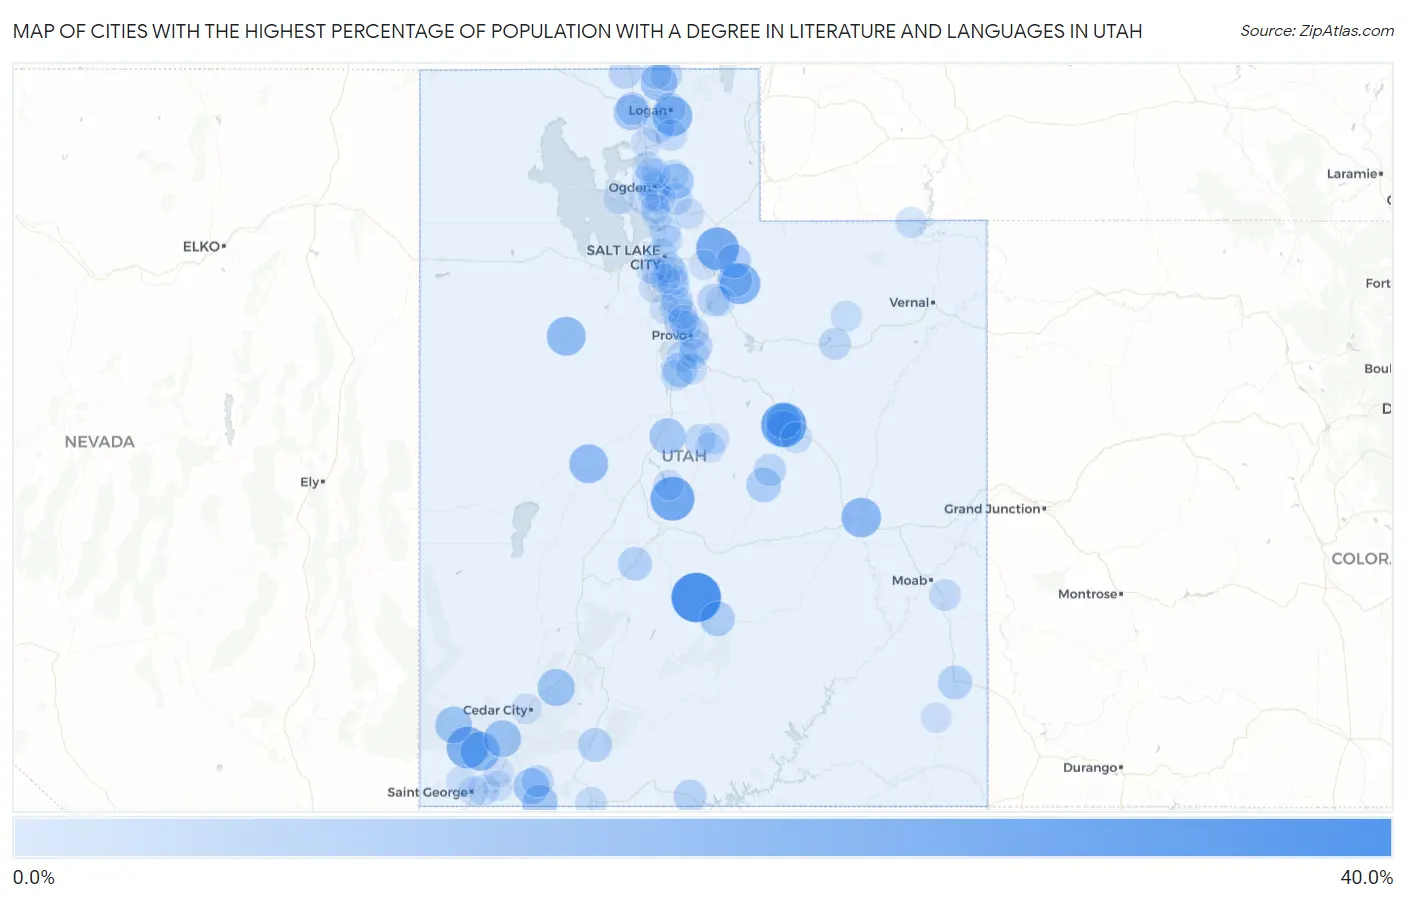
Map of Cities with the Highest Percentage of Population with a Degree in Literature and Languages in Utah
0.0%
40.0%
Cities with the Highest Percentage of Population with a Degree in Literature and Languages in Utah
| City | % Graduates | vs State | vs National | |
| 1. | Fremont | 35.3% | 4.8%(+30.5)#1 | 4.4%(+30.9)#208 |
| 2. | Carbonville | 27.9% | 4.8%(+23.1)#2 | 4.4%(+23.5)#352 |
| 3. | Brighton | 27.4% | 4.8%(+22.6)#3 | 4.4%(+23.0)#366 |
| 4. | Centerfield | 26.2% | 4.8%(+21.4)#4 | 4.4%(+21.8)#397 |
| 5. | Wanship | 24.4% | 4.8%(+19.6)#5 | 4.4%(+20.0)#465 |
| 6. | Central | 22.4% | 4.8%(+17.6)#6 | 4.4%(+18.0)#521 |
| 7. | Woodland | 20.8% | 4.8%(+16.0)#7 | 4.4%(+16.4)#603 |
| 8. | Millville | 19.5% | 4.8%(+14.7)#8 | 4.4%(+15.1)#678 |
| 9. | Green River | 19.2% | 4.8%(+14.4)#9 | 4.4%(+14.8)#690 |
| 10. | Pine Valley | 18.5% | 4.8%(+13.7)#10 | 4.4%(+14.1)#745 |
| 11. | Dugway | 18.2% | 4.8%(+13.4)#11 | 4.4%(+13.8)#766 |
| 12. | Delta | 17.9% | 4.8%(+13.1)#12 | 4.4%(+13.5)#798 |
| 13. | New Harmony | 15.2% | 4.8%(+10.3)#13 | 4.4%(+10.7)#1,042 |
| 14. | Parowan | 15.1% | 4.8%(+10.3)#14 | 4.4%(+10.7)#1,049 |
| 15. | Trenton | 15.0% | 4.8%(+10.2)#15 | 4.4%(+10.6)#1,058 |
| 16. | Enterprise | 14.7% | 4.8%(+9.95)#16 | 4.4%(+10.3)#1,084 |
| 17. | West Wood | 13.7% | 4.8%(+8.90)#17 | 4.4%(+9.30)#1,274 |
| 18. | Rockville | 13.6% | 4.8%(+8.83)#18 | 4.4%(+9.23)#1,291 |
| 19. | Levan | 13.4% | 4.8%(+8.61)#19 | 4.4%(+9.00)#1,330 |
| 20. | Spring Glen | 12.8% | 4.8%(+8.04)#20 | 4.4%(+8.43)#1,417 |
| 21. | Hildale | 12.7% | 4.8%(+7.91)#21 | 4.4%(+8.30)#1,447 |
| 22. | Tremonton | 12.6% | 4.8%(+7.78)#22 | 4.4%(+8.18)#1,465 |
| 23. | Huntsville | 12.1% | 4.8%(+7.27)#23 | 4.4%(+7.66)#1,559 |
| 24. | Torrey | 11.5% | 4.8%(+6.74)#24 | 4.4%(+7.13)#1,666 |
| 25. | Castle Dale | 11.4% | 4.8%(+6.58)#25 | 4.4%(+6.97)#1,696 |
| 26. | Spring Lake | 11.1% | 4.8%(+6.31)#26 | 4.4%(+6.70)#1,769 |
| 27. | Francis | 11.0% | 4.8%(+6.16)#27 | 4.4%(+6.56)#1,829 |
| 28. | Oakley | 10.8% | 4.8%(+5.98)#28 | 4.4%(+6.37)#1,888 |
| 29. | Monticello | 10.4% | 4.8%(+5.56)#29 | 4.4%(+5.95)#2,018 |
| 30. | Alton | 10.3% | 4.8%(+5.45)#30 | 4.4%(+5.85)#2,055 |
| 31. | Elsinore | 10.1% | 4.8%(+5.31)#31 | 4.4%(+5.70)#2,108 |
| 32. | Garland | 9.2% | 4.8%(+4.35)#32 | 4.4%(+4.75)#2,495 |
| 33. | Big Water | 8.9% | 4.8%(+4.09)#33 | 4.4%(+4.48)#2,656 |
| 34. | Springville | 8.6% | 4.8%(+3.77)#34 | 4.4%(+4.16)#2,828 |
| 35. | Provo | 8.4% | 4.8%(+3.56)#35 | 4.4%(+3.95)#2,945 |
| 36. | Charleston | 8.3% | 4.8%(+3.53)#36 | 4.4%(+3.92)#2,967 |
| 37. | Portage | 8.3% | 4.8%(+3.53)#37 | 4.4%(+3.92)#2,979 |
| 38. | Huntington | 7.9% | 4.8%(+3.09)#38 | 4.4%(+3.49)#3,232 |
| 39. | Washington Terrace | 7.8% | 4.8%(+2.97)#39 | 4.4%(+3.36)#3,311 |
| 40. | Wellsville | 7.8% | 4.8%(+2.96)#40 | 4.4%(+3.35)#3,316 |
| 41. | Highland | 7.6% | 4.8%(+2.79)#41 | 4.4%(+3.19)#3,445 |
| 42. | Springdale | 7.5% | 4.8%(+2.75)#42 | 4.4%(+3.14)#3,478 |
| 43. | Granite | 7.5% | 4.8%(+2.72)#43 | 4.4%(+3.11)#3,491 |
| 44. | Logan | 7.5% | 4.8%(+2.66)#44 | 4.4%(+3.06)#3,533 |
| 45. | Mountain Green | 7.5% | 4.8%(+2.66)#45 | 4.4%(+3.05)#3,535 |
| 46. | Duchesne | 7.4% | 4.8%(+2.55)#46 | 4.4%(+2.94)#3,621 |
| 47. | Lewiston | 7.3% | 4.8%(+2.51)#47 | 4.4%(+2.91)#3,645 |
| 48. | Moroni | 7.1% | 4.8%(+2.34)#48 | 4.4%(+2.73)#3,782 |
| 49. | Spanish Valley | 6.8% | 4.8%(+2.02)#49 | 4.4%(+2.41)#4,131 |
| 50. | Kanab | 6.6% | 4.8%(+1.76)#50 | 4.4%(+2.16)#4,362 |
| 51. | Paradise | 6.6% | 4.8%(+1.76)#51 | 4.4%(+2.15)#4,369 |
| 52. | Cottonwood Heights | 6.5% | 4.8%(+1.68)#52 | 4.4%(+2.07)#4,452 |
| 53. | Benjamin | 6.5% | 4.8%(+1.67)#53 | 4.4%(+2.07)#4,467 |
| 54. | Alpine | 6.5% | 4.8%(+1.65)#54 | 4.4%(+2.04)#4,482 |
| 55. | Centerville | 6.4% | 4.8%(+1.59)#55 | 4.4%(+1.98)#4,549 |
| 56. | Santaquin | 6.3% | 4.8%(+1.48)#56 | 4.4%(+1.88)#4,672 |
| 57. | Holladay | 6.3% | 4.8%(+1.47)#57 | 4.4%(+1.86)#4,685 |
| 58. | Vineyard | 6.2% | 4.8%(+1.43)#58 | 4.4%(+1.82)#4,748 |
| 59. | Ogden | 6.2% | 4.8%(+1.36)#59 | 4.4%(+1.76)#4,820 |
| 60. | Orem | 6.1% | 4.8%(+1.33)#60 | 4.4%(+1.72)#4,866 |
| 61. | Altamont | 6.1% | 4.8%(+1.32)#61 | 4.4%(+1.71)#4,880 |
| 62. | Manila | 6.1% | 4.8%(+1.32)#62 | 4.4%(+1.71)#4,885 |
| 63. | Wellington | 6.1% | 4.8%(+1.26)#63 | 4.4%(+1.65)#4,955 |
| 64. | Woodland Hills | 6.1% | 4.8%(+1.26)#64 | 4.4%(+1.65)#4,957 |
| 65. | Cornish | 6.1% | 4.8%(+1.26)#65 | 4.4%(+1.65)#4,967 |
| 66. | Mount Pleasant | 6.0% | 4.8%(+1.25)#66 | 4.4%(+1.64)#4,985 |
| 67. | Salt Lake City | 6.0% | 4.8%(+1.15)#67 | 4.4%(+1.55)#5,087 |
| 68. | Washington | 5.9% | 4.8%(+1.12)#68 | 4.4%(+1.51)#5,125 |
| 69. | Marriott Slaterville | 5.9% | 4.8%(+1.12)#69 | 4.4%(+1.51)#5,126 |
| 70. | Millcreek | 5.9% | 4.8%(+1.08)#70 | 4.4%(+1.47)#5,206 |
| 71. | Uintah | 5.7% | 4.8%(+0.929)#71 | 4.4%(+1.32)#5,367 |
| 72. | Hooper | 5.7% | 4.8%(+0.894)#72 | 4.4%(+1.29)#5,418 |
| 73. | Spanish Fork | 5.6% | 4.8%(+0.845)#73 | 4.4%(+1.24)#5,489 |
| 74. | Eden | 5.4% | 4.8%(+0.640)#74 | 4.4%(+1.03)#5,785 |
| 75. | Morgan | 5.3% | 4.8%(+0.530)#75 | 4.4%(+0.922)#5,954 |
| 76. | Fayette | 5.3% | 4.8%(+0.461)#76 | 4.4%(+0.854)#6,069 |
| 77. | Cedar City | 5.1% | 4.8%(+0.334)#77 | 4.4%(+0.726)#6,297 |
| 78. | Brigham City | 5.1% | 4.8%(+0.297)#78 | 4.4%(+0.690)#6,354 |
| 79. | Spring City | 5.1% | 4.8%(+0.289)#79 | 4.4%(+0.681)#6,371 |
| 80. | Pleasant Grove | 5.1% | 4.8%(+0.278)#80 | 4.4%(+0.671)#6,397 |
| 81. | Kaysville | 5.0% | 4.8%(+0.241)#81 | 4.4%(+0.633)#6,460 |
| 82. | Hurricane | 5.0% | 4.8%(+0.231)#82 | 4.4%(+0.623)#6,482 |
| 83. | Blanding | 5.0% | 4.8%(+0.198)#83 | 4.4%(+0.590)#6,530 |
| 84. | Taylorsville | 5.0% | 4.8%(+0.189)#84 | 4.4%(+0.581)#6,564 |
| 85. | Lehi | 5.0% | 4.8%(+0.188)#85 | 4.4%(+0.581)#6,565 |
| 86. | Lindon | 5.0% | 4.8%(+0.149)#86 | 4.4%(+0.542)#6,622 |
| 87. | Bountiful | 4.9% | 4.8%(+0.101)#87 | 4.4%(+0.494)#6,712 |
| 88. | Pleasant View | 4.9% | 4.8%(+0.092)#88 | 4.4%(+0.484)#6,730 |
| 89. | Leeds | 4.8% | 4.8%(+0.037)#89 | 4.4%(+0.429)#6,831 |
| 90. | South Jordan | 4.8% | 4.8%(-0.007)#90 | 4.4%(+0.385)#6,909 |
| 91. | Ivins | 4.8% | 4.8%(-0.010)#91 | 4.4%(+0.383)#6,917 |
| 92. | Clinton | 4.8% | 4.8%(-0.026)#92 | 4.4%(+0.366)#6,945 |
| 93. | West Valley City | 4.8% | 4.8%(-0.035)#93 | 4.4%(+0.358)#6,961 |
| 94. | Daniel | 4.7% | 4.8%(-0.085)#94 | 4.4%(+0.307)#7,072 |
| 95. | Midvale | 4.7% | 4.8%(-0.107)#95 | 4.4%(+0.285)#7,114 |
| 96. | Layton | 4.7% | 4.8%(-0.124)#96 | 4.4%(+0.269)#7,144 |
| 97. | North Ogden | 4.7% | 4.8%(-0.127)#97 | 4.4%(+0.265)#7,149 |
| 98. | St George | 4.6% | 4.8%(-0.228)#98 | 4.4%(+0.164)#7,316 |
| 99. | Snyderville | 4.5% | 4.8%(-0.260)#99 | 4.4%(+0.133)#7,398 |
| 100. | South Willard | 4.5% | 4.8%(-0.331)#100 | 4.4%(+0.061)#7,522 |
Common Questions
What are the Top 10 Cities with the Highest Percentage of Population with a Degree in Literature and Languages in Utah?
Top 10 Cities with the Highest Percentage of Population with a Degree in Literature and Languages in Utah are:
#1
35.3%
#2
27.9%
#3
26.2%
#4
24.4%
#5
22.4%
#6
20.8%
#7
19.5%
#8
19.2%
#9
18.5%
#10
18.2%
What city has the Highest Percentage of Population with a Degree in Literature and Languages in Utah?
Fremont has the Highest Percentage of Population with a Degree in Literature and Languages in Utah with 35.3%.
What is the Percentage of Population with a Degree in Literature and Languages in the State of Utah?
Percentage of Population with a Degree in Literature and Languages in Utah is 4.8%.
What is the Percentage of Population with a Degree in Literature and Languages in the United States?
Percentage of Population with a Degree in Literature and Languages in the United States is 4.4%.