Cities with the Highest Percentage of Population with a Degree in Literature and Languages in Illinois
RELATED REPORTS & OPTIONS
Literature and Languages
Illinois
Compare Cities
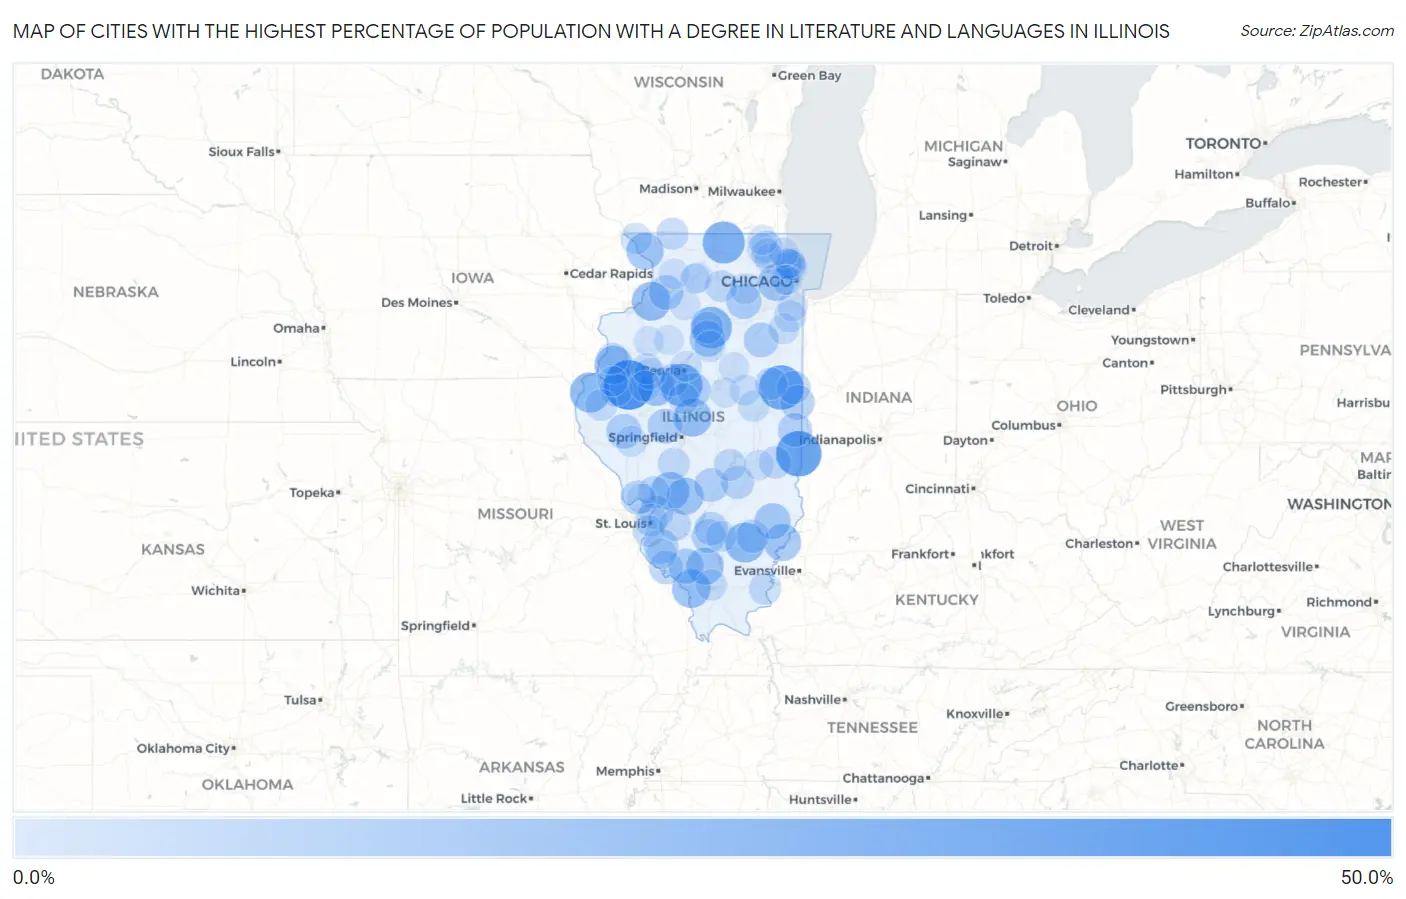
Map of Cities with the Highest Percentage of Population with a Degree in Literature and Languages in Illinois
0.0%
50.0%
Cities with the Highest Percentage of Population with a Degree in Literature and Languages in Illinois
| City | % Graduates | vs State | vs National | |
| 1. | Bardolph | 42.1% | 4.3%(+37.8)#1 | 4.4%(+37.7)#141 |
| 2. | Vermilion | 35.0% | 4.3%(+30.7)#2 | 4.4%(+30.6)#214 |
| 3. | Rankin | 33.3% | 4.3%(+29.0)#3 | 4.4%(+28.9)#228 |
| 4. | South Pekin | 29.7% | 4.3%(+25.4)#4 | 4.4%(+25.3)#310 |
| 5. | Caledonia | 28.6% | 4.3%(+24.3)#5 | 4.4%(+24.2)#336 |
| 6. | Cedar Point | 27.3% | 4.3%(+23.0)#6 | 4.4%(+22.9)#367 |
| 7. | Sims | 25.0% | 4.3%(+20.7)#7 | 4.4%(+20.6)#431 |
| 8. | Elvaston | 25.0% | 4.3%(+20.7)#8 | 4.4%(+20.6)#433 |
| 9. | Hillsdale | 23.1% | 4.3%(+18.8)#9 | 4.4%(+18.7)#502 |
| 10. | Wilsonville | 22.2% | 4.3%(+17.9)#10 | 4.4%(+17.8)#526 |
| 11. | Gorham | 22.2% | 4.3%(+17.9)#11 | 4.4%(+17.8)#530 |
| 12. | Broadwell | 22.2% | 4.3%(+17.9)#12 | 4.4%(+17.8)#536 |
| 13. | Media | 22.2% | 4.3%(+17.9)#13 | 4.4%(+17.8)#538 |
| 14. | Hanover | 20.0% | 4.3%(+15.7)#14 | 4.4%(+15.6)#632 |
| 15. | Sorento | 20.0% | 4.3%(+15.7)#15 | 4.4%(+15.6)#635 |
| 16. | Bryant | 20.0% | 4.3%(+15.7)#16 | 4.4%(+15.6)#643 |
| 17. | St Johns | 20.0% | 4.3%(+15.7)#17 | 4.4%(+15.6)#645 |
| 18. | Keensburg | 20.0% | 4.3%(+15.7)#18 | 4.4%(+15.6)#648 |
| 19. | Oakbrook Terrace | 19.3% | 4.3%(+15.0)#19 | 4.4%(+14.9)#686 |
| 20. | Calhoun | 18.2% | 4.3%(+13.9)#20 | 4.4%(+13.8)#780 |
| 21. | Magnolia | 17.6% | 4.3%(+13.4)#21 | 4.4%(+13.2)#823 |
| 22. | Cutler | 16.7% | 4.3%(+12.4)#22 | 4.4%(+12.3)#891 |
| 23. | Millbrook | 16.7% | 4.3%(+12.4)#23 | 4.4%(+12.3)#892 |
| 24. | Tallula | 15.8% | 4.3%(+11.5)#24 | 4.4%(+11.4)#968 |
| 25. | Versailles | 15.8% | 4.3%(+11.5)#25 | 4.4%(+11.4)#973 |
| 26. | Reddick | 15.8% | 4.3%(+11.5)#26 | 4.4%(+11.4)#975 |
| 27. | Lyndon | 15.7% | 4.3%(+11.4)#27 | 4.4%(+11.3)#981 |
| 28. | Ophiem | 15.6% | 4.3%(+11.3)#28 | 4.4%(+11.1)#997 |
| 29. | Hecker | 15.4% | 4.3%(+11.1)#29 | 4.4%(+11.0)#1,012 |
| 30. | Bismarck | 15.3% | 4.3%(+11.0)#30 | 4.4%(+10.8)#1,035 |
| 31. | Ridge Farm | 14.7% | 4.3%(+10.4)#31 | 4.4%(+10.3)#1,090 |
| 32. | Hopedale | 14.7% | 4.3%(+10.4)#32 | 4.4%(+10.3)#1,095 |
| 33. | Ramsey | 14.6% | 4.3%(+10.3)#33 | 4.4%(+10.2)#1,105 |
| 34. | Irvington | 14.6% | 4.3%(+10.3)#34 | 4.4%(+10.2)#1,108 |
| 35. | Mitchell | 14.3% | 4.3%(+9.99)#35 | 4.4%(+9.88)#1,143 |
| 36. | Ellis Grove | 14.3% | 4.3%(+9.99)#36 | 4.4%(+9.88)#1,159 |
| 37. | Central City | 13.8% | 4.3%(+9.55)#37 | 4.4%(+9.44)#1,247 |
| 38. | Grafton | 13.8% | 4.3%(+9.50)#38 | 4.4%(+9.38)#1,258 |
| 39. | Campbell's Island | 13.6% | 4.3%(+9.26)#39 | 4.4%(+9.15)#1,302 |
| 40. | Jeffersonville | 13.3% | 4.3%(+9.04)#40 | 4.4%(+8.92)#1,347 |
| 41. | Shumway | 13.3% | 4.3%(+9.04)#41 | 4.4%(+8.92)#1,352 |
| 42. | Hoopeston | 13.1% | 4.3%(+8.77)#42 | 4.4%(+8.65)#1,379 |
| 43. | Colchester | 12.1% | 4.3%(+7.77)#43 | 4.4%(+7.66)#1,557 |
| 44. | Glasford | 12.0% | 4.3%(+7.70)#44 | 4.4%(+7.59)#1,567 |
| 45. | Brighton | 11.9% | 4.3%(+7.65)#45 | 4.4%(+7.54)#1,576 |
| 46. | Venice | 11.9% | 4.3%(+7.57)#46 | 4.4%(+7.45)#1,589 |
| 47. | Westfield | 11.8% | 4.3%(+7.47)#47 | 4.4%(+7.36)#1,616 |
| 48. | Loda | 11.8% | 4.3%(+7.47)#48 | 4.4%(+7.36)#1,621 |
| 49. | Shelbyville | 11.5% | 4.3%(+7.16)#49 | 4.4%(+7.04)#1,679 |
| 50. | Dupo | 11.3% | 4.3%(+7.04)#50 | 4.4%(+6.92)#1,710 |
| 51. | Shawneetown | 11.3% | 4.3%(+6.95)#51 | 4.4%(+6.84)#1,727 |
| 52. | Summerfield | 11.1% | 4.3%(+6.82)#52 | 4.4%(+6.70)#1,773 |
| 53. | Lee | 11.1% | 4.3%(+6.82)#53 | 4.4%(+6.70)#1,778 |
| 54. | Winslow | 11.1% | 4.3%(+6.82)#54 | 4.4%(+6.70)#1,779 |
| 55. | Standard | 11.1% | 4.3%(+6.82)#55 | 4.4%(+6.70)#1,781 |
| 56. | Girard | 11.0% | 4.3%(+6.71)#56 | 4.4%(+6.60)#1,818 |
| 57. | Bowen | 10.8% | 4.3%(+6.52)#57 | 4.4%(+6.40)#1,877 |
| 58. | Biggsville | 10.7% | 4.3%(+6.42)#58 | 4.4%(+6.30)#1,911 |
| 59. | Monee | 10.6% | 4.3%(+6.29)#59 | 4.4%(+6.17)#1,951 |
| 60. | Fairview | 10.3% | 4.3%(+6.05)#60 | 4.4%(+5.94)#2,027 |
| 61. | Volo | 10.3% | 4.3%(+6.04)#61 | 4.4%(+5.92)#2,031 |
| 62. | Galena | 10.2% | 4.3%(+5.95)#62 | 4.4%(+5.83)#2,062 |
| 63. | Cambria | 10.0% | 4.3%(+5.70)#63 | 4.4%(+5.59)#2,142 |
| 64. | Toluca | 9.9% | 4.3%(+5.62)#64 | 4.4%(+5.51)#2,185 |
| 65. | Holiday Hills | 9.9% | 4.3%(+5.59)#65 | 4.4%(+5.48)#2,192 |
| 66. | Bluffs | 9.7% | 4.3%(+5.41)#66 | 4.4%(+5.29)#2,256 |
| 67. | Lake Of The Woods | 9.6% | 4.3%(+5.29)#67 | 4.4%(+5.17)#2,310 |
| 68. | Dix | 9.5% | 4.3%(+5.23)#68 | 4.4%(+5.11)#2,329 |
| 69. | London Mills | 9.5% | 4.3%(+5.23)#69 | 4.4%(+5.11)#2,334 |
| 70. | Smithfield | 9.5% | 4.3%(+5.23)#70 | 4.4%(+5.11)#2,342 |
| 71. | Big Rock | 9.4% | 4.3%(+5.12)#71 | 4.4%(+5.01)#2,377 |
| 72. | Arbury Hills | 9.3% | 4.3%(+4.96)#72 | 4.4%(+4.85)#2,445 |
| 73. | Manteno | 9.2% | 4.3%(+4.92)#73 | 4.4%(+4.81)#2,465 |
| 74. | Red Bud | 9.2% | 4.3%(+4.90)#74 | 4.4%(+4.79)#2,480 |
| 75. | Evanston | 9.2% | 4.3%(+4.88)#75 | 4.4%(+4.76)#2,489 |
| 76. | Peoria Heights | 9.2% | 4.3%(+4.87)#76 | 4.4%(+4.76)#2,492 |
| 77. | Saybrook | 9.1% | 4.3%(+4.80)#77 | 4.4%(+4.68)#2,519 |
| 78. | Deer Park | 9.0% | 4.3%(+4.66)#78 | 4.4%(+4.55)#2,610 |
| 79. | Wilmette | 8.9% | 4.3%(+4.65)#79 | 4.4%(+4.54)#2,618 |
| 80. | Kenilworth | 8.9% | 4.3%(+4.65)#80 | 4.4%(+4.53)#2,623 |
| 81. | San Jose | 8.9% | 4.3%(+4.59)#81 | 4.4%(+4.48)#2,655 |
| 82. | Winnetka | 8.8% | 4.3%(+4.46)#82 | 4.4%(+4.35)#2,714 |
| 83. | Milledgeville | 8.7% | 4.3%(+4.40)#83 | 4.4%(+4.29)#2,746 |
| 84. | Northfield | 8.6% | 4.3%(+4.33)#84 | 4.4%(+4.21)#2,796 |
| 85. | Chenoa | 8.5% | 4.3%(+4.25)#85 | 4.4%(+4.14)#2,841 |
| 86. | Walnut | 8.5% | 4.3%(+4.18)#86 | 4.4%(+4.06)#2,884 |
| 87. | Lost Nation | 8.4% | 4.3%(+4.14)#87 | 4.4%(+4.02)#2,898 |
| 88. | Flossmoor | 8.4% | 4.3%(+4.11)#88 | 4.4%(+3.99)#2,913 |
| 89. | Tower Lakes | 8.4% | 4.3%(+4.07)#89 | 4.4%(+3.96)#2,941 |
| 90. | Lerna | 8.3% | 4.3%(+4.04)#90 | 4.4%(+3.92)#2,978 |
| 91. | Grand Detour | 8.3% | 4.3%(+3.96)#91 | 4.4%(+3.85)#3,017 |
| 92. | Oneida | 8.2% | 4.3%(+3.90)#92 | 4.4%(+3.79)#3,052 |
| 93. | Elsah | 8.2% | 4.3%(+3.87)#93 | 4.4%(+3.75)#3,066 |
| 94. | Lake Forest | 8.1% | 4.3%(+3.84)#94 | 4.4%(+3.73)#3,087 |
| 95. | Toulon | 8.1% | 4.3%(+3.81)#95 | 4.4%(+3.70)#3,106 |
| 96. | Blandinsville | 8.1% | 4.3%(+3.81)#96 | 4.4%(+3.70)#3,111 |
| 97. | Oak Park | 8.1% | 4.3%(+3.77)#97 | 4.4%(+3.66)#3,135 |
| 98. | Pistakee Highlands | 8.0% | 4.3%(+3.69)#98 | 4.4%(+3.57)#3,188 |
| 99. | Downs | 8.0% | 4.3%(+3.67)#99 | 4.4%(+3.56)#3,192 |
| 100. | River Forest | 7.9% | 4.3%(+3.65)#100 | 4.4%(+3.53)#3,203 |
Common Questions
What are the Top 10 Cities with the Highest Percentage of Population with a Degree in Literature and Languages in Illinois?
Top 10 Cities with the Highest Percentage of Population with a Degree in Literature and Languages in Illinois are:
#1
42.1%
#2
35.0%
#3
33.3%
#4
29.7%
#5
28.6%
#6
27.3%
#7
25.0%
#8
25.0%
#9
23.1%
#10
22.2%
What city has the Highest Percentage of Population with a Degree in Literature and Languages in Illinois?
Bardolph has the Highest Percentage of Population with a Degree in Literature and Languages in Illinois with 42.1%.
What is the Percentage of Population with a Degree in Literature and Languages in the State of Illinois?
Percentage of Population with a Degree in Literature and Languages in Illinois is 4.3%.
What is the Percentage of Population with a Degree in Literature and Languages in the United States?
Percentage of Population with a Degree in Literature and Languages in the United States is 4.4%.