Cities with the Highest Percentage of Population with a Degree in Literature and Languages in Mississippi
RELATED REPORTS & OPTIONS
Literature and Languages
Mississippi
Compare Cities
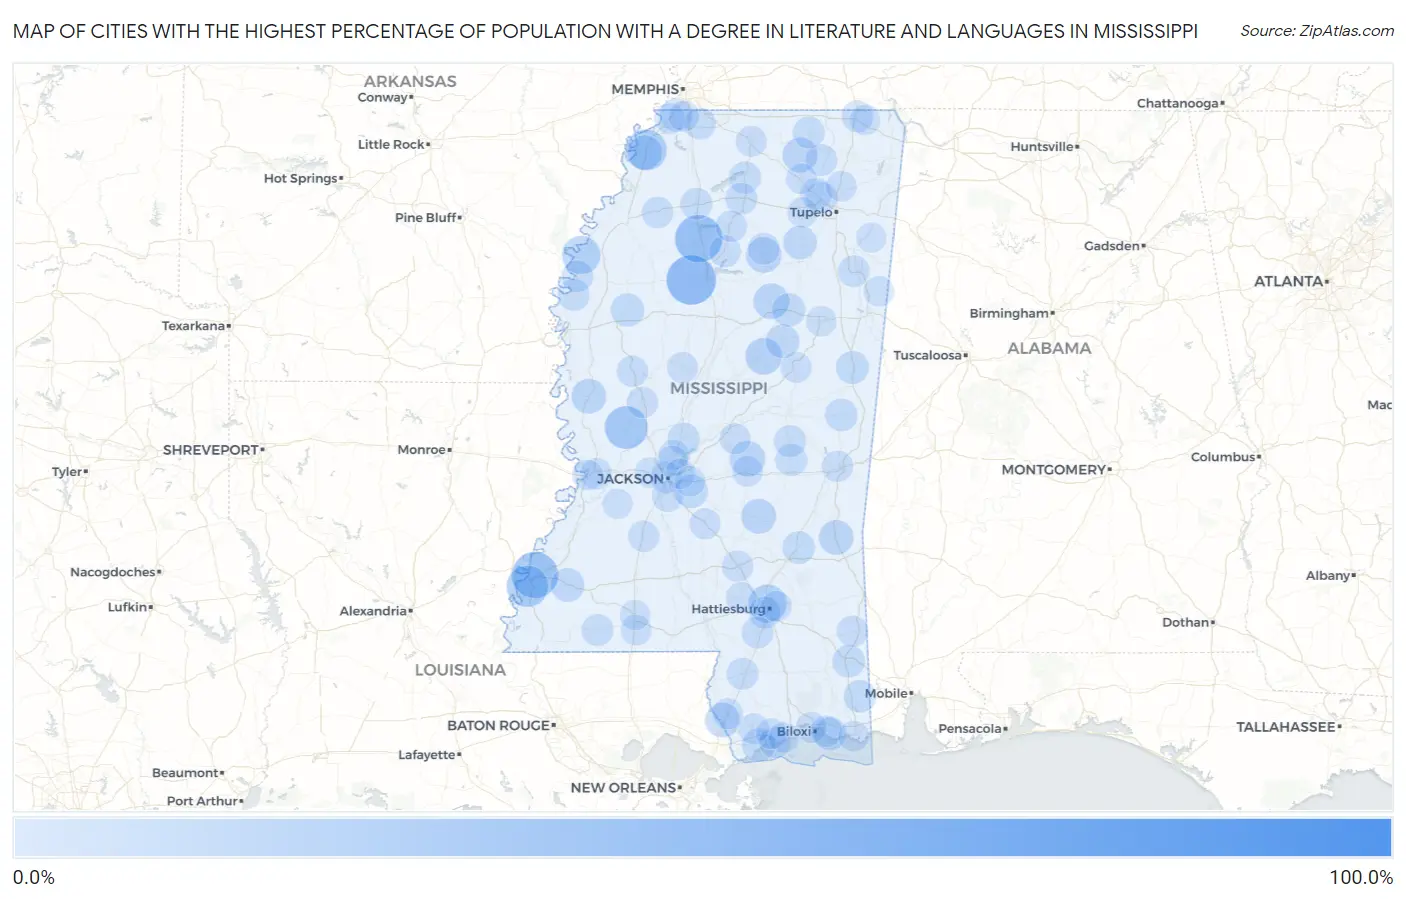
Map of Cities with the Highest Percentage of Population with a Degree in Literature and Languages in Mississippi
0.0%
100.0%
Cities with the Highest Percentage of Population with a Degree in Literature and Languages in Mississippi
| City | % Graduates | vs State | vs National | |
| 1. | Agricola | 100.0% | 2.8%(+97.2)#1 | 4.4%(+95.6)#5 |
| 2. | Holcomb | 44.4% | 2.8%(+41.6)#2 | 4.4%(+40.0)#123 |
| 3. | Oakland | 40.0% | 2.8%(+37.2)#3 | 4.4%(+35.6)#149 |
| 4. | Morgantown | 37.3% | 2.8%(+34.5)#4 | 4.4%(+32.9)#181 |
| 5. | Satartia | 30.0% | 2.8%(+27.2)#5 | 4.4%(+25.6)#305 |
| 6. | Cloverdale | 26.9% | 2.8%(+24.0)#6 | 4.4%(+22.5)#376 |
| 7. | North Tunica | 25.7% | 2.8%(+22.9)#7 | 4.4%(+21.3)#408 |
| 8. | Gunnison | 20.0% | 2.8%(+17.2)#8 | 4.4%(+15.6)#638 |
| 9. | Glendale | 19.8% | 2.8%(+17.0)#9 | 4.4%(+15.4)#661 |
| 10. | Mccool | 16.7% | 2.8%(+13.8)#10 | 4.4%(+12.3)#907 |
| 11. | Walthall | 14.6% | 2.8%(+11.8)#11 | 4.4%(+10.2)#1,100 |
| 12. | Hillsboro | 14.4% | 2.8%(+11.6)#12 | 4.4%(+9.99)#1,126 |
| 13. | Pittsboro | 14.3% | 2.8%(+11.5)#13 | 4.4%(+9.88)#1,164 |
| 14. | Blue Mountain | 13.0% | 2.8%(+10.2)#14 | 4.4%(+8.58)#1,389 |
| 15. | Rolling Fork | 12.5% | 2.8%(+9.67)#15 | 4.4%(+8.09)#1,473 |
| 16. | Shubuta | 12.5% | 2.8%(+9.67)#16 | 4.4%(+8.09)#1,481 |
| 17. | Sylvarena | 12.5% | 2.8%(+9.67)#17 | 4.4%(+8.09)#1,498 |
| 18. | Nicholson | 12.3% | 2.8%(+9.42)#18 | 4.4%(+7.85)#1,530 |
| 19. | Tunica | 11.7% | 2.8%(+8.86)#19 | 4.4%(+7.29)#1,636 |
| 20. | Roxie | 10.5% | 2.8%(+7.69)#20 | 4.4%(+6.12)#1,961 |
| 21. | Ackerman | 10.5% | 2.8%(+7.67)#21 | 4.4%(+6.09)#1,980 |
| 22. | New Houlka | 10.3% | 2.8%(+7.42)#22 | 4.4%(+5.85)#2,053 |
| 23. | Robinhood | 9.7% | 2.8%(+6.87)#23 | 4.4%(+5.30)#2,253 |
| 24. | Mathiston | 9.7% | 2.8%(+6.82)#24 | 4.4%(+5.25)#2,275 |
| 25. | Sunflower | 9.6% | 2.8%(+6.76)#25 | 4.4%(+5.18)#2,305 |
| 26. | Waveland | 9.3% | 2.8%(+6.47)#26 | 4.4%(+4.89)#2,418 |
| 27. | Macon | 8.9% | 2.8%(+6.08)#27 | 4.4%(+4.51)#2,635 |
| 28. | Gulf Park Estates | 8.5% | 2.8%(+5.71)#28 | 4.4%(+4.13)#2,846 |
| 29. | Lynchburg | 8.4% | 2.8%(+5.54)#29 | 4.4%(+3.96)#2,938 |
| 30. | Lucedale | 8.0% | 2.8%(+5.20)#30 | 4.4%(+3.62)#3,154 |
| 31. | Sandersville | 8.0% | 2.8%(+5.17)#31 | 4.4%(+3.59)#3,176 |
| 32. | De Kalb | 7.9% | 2.8%(+5.10)#32 | 4.4%(+3.53)#3,205 |
| 33. | Oak Grove | 7.9% | 2.8%(+5.09)#33 | 4.4%(+3.51)#3,215 |
| 34. | Hurley | 7.8% | 2.8%(+4.93)#34 | 4.4%(+3.36)#3,313 |
| 35. | Canton | 7.1% | 2.8%(+4.28)#35 | 4.4%(+2.70)#3,834 |
| 36. | Decatur | 6.8% | 2.8%(+3.98)#36 | 4.4%(+2.41)#4,126 |
| 37. | Abbeville | 6.8% | 2.8%(+3.98)#37 | 4.4%(+2.41)#4,132 |
| 38. | Hattiesburg | 6.7% | 2.8%(+3.88)#38 | 4.4%(+2.30)#4,223 |
| 39. | Union | 6.7% | 2.8%(+3.87)#39 | 4.4%(+2.29)#4,238 |
| 40. | Batesville | 6.4% | 2.8%(+3.55)#40 | 4.4%(+1.98)#4,554 |
| 41. | Liberty | 6.4% | 2.8%(+3.53)#41 | 4.4%(+1.95)#4,589 |
| 42. | Poplarville | 6.3% | 2.8%(+3.50)#42 | 4.4%(+1.92)#4,621 |
| 43. | Coffeeville | 6.2% | 2.8%(+3.42)#43 | 4.4%(+1.84)#4,711 |
| 44. | Dumas | 6.2% | 2.8%(+3.42)#44 | 4.4%(+1.84)#4,725 |
| 45. | Purvis | 6.2% | 2.8%(+3.39)#45 | 4.4%(+1.82)#4,758 |
| 46. | Oxford | 6.2% | 2.8%(+3.34)#46 | 4.4%(+1.77)#4,805 |
| 47. | Bruce | 6.2% | 2.8%(+3.33)#47 | 4.4%(+1.75)#4,826 |
| 48. | Falkner | 6.1% | 2.8%(+3.29)#48 | 4.4%(+1.71)#4,877 |
| 49. | Benoit | 6.1% | 2.8%(+3.23)#49 | 4.4%(+1.65)#4,961 |
| 50. | Beulah | 6.1% | 2.8%(+3.23)#50 | 4.4%(+1.65)#4,965 |
| 51. | Corinth | 6.0% | 2.8%(+3.16)#51 | 4.4%(+1.58)#5,052 |
| 52. | Aberdeen | 5.9% | 2.8%(+3.06)#52 | 4.4%(+1.49)#5,154 |
| 53. | Sherman | 5.8% | 2.8%(+2.96)#53 | 4.4%(+1.39)#5,291 |
| 54. | Bridgetown | 5.8% | 2.8%(+2.94)#54 | 4.4%(+1.36)#5,324 |
| 55. | Marks | 5.6% | 2.8%(+2.81)#55 | 4.4%(+1.24)#5,493 |
| 56. | Blue Springs | 5.6% | 2.8%(+2.72)#56 | 4.4%(+1.15)#5,629 |
| 57. | Ocean Springs | 5.3% | 2.8%(+2.49)#57 | 4.4%(+0.912)#5,966 |
| 58. | Water Valley | 5.3% | 2.8%(+2.43)#58 | 4.4%(+0.854)#6,048 |
| 59. | Silver City | 5.3% | 2.8%(+2.43)#59 | 4.4%(+0.854)#6,080 |
| 60. | Jackson | 5.2% | 2.8%(+2.36)#60 | 4.4%(+0.789)#6,186 |
| 61. | Pass Christian | 5.2% | 2.8%(+2.36)#61 | 4.4%(+0.784)#6,198 |
| 62. | Beechwood | 5.2% | 2.8%(+2.35)#62 | 4.4%(+0.776)#6,214 |
| 63. | Yazoo City | 5.2% | 2.8%(+2.34)#63 | 4.4%(+0.763)#6,235 |
| 64. | Collins | 5.2% | 2.8%(+2.34)#64 | 4.4%(+0.763)#6,236 |
| 65. | Leakesville | 5.1% | 2.8%(+2.29)#65 | 4.4%(+0.710)#6,321 |
| 66. | Hazlehurst | 5.1% | 2.8%(+2.23)#66 | 4.4%(+0.651)#6,430 |
| 67. | Meridian | 5.0% | 2.8%(+2.17)#67 | 4.4%(+0.594)#6,524 |
| 68. | Lexington | 4.9% | 2.8%(+2.10)#68 | 4.4%(+0.520)#6,666 |
| 69. | Cleary | 4.8% | 2.8%(+2.00)#69 | 4.4%(+0.429)#6,828 |
| 70. | Biloxi | 4.5% | 2.8%(+1.71)#70 | 4.4%(+0.132)#7,399 |
| 71. | Ridgeland | 4.5% | 2.8%(+1.67)#71 | 4.4%(+0.099)#7,454 |
| 72. | Mendenhall | 4.5% | 2.8%(+1.67)#72 | 4.4%(+0.090)#7,465 |
| 73. | Holly Springs | 4.3% | 2.8%(+1.51)#73 | 4.4%(-0.062)#7,757 |
| 74. | Louisville | 4.1% | 2.8%(+1.31)#74 | 4.4%(-0.270)#8,235 |
| 75. | Picayune | 4.1% | 2.8%(+1.27)#75 | 4.4%(-0.309)#8,328 |
| 76. | Petal | 4.1% | 2.8%(+1.24)#76 | 4.4%(-0.332)#8,397 |
| 77. | Walls | 4.0% | 2.8%(+1.19)#77 | 4.4%(-0.383)#8,491 |
| 78. | Guntown | 4.0% | 2.8%(+1.17)#78 | 4.4%(-0.410)#8,544 |
| 79. | Forest | 4.0% | 2.8%(+1.13)#79 | 4.4%(-0.443)#8,635 |
| 80. | Kiln | 3.9% | 2.8%(+1.07)#80 | 4.4%(-0.507)#8,777 |
| 81. | Pascagoula | 3.9% | 2.8%(+1.05)#81 | 4.4%(-0.523)#8,827 |
| 82. | Lena | 3.8% | 2.8%(+1.01)#82 | 4.4%(-0.563)#8,954 |
| 83. | Vicksburg | 3.8% | 2.8%(+0.932)#83 | 4.4%(-0.643)#9,102 |
| 84. | Sumrall | 3.8% | 2.8%(+0.929)#84 | 4.4%(-0.646)#9,107 |
| 85. | Delisle | 3.7% | 2.8%(+0.912)#85 | 4.4%(-0.663)#9,140 |
| 86. | Magnolia | 3.7% | 2.8%(+0.895)#86 | 4.4%(-0.681)#9,182 |
| 87. | Horn Lake | 3.7% | 2.8%(+0.875)#87 | 4.4%(-0.701)#9,229 |
| 88. | Long Beach | 3.6% | 2.8%(+0.786)#88 | 4.4%(-0.790)#9,445 |
| 89. | New Albany | 3.6% | 2.8%(+0.778)#89 | 4.4%(-0.797)#9,469 |
| 90. | Clinton | 3.6% | 2.8%(+0.746)#90 | 4.4%(-0.830)#9,527 |
| 91. | Starkville | 3.6% | 2.8%(+0.735)#91 | 4.4%(-0.841)#9,585 |
| 92. | Pontotoc | 3.6% | 2.8%(+0.725)#92 | 4.4%(-0.851)#9,604 |
| 93. | Madison | 3.5% | 2.8%(+0.678)#93 | 4.4%(-0.898)#9,713 |
| 94. | Farmington | 3.4% | 2.8%(+0.601)#94 | 4.4%(-0.975)#9,874 |
| 95. | Caledonia | 3.4% | 2.8%(+0.595)#95 | 4.4%(-0.981)#9,887 |
| 96. | Flowood | 3.4% | 2.8%(+0.539)#96 | 4.4%(-1.04)#10,031 |
| 97. | Brandon | 3.3% | 2.8%(+0.426)#97 | 4.4%(-1.15)#10,302 |
| 98. | Utica | 3.0% | 2.8%(+0.166)#98 | 4.4%(-1.41)#10,899 |
| 99. | Summit | 2.8% | 2.8%(+0.014)#99 | 4.4%(-1.56)#11,255 |
| 100. | Smithville | 2.8% | 2.8%(-0.056)#100 | 4.4%(-1.63)#11,401 |
Common Questions
What are the Top 10 Cities with the Highest Percentage of Population with a Degree in Literature and Languages in Mississippi?
Top 10 Cities with the Highest Percentage of Population with a Degree in Literature and Languages in Mississippi are:
#1
44.4%
#2
40.0%
#3
37.3%
#4
30.0%
#5
26.9%
#6
25.7%
#7
20.0%
#8
19.8%
#9
16.7%
#10
14.6%
What city has the Highest Percentage of Population with a Degree in Literature and Languages in Mississippi?
Holcomb has the Highest Percentage of Population with a Degree in Literature and Languages in Mississippi with 44.4%.
What is the Percentage of Population with a Degree in Literature and Languages in the State of Mississippi?
Percentage of Population with a Degree in Literature and Languages in Mississippi is 2.8%.
What is the Percentage of Population with a Degree in Literature and Languages in the United States?
Percentage of Population with a Degree in Literature and Languages in the United States is 4.4%.