Zip Codes with the Highest Percentage of Population with a Degree in Literature and Languages in New Jersey
RELATED REPORTS & OPTIONS
Literature and Languages
New Jersey
Compare Zip Codes
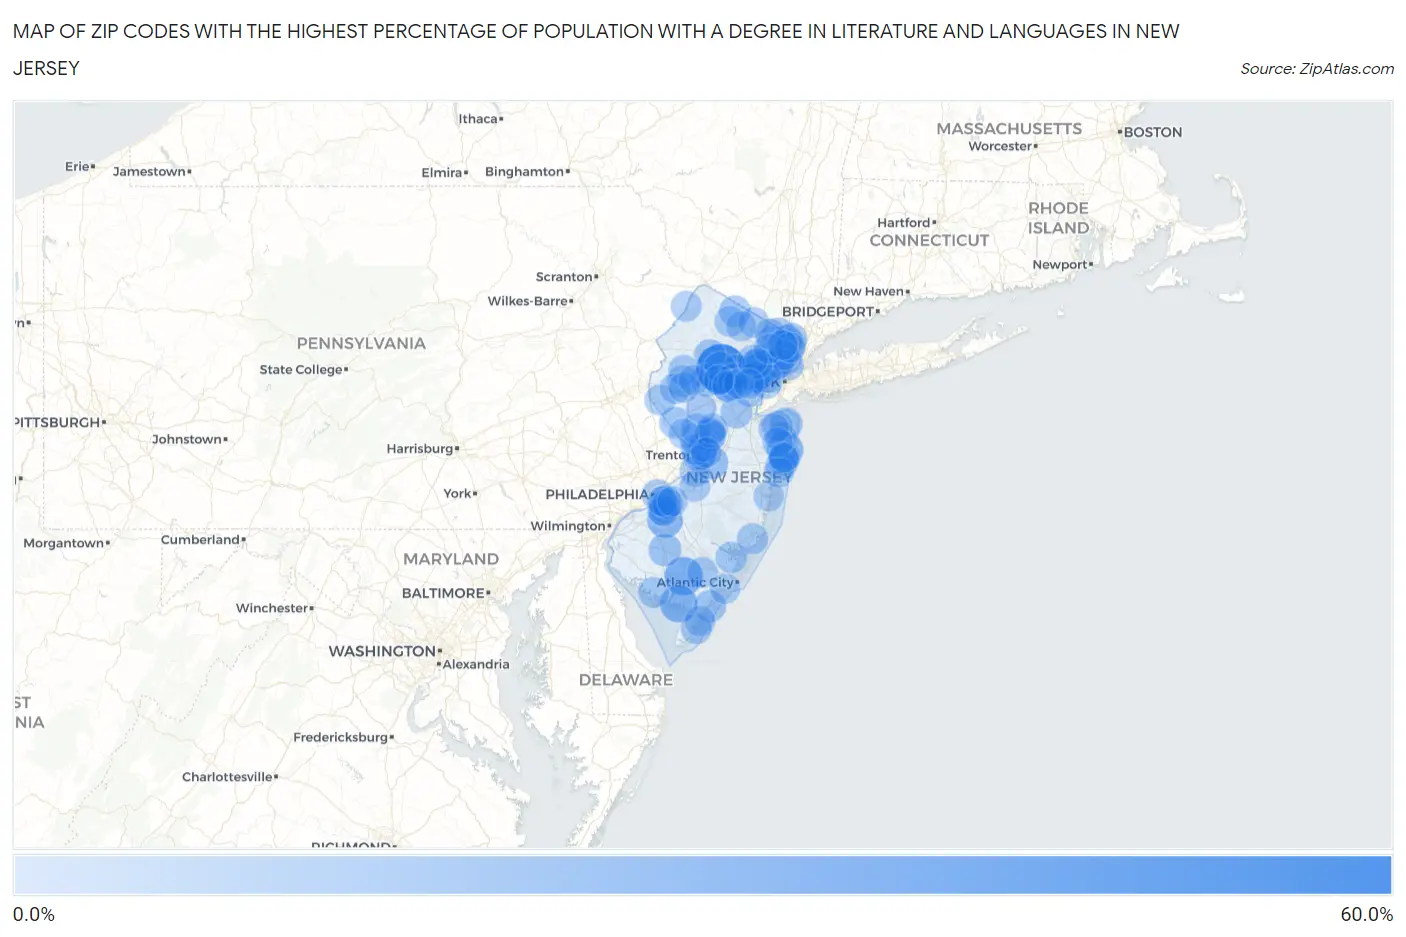
Map of Zip Codes with the Highest Percentage of Population with a Degree in Literature and Languages in New Jersey
0.0%
60.0%
Zip Codes with the Highest Percentage of Population with a Degree in Literature and Languages in New Jersey
| Zip Code | % Graduates | vs State | vs National | |
| 1. | 07926 | 54.2% | 4.6%(+49.6)#1 | 4.4%(+49.8)#50 |
| 2. | 08340 | 26.4% | 4.6%(+21.9)#2 | 4.4%(+22.0)#269 |
| 3. | 08314 | 23.7% | 4.6%(+19.2)#3 | 4.4%(+19.3)#343 |
| 4. | 07723 | 22.1% | 4.6%(+17.5)#4 | 4.4%(+17.7)#398 |
| 5. | 08032 | 20.0% | 4.6%(+15.4)#5 | 4.4%(+15.6)#477 |
| 6. | 08620 | 15.3% | 4.6%(+10.8)#6 | 4.4%(+10.9)#789 |
| 7. | 07961 | 14.3% | 4.6%(+9.72)#7 | 4.4%(+9.88)#900 |
| 8. | 07043 | 13.6% | 4.6%(+9.01)#8 | 4.4%(+9.17)#969 |
| 9. | 07934 | 13.4% | 4.6%(+8.88)#9 | 4.4%(+9.04)#986 |
| 10. | 08328 | 12.7% | 4.6%(+8.18)#10 | 4.4%(+8.34)#1,089 |
| 11. | 07980 | 12.7% | 4.6%(+8.15)#11 | 4.4%(+8.31)#1,094 |
| 12. | 08608 | 12.6% | 4.6%(+8.03)#12 | 4.4%(+8.18)#1,121 |
| 13. | 07732 | 12.3% | 4.6%(+7.71)#13 | 4.4%(+7.86)#1,174 |
| 14. | 07028 | 11.7% | 4.6%(+7.17)#14 | 4.4%(+7.33)#1,272 |
| 15. | 08248 | 11.4% | 4.6%(+6.86)#15 | 4.4%(+7.02)#1,357 |
| 16. | 07677 | 11.2% | 4.6%(+6.64)#16 | 4.4%(+6.79)#1,409 |
| 17. | 07627 | 10.9% | 4.6%(+6.38)#17 | 4.4%(+6.53)#1,495 |
| 18. | 08542 | 10.5% | 4.6%(+5.95)#18 | 4.4%(+6.11)#1,634 |
| 19. | 07648 | 10.4% | 4.6%(+5.86)#19 | 4.4%(+6.02)#1,659 |
| 20. | 08904 | 10.1% | 4.6%(+5.56)#20 | 4.4%(+5.72)#1,767 |
| 21. | 08609 | 10.0% | 4.6%(+5.39)#21 | 4.4%(+5.55)#1,853 |
| 22. | 07852 | 9.8% | 4.6%(+5.24)#22 | 4.4%(+5.40)#1,911 |
| 23. | 08102 | 9.7% | 4.6%(+5.14)#23 | 4.4%(+5.30)#1,955 |
| 24. | 08108 | 9.7% | 4.6%(+5.11)#24 | 4.4%(+5.26)#1,969 |
| 25. | 07422 | 9.7% | 4.6%(+5.09)#25 | 4.4%(+5.25)#1,972 |
| 26. | 08559 | 9.6% | 4.6%(+5.06)#26 | 4.4%(+5.21)#1,989 |
| 27. | 08241 | 9.6% | 4.6%(+5.04)#27 | 4.4%(+5.19)#1,997 |
| 28. | 07027 | 9.6% | 4.6%(+5.04)#28 | 4.4%(+5.19)#1,999 |
| 29. | 07042 | 9.6% | 4.6%(+5.00)#29 | 4.4%(+5.16)#2,011 |
| 30. | 07970 | 9.4% | 4.6%(+4.79)#30 | 4.4%(+4.94)#2,118 |
| 31. | 08826 | 9.3% | 4.6%(+4.78)#31 | 4.4%(+4.94)#2,121 |
| 32. | 07041 | 9.2% | 4.6%(+4.62)#32 | 4.4%(+4.78)#2,215 |
| 33. | 07079 | 9.1% | 4.6%(+4.57)#33 | 4.4%(+4.73)#2,242 |
| 34. | 07605 | 9.1% | 4.6%(+4.53)#34 | 4.4%(+4.69)#2,261 |
| 35. | 07756 | 9.1% | 4.6%(+4.53)#35 | 4.4%(+4.68)#2,265 |
| 36. | 07762 | 9.1% | 4.6%(+4.51)#36 | 4.4%(+4.67)#2,290 |
| 37. | 08092 | 8.9% | 4.6%(+4.34)#37 | 4.4%(+4.49)#2,372 |
| 38. | 07717 | 8.9% | 4.6%(+4.34)#38 | 4.4%(+4.49)#2,373 |
| 39. | 08544 | 8.9% | 4.6%(+4.33)#39 | 4.4%(+4.49)#2,376 |
| 40. | 07072 | 8.8% | 4.6%(+4.26)#40 | 4.4%(+4.41)#2,410 |
| 41. | 07014 | 8.7% | 4.6%(+4.15)#41 | 4.4%(+4.31)#2,465 |
| 42. | 07040 | 8.7% | 4.6%(+4.15)#42 | 4.4%(+4.30)#2,468 |
| 43. | 07739 | 8.5% | 4.6%(+3.96)#43 | 4.4%(+4.11)#2,596 |
| 44. | 07935 | 8.5% | 4.6%(+3.93)#44 | 4.4%(+4.08)#2,618 |
| 45. | 07450 | 8.4% | 4.6%(+3.80)#45 | 4.4%(+3.95)#2,700 |
| 46. | 07460 | 8.3% | 4.6%(+3.79)#46 | 4.4%(+3.94)#2,708 |
| 47. | 08518 | 8.3% | 4.6%(+3.71)#47 | 4.4%(+3.86)#2,765 |
| 48. | 08618 | 8.2% | 4.6%(+3.67)#48 | 4.4%(+3.83)#2,790 |
| 49. | 08007 | 8.2% | 4.6%(+3.65)#49 | 4.4%(+3.80)#2,810 |
| 50. | 07640 | 8.2% | 4.6%(+3.60)#50 | 4.4%(+3.76)#2,849 |
| 51. | 08848 | 8.2% | 4.6%(+3.60)#51 | 4.4%(+3.75)#2,854 |
| 52. | 08330 | 8.1% | 4.6%(+3.58)#52 | 4.4%(+3.74)#2,864 |
| 53. | 08247 | 8.1% | 4.6%(+3.49)#53 | 4.4%(+3.65)#2,937 |
| 54. | 08345 | 8.0% | 4.6%(+3.44)#54 | 4.4%(+3.59)#2,979 |
| 55. | 08534 | 8.0% | 4.6%(+3.39)#55 | 4.4%(+3.55)#3,018 |
| 56. | 07737 | 7.9% | 4.6%(+3.37)#56 | 4.4%(+3.52)#3,040 |
| 57. | 07748 | 7.8% | 4.6%(+3.28)#57 | 4.4%(+3.44)#3,113 |
| 58. | 07851 | 7.8% | 4.6%(+3.28)#58 | 4.4%(+3.43)#3,116 |
| 59. | 08648 | 7.8% | 4.6%(+3.28)#59 | 4.4%(+3.43)#3,121 |
| 60. | 08202 | 7.8% | 4.6%(+3.27)#60 | 4.4%(+3.42)#3,130 |
| 61. | 08078 | 7.6% | 4.6%(+3.06)#61 | 4.4%(+3.22)#3,324 |
| 62. | 07456 | 7.6% | 4.6%(+3.06)#62 | 4.4%(+3.22)#3,327 |
| 63. | 07074 | 7.6% | 4.6%(+3.05)#63 | 4.4%(+3.20)#3,341 |
| 64. | 08525 | 7.6% | 4.6%(+3.04)#64 | 4.4%(+3.20)#3,347 |
| 65. | 08029 | 7.6% | 4.6%(+2.99)#65 | 4.4%(+3.15)#3,386 |
| 66. | 07020 | 7.5% | 4.6%(+2.97)#66 | 4.4%(+3.12)#3,412 |
| 67. | 08033 | 7.5% | 4.6%(+2.97)#67 | 4.4%(+3.12)#3,413 |
| 68. | 08540 | 7.5% | 4.6%(+2.95)#68 | 4.4%(+3.11)#3,422 |
| 69. | 08553 | 7.5% | 4.6%(+2.91)#69 | 4.4%(+3.06)#3,473 |
| 70. | 07021 | 7.5% | 4.6%(+2.91)#70 | 4.4%(+3.06)#3,475 |
| 71. | 07933 | 7.4% | 4.6%(+2.84)#71 | 4.4%(+2.99)#3,553 |
| 72. | 08060 | 7.4% | 4.6%(+2.83)#72 | 4.4%(+2.99)#3,555 |
| 73. | 07865 | 7.4% | 4.6%(+2.82)#73 | 4.4%(+2.98)#3,565 |
| 74. | 07401 | 7.4% | 4.6%(+2.80)#74 | 4.4%(+2.96)#3,584 |
| 75. | 08619 | 7.3% | 4.6%(+2.70)#75 | 4.4%(+2.85)#3,695 |
| 76. | 08827 | 7.2% | 4.6%(+2.68)#76 | 4.4%(+2.84)#3,715 |
| 77. | 07946 | 7.2% | 4.6%(+2.67)#77 | 4.4%(+2.82)#3,723 |
| 78. | 08853 | 7.2% | 4.6%(+2.59)#78 | 4.4%(+2.75)#3,795 |
| 79. | 08829 | 7.1% | 4.6%(+2.58)#79 | 4.4%(+2.73)#3,806 |
| 80. | 07114 | 7.1% | 4.6%(+2.51)#80 | 4.4%(+2.66)#3,918 |
| 81. | 08530 | 7.1% | 4.6%(+2.49)#81 | 4.4%(+2.65)#3,937 |
| 82. | 07666 | 7.0% | 4.6%(+2.48)#82 | 4.4%(+2.63)#3,956 |
| 83. | 08732 | 7.0% | 4.6%(+2.46)#83 | 4.4%(+2.62)#3,969 |
| 84. | 08107 | 7.0% | 4.6%(+2.42)#84 | 4.4%(+2.57)#4,014 |
| 85. | 07102 | 7.0% | 4.6%(+2.42)#85 | 4.4%(+2.57)#4,015 |
| 86. | 07974 | 6.9% | 4.6%(+2.29)#86 | 4.4%(+2.44)#4,176 |
| 87. | 07830 | 6.8% | 4.6%(+2.28)#87 | 4.4%(+2.43)#4,185 |
| 88. | 07724 | 6.8% | 4.6%(+2.28)#88 | 4.4%(+2.43)#4,190 |
| 89. | 07044 | 6.8% | 4.6%(+2.27)#89 | 4.4%(+2.42)#4,198 |
| 90. | 08730 | 6.8% | 4.6%(+2.25)#90 | 4.4%(+2.41)#4,211 |
| 91. | 08403 | 6.8% | 4.6%(+2.24)#91 | 4.4%(+2.40)#4,226 |
| 92. | 07006 | 6.8% | 4.6%(+2.24)#92 | 4.4%(+2.40)#4,232 |
| 93. | 07480 | 6.8% | 4.6%(+2.20)#93 | 4.4%(+2.36)#4,282 |
| 94. | 07514 | 6.7% | 4.6%(+2.18)#94 | 4.4%(+2.33)#4,320 |
| 95. | 07626 | 6.7% | 4.6%(+2.14)#95 | 4.4%(+2.29)#4,358 |
| 96. | 07720 | 6.7% | 4.6%(+2.12)#96 | 4.4%(+2.27)#4,384 |
| 97. | 07081 | 6.6% | 4.6%(+2.02)#97 | 4.4%(+2.18)#4,519 |
| 98. | 08034 | 6.6% | 4.6%(+2.02)#98 | 4.4%(+2.17)#4,524 |
| 99. | 07924 | 6.6% | 4.6%(+2.00)#99 | 4.4%(+2.16)#4,545 |
| 100. | 07649 | 6.6% | 4.6%(+1.99)#100 | 4.4%(+2.15)#4,560 |
Common Questions
What are the Top 10 Zip Codes with the Highest Percentage of Population with a Degree in Literature and Languages in New Jersey?
Top 10 Zip Codes with the Highest Percentage of Population with a Degree in Literature and Languages in New Jersey are:
What zip code has the Highest Percentage of Population with a Degree in Literature and Languages in New Jersey?
07926 has the Highest Percentage of Population with a Degree in Literature and Languages in New Jersey with 54.2%.
What is the Percentage of Population with a Degree in Literature and Languages in the State of New Jersey?
Percentage of Population with a Degree in Literature and Languages in New Jersey is 4.6%.
What is the Percentage of Population with a Degree in Literature and Languages in the United States?
Percentage of Population with a Degree in Literature and Languages in the United States is 4.4%.