Cities with the Largest Italian Community in Michigan
RELATED REPORTS & OPTIONS
Italian
Michigan
Compare Cities
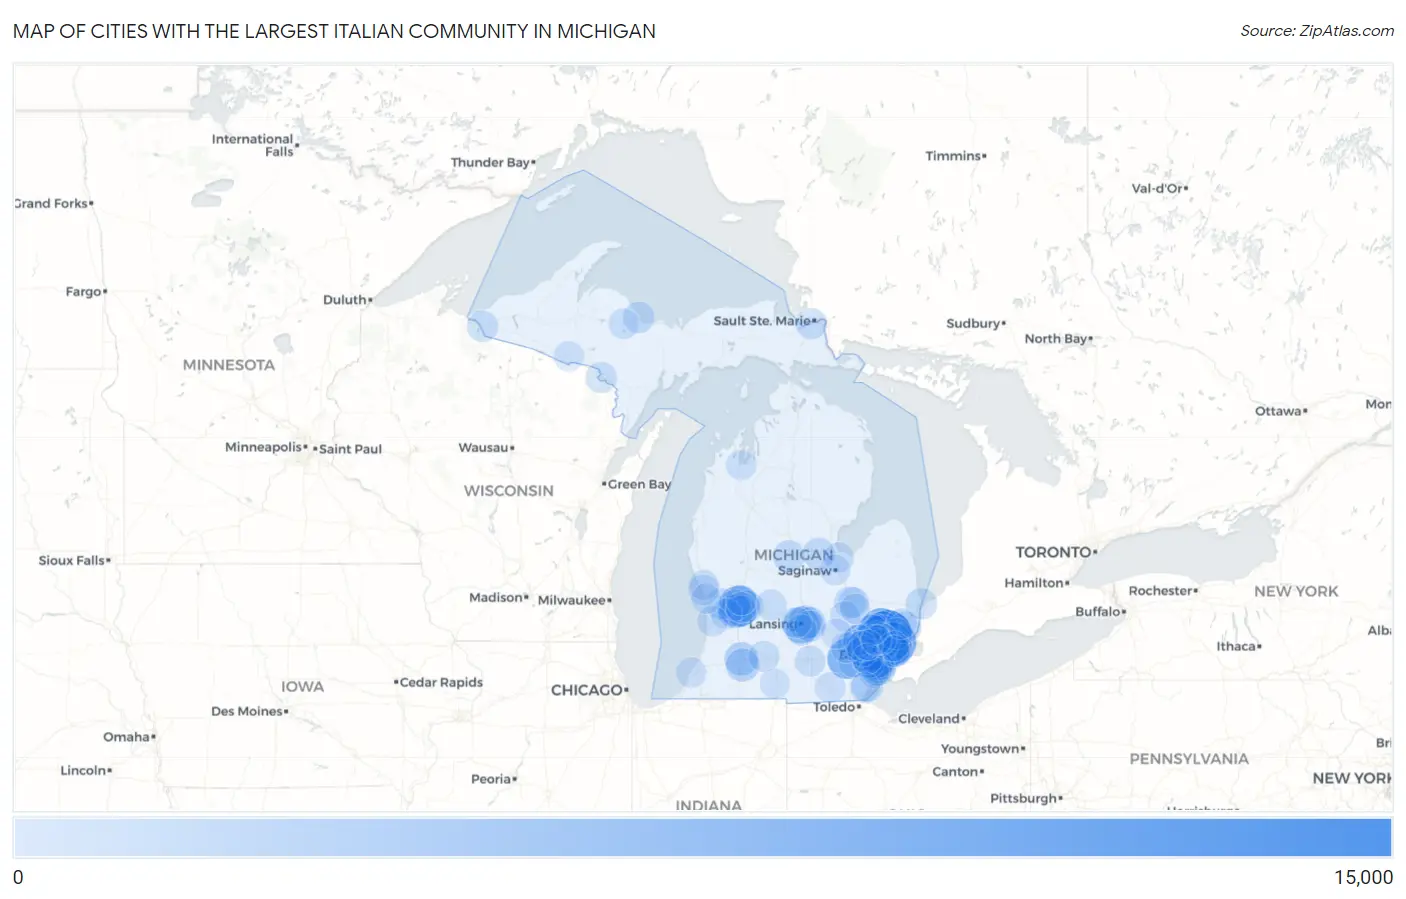
Map of Cities with the Largest Italian Community in Michigan
0
15,000
Cities with the Largest Italian Community in Michigan
| City | Italian | vs State | vs National | |
| 1. | Sterling Heights | 10,888 | 443,221(2.46%)#1 | 16,316,728(0.07%)#96 |
| 2. | Warren | 9,930 | 443,221(2.24%)#2 | 16,316,728(0.06%)#116 |
| 3. | Livonia | 7,663 | 443,221(1.73%)#3 | 16,316,728(0.05%)#193 |
| 4. | St Clair Shores | 7,044 | 443,221(1.59%)#4 | 16,316,728(0.04%)#220 |
| 5. | Rochester Hills | 6,342 | 443,221(1.43%)#5 | 16,316,728(0.04%)#261 |
| 6. | Grand Rapids | 6,195 | 443,221(1.40%)#6 | 16,316,728(0.04%)#272 |
| 7. | Ann Arbor | 5,844 | 443,221(1.32%)#7 | 16,316,728(0.04%)#296 |
| 8. | Troy | 5,799 | 443,221(1.31%)#8 | 16,316,728(0.04%)#298 |
| 9. | Roseville | 4,967 | 443,221(1.12%)#9 | 16,316,728(0.03%)#382 |
| 10. | Royal Oak | 4,568 | 443,221(1.03%)#10 | 16,316,728(0.03%)#442 |
| 11. | Detroit | 4,488 | 443,221(1.01%)#11 | 16,316,728(0.03%)#453 |
| 12. | Novi | 4,187 | 443,221(0.94%)#12 | 16,316,728(0.03%)#503 |
| 13. | Lansing | 3,879 | 443,221(0.88%)#13 | 16,316,728(0.02%)#549 |
| 14. | Westland | 3,731 | 443,221(0.84%)#14 | 16,316,728(0.02%)#572 |
| 15. | Dearborn | 3,729 | 443,221(0.84%)#15 | 16,316,728(0.02%)#573 |
| 16. | Farmington Hills | 3,512 | 443,221(0.79%)#16 | 16,316,728(0.02%)#626 |
| 17. | Allen Park | 2,869 | 443,221(0.65%)#17 | 16,316,728(0.02%)#805 |
| 18. | Wyoming | 2,504 | 443,221(0.56%)#18 | 16,316,728(0.02%)#965 |
| 19. | East Lansing | 2,502 | 443,221(0.56%)#19 | 16,316,728(0.02%)#967 |
| 20. | Taylor | 2,376 | 443,221(0.54%)#20 | 16,316,728(0.01%)#1,018 |
| 21. | Trenton | 2,237 | 443,221(0.50%)#21 | 16,316,728(0.01%)#1,094 |
| 22. | Kalamazoo | 2,156 | 443,221(0.49%)#22 | 16,316,728(0.01%)#1,139 |
| 23. | Portage | 2,102 | 443,221(0.47%)#23 | 16,316,728(0.01%)#1,172 |
| 24. | Dearborn Heights | 2,042 | 443,221(0.46%)#24 | 16,316,728(0.01%)#1,218 |
| 25. | Eastpointe | 2,003 | 443,221(0.45%)#25 | 16,316,728(0.01%)#1,254 |
| 26. | Southgate | 1,980 | 443,221(0.45%)#26 | 16,316,728(0.01%)#1,269 |
| 27. | Grosse Pointe Woods | 1,974 | 443,221(0.45%)#27 | 16,316,728(0.01%)#1,273 |
| 28. | Madison Heights | 1,912 | 443,221(0.43%)#28 | 16,316,728(0.01%)#1,327 |
| 29. | Birmingham | 1,871 | 443,221(0.42%)#29 | 16,316,728(0.01%)#1,366 |
| 30. | Fraser | 1,777 | 443,221(0.40%)#30 | 16,316,728(0.01%)#1,431 |
| 31. | Garden City | 1,689 | 443,221(0.38%)#31 | 16,316,728(0.01%)#1,496 |
| 32. | Rochester | 1,594 | 443,221(0.36%)#32 | 16,316,728(0.01%)#1,581 |
| 33. | Wyandotte | 1,583 | 443,221(0.36%)#33 | 16,316,728(0.01%)#1,595 |
| 34. | Lincoln Park | 1,581 | 443,221(0.36%)#34 | 16,316,728(0.01%)#1,602 |
| 35. | Berkley | 1,450 | 443,221(0.33%)#35 | 16,316,728(0.01%)#1,766 |
| 36. | Midland | 1,422 | 443,221(0.32%)#36 | 16,316,728(0.01%)#1,791 |
| 37. | Mount Pleasant | 1,367 | 443,221(0.31%)#37 | 16,316,728(0.01%)#1,868 |
| 38. | Grosse Pointe Park | 1,318 | 443,221(0.30%)#38 | 16,316,728(0.01%)#1,932 |
| 39. | Flint | 1,289 | 443,221(0.29%)#39 | 16,316,728(0.01%)#1,979 |
| 40. | Ferndale | 1,286 | 443,221(0.29%)#40 | 16,316,728(0.01%)#1,986 |
| 41. | New Baltimore | 1,273 | 443,221(0.29%)#41 | 16,316,728(0.01%)#2,000 |
| 42. | Ypsilanti | 1,267 | 443,221(0.29%)#42 | 16,316,728(0.01%)#2,013 |
| 43. | Southfield | 1,169 | 443,221(0.26%)#43 | 16,316,728(0.01%)#2,137 |
| 44. | Port Huron | 1,152 | 443,221(0.26%)#44 | 16,316,728(0.01%)#2,168 |
| 45. | Marquette | 1,151 | 443,221(0.26%)#45 | 16,316,728(0.01%)#2,175 |
| 46. | Forest Hills | 1,142 | 443,221(0.26%)#46 | 16,316,728(0.01%)#2,190 |
| 47. | Monroe | 1,120 | 443,221(0.25%)#47 | 16,316,728(0.01%)#2,228 |
| 48. | Allendale | 1,082 | 443,221(0.24%)#48 | 16,316,728(0.01%)#2,283 |
| 49. | Kentwood | 1,079 | 443,221(0.24%)#49 | 16,316,728(0.01%)#2,288 |
| 50. | Haslett | 1,031 | 443,221(0.23%)#50 | 16,316,728(0.01%)#2,377 |
| 51. | Sault Ste Marie | 1,026 | 443,221(0.23%)#51 | 16,316,728(0.01%)#2,387 |
| 52. | Auburn Hills | 1,019 | 443,221(0.23%)#52 | 16,316,728(0.01%)#2,400 |
| 53. | Mount Clemens | 1,015 | 443,221(0.23%)#53 | 16,316,728(0.01%)#2,410 |
| 54. | Ironwood | 1,002 | 443,221(0.23%)#54 | 16,316,728(0.01%)#2,440 |
| 55. | Grosse Pointe | 972 | 443,221(0.22%)#55 | 16,316,728(0.01%)#2,496 |
| 56. | Okemos | 968 | 443,221(0.22%)#56 | 16,316,728(0.01%)#2,511 |
| 57. | Holt | 953 | 443,221(0.22%)#57 | 16,316,728(0.01%)#2,543 |
| 58. | Battle Creek | 936 | 443,221(0.21%)#58 | 16,316,728(0.01%)#2,584 |
| 59. | Walker | 936 | 443,221(0.21%)#59 | 16,316,728(0.01%)#2,586 |
| 60. | Iron Mountain | 927 | 443,221(0.21%)#60 | 16,316,728(0.01%)#2,597 |
| 61. | Riverview | 924 | 443,221(0.21%)#61 | 16,316,728(0.01%)#2,602 |
| 62. | Romulus | 916 | 443,221(0.21%)#62 | 16,316,728(0.01%)#2,621 |
| 63. | Grosse Pointe Farms | 916 | 443,221(0.21%)#63 | 16,316,728(0.01%)#2,623 |
| 64. | Woodhaven | 913 | 443,221(0.21%)#64 | 16,316,728(0.01%)#2,632 |
| 65. | Clawson | 899 | 443,221(0.20%)#65 | 16,316,728(0.01%)#2,673 |
| 66. | Ionia | 842 | 443,221(0.19%)#66 | 16,316,728(0.01%)#2,809 |
| 67. | Waverly | 821 | 443,221(0.19%)#67 | 16,316,728(0.01%)#2,884 |
| 68. | Jackson | 820 | 443,221(0.19%)#68 | 16,316,728(0.01%)#2,886 |
| 69. | Burton | 792 | 443,221(0.18%)#69 | 16,316,728(0.00%)#2,960 |
| 70. | South Lyon | 780 | 443,221(0.18%)#70 | 16,316,728(0.00%)#2,986 |
| 71. | Wixom | 763 | 443,221(0.17%)#71 | 16,316,728(0.00%)#3,035 |
| 72. | New Haven | 753 | 443,221(0.17%)#72 | 16,316,728(0.00%)#3,069 |
| 73. | Hudsonville | 752 | 443,221(0.17%)#73 | 16,316,728(0.00%)#3,074 |
| 74. | Plymouth | 750 | 443,221(0.17%)#74 | 16,316,728(0.00%)#3,081 |
| 75. | East Grand Rapids | 737 | 443,221(0.17%)#75 | 16,316,728(0.00%)#3,123 |
| 76. | Norton Shores | 719 | 443,221(0.16%)#76 | 16,316,728(0.00%)#3,189 |
| 77. | Holland | 694 | 443,221(0.16%)#77 | 16,316,728(0.00%)#3,283 |
| 78. | Whitmore Lake | 689 | 443,221(0.16%)#78 | 16,316,728(0.00%)#3,298 |
| 79. | Pontiac | 687 | 443,221(0.16%)#79 | 16,316,728(0.00%)#3,306 |
| 80. | Flat Rock | 682 | 443,221(0.15%)#80 | 16,316,728(0.00%)#3,324 |
| 81. | Adrian | 678 | 443,221(0.15%)#81 | 16,316,728(0.00%)#3,344 |
| 82. | Saginaw | 673 | 443,221(0.15%)#82 | 16,316,728(0.00%)#3,363 |
| 83. | Northville | 664 | 443,221(0.15%)#83 | 16,316,728(0.00%)#3,405 |
| 84. | Ishpeming | 644 | 443,221(0.15%)#84 | 16,316,728(0.00%)#3,485 |
| 85. | Bay City | 640 | 443,221(0.14%)#85 | 16,316,728(0.00%)#3,500 |
| 86. | Linden | 636 | 443,221(0.14%)#86 | 16,316,728(0.00%)#3,519 |
| 87. | Wayne | 604 | 443,221(0.14%)#87 | 16,316,728(0.00%)#3,642 |
| 88. | Muskegon | 603 | 443,221(0.14%)#88 | 16,316,728(0.00%)#3,646 |
| 89. | Northview | 602 | 443,221(0.14%)#89 | 16,316,728(0.00%)#3,659 |
| 90. | Farmington | 589 | 443,221(0.13%)#90 | 16,316,728(0.00%)#3,720 |
| 91. | Grand Haven | 584 | 443,221(0.13%)#91 | 16,316,728(0.00%)#3,745 |
| 92. | Howell | 570 | 443,221(0.13%)#92 | 16,316,728(0.00%)#3,829 |
| 93. | Grand Blanc | 565 | 443,221(0.13%)#93 | 16,316,728(0.00%)#3,855 |
| 94. | St Joseph | 563 | 443,221(0.13%)#94 | 16,316,728(0.00%)#3,869 |
| 95. | Traverse City | 547 | 443,221(0.12%)#95 | 16,316,728(0.00%)#3,950 |
| 96. | Iron River | 537 | 443,221(0.12%)#96 | 16,316,728(0.00%)#3,995 |
| 97. | Coldwater | 531 | 443,221(0.12%)#97 | 16,316,728(0.00%)#4,032 |
| 98. | South Monroe | 518 | 443,221(0.12%)#98 | 16,316,728(0.00%)#4,101 |
| 99. | Harper Woods | 514 | 443,221(0.12%)#99 | 16,316,728(0.00%)#4,129 |
| 100. | Beverly Hills | 513 | 443,221(0.12%)#100 | 16,316,728(0.00%)#4,132 |
Common Questions
What are the Top 10 Cities with the Largest Italian Community in Michigan?
Top 10 Cities with the Largest Italian Community in Michigan are:
#1
10,888
#2
9,930
#3
7,663
#4
7,044
#5
6,342
#6
6,195
#7
5,844
#8
5,799
#9
4,967
#10
4,568
What city has the Largest Italian Community in Michigan?
Sterling Heights has the Largest Italian Community in Michigan with 10,888.
What is the Total Italian Population in the State of Michigan?
Total Italian Population in Michigan is 443,221.
What is the Total Italian Population in the United States?
Total Italian Population in the United States is 16,316,728.