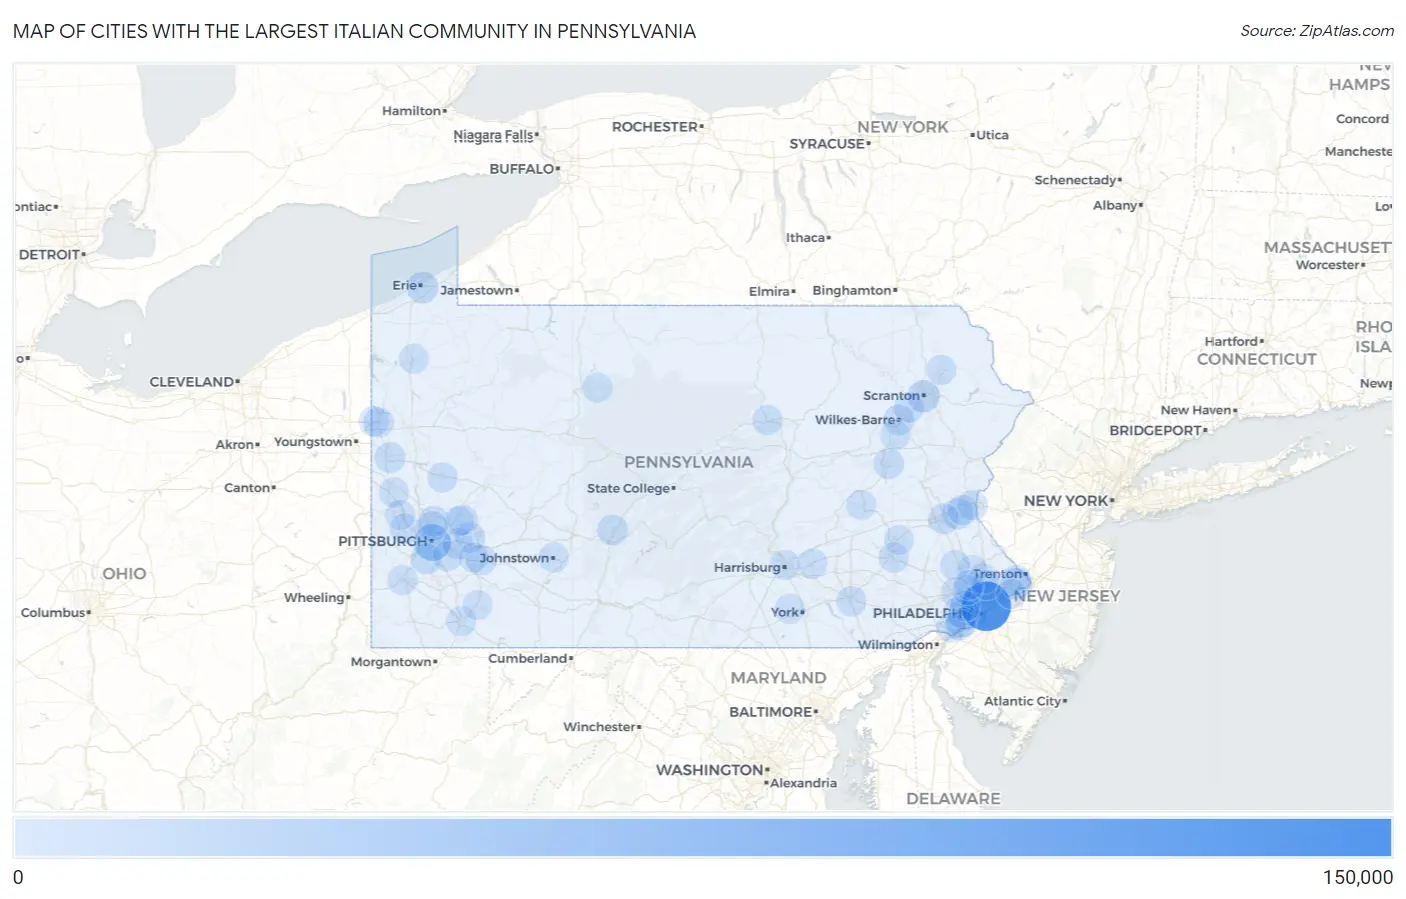
Cities with the Largest Italian Community in Pennsylvania
RELATED REPORTS & OPTIONS
Italian
Pennsylvania
Compare Cities
Map of Cities with the Largest Italian Community in Pennsylvania
0
150,000
Cities with the Largest Italian Community in Pennsylvania
| City | Italian | vs State | vs National | |
| 1. | Philadelphia | 108,240 | 1,405,580(7.70%)#1 | 16,316,728(0.66%)#2 |
| 2. | Pittsburgh | 35,767 | 1,405,580(2.54%)#2 | 16,316,728(0.22%)#12 |
| 3. | Scranton | 12,599 | 1,405,580(0.90%)#3 | 16,316,728(0.08%)#72 |
| 4. | Erie | 9,294 | 1,405,580(0.66%)#4 | 16,316,728(0.06%)#136 |
| 5. | Levittown | 8,024 | 1,405,580(0.57%)#5 | 16,316,728(0.05%)#177 |
| 6. | Bethlehem | 6,627 | 1,405,580(0.47%)#6 | 16,316,728(0.04%)#236 |
| 7. | Bethel Park | 6,315 | 1,405,580(0.45%)#7 | 16,316,728(0.04%)#268 |
| 8. | Plum Borough | 5,718 | 1,405,580(0.41%)#8 | 16,316,728(0.04%)#304 |
| 9. | Altoona | 5,494 | 1,405,580(0.39%)#9 | 16,316,728(0.03%)#325 |
| 10. | New Castle | 5,441 | 1,405,580(0.39%)#10 | 16,316,728(0.03%)#333 |
| 11. | Allentown | 5,124 | 1,405,580(0.36%)#11 | 16,316,728(0.03%)#365 |
| 12. | Drexel Hill | 5,092 | 1,405,580(0.36%)#12 | 16,316,728(0.03%)#368 |
| 13. | State College Borough | 4,794 | 1,405,580(0.34%)#13 | 16,316,728(0.03%)#411 |
| 14. | Monroeville | 4,434 | 1,405,580(0.32%)#14 | 16,316,728(0.03%)#467 |
| 15. | Wilkes Barre | 4,293 | 1,405,580(0.31%)#15 | 16,316,728(0.03%)#485 |
| 16. | Dunmore Borough | 4,189 | 1,405,580(0.30%)#16 | 16,316,728(0.03%)#502 |
| 17. | Hazleton | 4,162 | 1,405,580(0.30%)#17 | 16,316,728(0.03%)#510 |
| 18. | Murrysville | 4,023 | 1,405,580(0.29%)#18 | 16,316,728(0.02%)#528 |
| 19. | Allison Park | 3,585 | 1,405,580(0.26%)#19 | 16,316,728(0.02%)#609 |
| 20. | King Of Prussia | 3,543 | 1,405,580(0.25%)#20 | 16,316,728(0.02%)#619 |
| 21. | West Mifflin Borough | 3,524 | 1,405,580(0.25%)#21 | 16,316,728(0.02%)#624 |
| 22. | Norristown Borough | 3,302 | 1,405,580(0.23%)#22 | 16,316,728(0.02%)#670 |
| 23. | Baldwin Borough | 3,156 | 1,405,580(0.22%)#23 | 16,316,728(0.02%)#705 |
| 24. | Reading | 3,119 | 1,405,580(0.22%)#24 | 16,316,728(0.02%)#711 |
| 25. | Phoenixville Borough | 3,077 | 1,405,580(0.22%)#25 | 16,316,728(0.02%)#727 |
| 26. | West Chester Borough | 3,025 | 1,405,580(0.22%)#26 | 16,316,728(0.02%)#742 |
| 27. | Greensburg | 3,010 | 1,405,580(0.21%)#27 | 16,316,728(0.02%)#747 |
| 28. | Pottstown Borough | 3,000 | 1,405,580(0.21%)#28 | 16,316,728(0.02%)#751 |
| 29. | Broomall | 2,850 | 1,405,580(0.20%)#29 | 16,316,728(0.02%)#810 |
| 30. | Lower Burrell | 2,731 | 1,405,580(0.19%)#30 | 16,316,728(0.02%)#863 |
| 31. | Hermitage | 2,725 | 1,405,580(0.19%)#31 | 16,316,728(0.02%)#869 |
| 32. | Lansdale Borough | 2,717 | 1,405,580(0.19%)#32 | 16,316,728(0.02%)#872 |
| 33. | Carnot Moon | 2,700 | 1,405,580(0.19%)#33 | 16,316,728(0.02%)#879 |
| 34. | Old Forge Borough | 2,526 | 1,405,580(0.18%)#34 | 16,316,728(0.02%)#953 |
| 35. | Whitehall Borough | 2,514 | 1,405,580(0.18%)#35 | 16,316,728(0.02%)#959 |
| 36. | Woodlyn | 2,473 | 1,405,580(0.18%)#36 | 16,316,728(0.02%)#980 |
| 37. | Easton | 2,440 | 1,405,580(0.17%)#37 | 16,316,728(0.01%)#987 |
| 38. | Williamsport | 2,402 | 1,405,580(0.17%)#38 | 16,316,728(0.01%)#1,005 |
| 39. | Ellwood City Borough | 2,334 | 1,405,580(0.17%)#39 | 16,316,728(0.01%)#1,045 |
| 40. | Lancaster | 2,302 | 1,405,580(0.16%)#40 | 16,316,728(0.01%)#1,062 |
| 41. | Jefferson Hills Borough | 2,293 | 1,405,580(0.16%)#41 | 16,316,728(0.01%)#1,068 |
| 42. | Franklin Park Borough | 2,262 | 1,405,580(0.16%)#42 | 16,316,728(0.01%)#1,078 |
| 43. | Pittston | 2,236 | 1,405,580(0.16%)#43 | 16,316,728(0.01%)#1,095 |
| 44. | Conshohocken Borough | 2,219 | 1,405,580(0.16%)#44 | 16,316,728(0.01%)#1,100 |
| 45. | Butler | 2,161 | 1,405,580(0.15%)#45 | 16,316,728(0.01%)#1,134 |
| 46. | Horsham | 2,157 | 1,405,580(0.15%)#46 | 16,316,728(0.01%)#1,137 |
| 47. | Canonsburg Borough | 2,092 | 1,405,580(0.15%)#47 | 16,316,728(0.01%)#1,181 |
| 48. | Folsom | 2,063 | 1,405,580(0.15%)#48 | 16,316,728(0.01%)#1,207 |
| 49. | Hershey | 2,004 | 1,405,580(0.14%)#49 | 16,316,728(0.01%)#1,251 |
| 50. | Brentwood Borough | 1,996 | 1,405,580(0.14%)#50 | 16,316,728(0.01%)#1,261 |
| 51. | Morrisville Borough | 1,969 | 1,405,580(0.14%)#51 | 16,316,728(0.01%)#1,275 |
| 52. | Montgomeryville | 1,967 | 1,405,580(0.14%)#52 | 16,316,728(0.01%)#1,276 |
| 53. | Mckeesport | 1,966 | 1,405,580(0.14%)#53 | 16,316,728(0.01%)#1,277 |
| 54. | New Kensington | 1,955 | 1,405,580(0.14%)#54 | 16,316,728(0.01%)#1,291 |
| 55. | Fairless Hills | 1,954 | 1,405,580(0.14%)#55 | 16,316,728(0.01%)#1,293 |
| 56. | Harrisburg | 1,953 | 1,405,580(0.14%)#56 | 16,316,728(0.01%)#1,295 |
| 57. | Bristol Borough | 1,892 | 1,405,580(0.13%)#57 | 16,316,728(0.01%)#1,346 |
| 58. | St Marys | 1,887 | 1,405,580(0.13%)#58 | 16,316,728(0.01%)#1,347 |
| 59. | Moosic Borough | 1,885 | 1,405,580(0.13%)#59 | 16,316,728(0.01%)#1,350 |
| 60. | Emmaus Borough | 1,839 | 1,405,580(0.13%)#60 | 16,316,728(0.01%)#1,388 |
| 61. | Willow Grove | 1,816 | 1,405,580(0.13%)#61 | 16,316,728(0.01%)#1,402 |
| 62. | Kingston Borough | 1,808 | 1,405,580(0.13%)#62 | 16,316,728(0.01%)#1,412 |
| 63. | Johnstown | 1,797 | 1,405,580(0.13%)#63 | 16,316,728(0.01%)#1,416 |
| 64. | Indiana Borough | 1,743 | 1,405,580(0.12%)#64 | 16,316,728(0.01%)#1,454 |
| 65. | Brookhaven Borough | 1,732 | 1,405,580(0.12%)#65 | 16,316,728(0.01%)#1,465 |
| 66. | Ardmore | 1,724 | 1,405,580(0.12%)#66 | 16,316,728(0.01%)#1,476 |
| 67. | Carbondale | 1,668 | 1,405,580(0.12%)#67 | 16,316,728(0.01%)#1,510 |
| 68. | Exeter Borough | 1,660 | 1,405,580(0.12%)#68 | 16,316,728(0.01%)#1,517 |
| 69. | Glenshaw | 1,649 | 1,405,580(0.12%)#69 | 16,316,728(0.01%)#1,521 |
| 70. | Glenolden Borough | 1,643 | 1,405,580(0.12%)#70 | 16,316,728(0.01%)#1,528 |
| 71. | Croydon | 1,623 | 1,405,580(0.12%)#71 | 16,316,728(0.01%)#1,546 |
| 72. | Ridley Park Borough | 1,623 | 1,405,580(0.12%)#72 | 16,316,728(0.01%)#1,547 |
| 73. | Weigelstown | 1,614 | 1,405,580(0.11%)#73 | 16,316,728(0.01%)#1,561 |
| 74. | Uniontown | 1,605 | 1,405,580(0.11%)#74 | 16,316,728(0.01%)#1,570 |
| 75. | Norwood Borough | 1,592 | 1,405,580(0.11%)#75 | 16,316,728(0.01%)#1,585 |
| 76. | Connellsville | 1,573 | 1,405,580(0.11%)#76 | 16,316,728(0.01%)#1,612 |
| 77. | Mountain Top | 1,566 | 1,405,580(0.11%)#77 | 16,316,728(0.01%)#1,620 |
| 78. | Carlisle Borough | 1,565 | 1,405,580(0.11%)#78 | 16,316,728(0.01%)#1,622 |
| 79. | Pleasant Hills Borough | 1,534 | 1,405,580(0.11%)#79 | 16,316,728(0.01%)#1,659 |
| 80. | Dormont Borough | 1,531 | 1,405,580(0.11%)#80 | 16,316,728(0.01%)#1,664 |
| 81. | Archbald Borough | 1,494 | 1,405,580(0.11%)#81 | 16,316,728(0.01%)#1,704 |
| 82. | Middletown | 1,480 | 1,405,580(0.11%)#82 | 16,316,728(0.01%)#1,720 |
| 83. | Aliquippa | 1,468 | 1,405,580(0.10%)#83 | 16,316,728(0.01%)#1,738 |
| 84. | Blakely Borough | 1,465 | 1,405,580(0.10%)#84 | 16,316,728(0.01%)#1,742 |
| 85. | Jeannette | 1,459 | 1,405,580(0.10%)#85 | 16,316,728(0.01%)#1,753 |
| 86. | Harleysville | 1,431 | 1,405,580(0.10%)#86 | 16,316,728(0.01%)#1,784 |
| 87. | Sharon | 1,425 | 1,405,580(0.10%)#87 | 16,316,728(0.01%)#1,789 |
| 88. | Castle Shannon Borough | 1,422 | 1,405,580(0.10%)#88 | 16,316,728(0.01%)#1,792 |
| 89. | Oakmont Borough | 1,420 | 1,405,580(0.10%)#89 | 16,316,728(0.01%)#1,794 |
| 90. | Beaver Falls | 1,406 | 1,405,580(0.10%)#90 | 16,316,728(0.01%)#1,815 |
| 91. | Wyomissing Borough | 1,405 | 1,405,580(0.10%)#91 | 16,316,728(0.01%)#1,816 |
| 92. | Blandon | 1,401 | 1,405,580(0.10%)#92 | 16,316,728(0.01%)#1,822 |
| 93. | Pottsville | 1,383 | 1,405,580(0.10%)#93 | 16,316,728(0.01%)#1,844 |
| 94. | Plymouth Meeting | 1,379 | 1,405,580(0.10%)#94 | 16,316,728(0.01%)#1,852 |
| 95. | Blue Bell | 1,341 | 1,405,580(0.10%)#95 | 16,316,728(0.01%)#1,908 |
| 96. | Wilson Borough | 1,299 | 1,405,580(0.09%)#96 | 16,316,728(0.01%)#1,966 |
| 97. | Perkasie Borough | 1,291 | 1,405,580(0.09%)#97 | 16,316,728(0.01%)#1,978 |
| 98. | Village Green Green Ridge | 1,265 | 1,405,580(0.09%)#98 | 16,316,728(0.01%)#2,015 |
| 99. | Washington | 1,264 | 1,405,580(0.09%)#99 | 16,316,728(0.01%)#2,016 |
| 100. | Meadville | 1,264 | 1,405,580(0.09%)#100 | 16,316,728(0.01%)#2,017 |
Common Questions
What are the Top 10 Cities with the Largest Italian Community in Pennsylvania?
Top 10 Cities with the Largest Italian Community in Pennsylvania are:
#1
108,240
#2
35,767
#3
12,599
#4
9,294
#5
8,024
#6
6,627
#7
6,315
#8
5,494
#9
5,441
#10
5,124
What city has the Largest Italian Community in Pennsylvania?
Philadelphia has the Largest Italian Community in Pennsylvania with 108,240.
What is the Total Italian Population in the State of Pennsylvania?
Total Italian Population in Pennsylvania is 1,405,580.
What is the Total Italian Population in the United States?
Total Italian Population in the United States is 16,316,728.