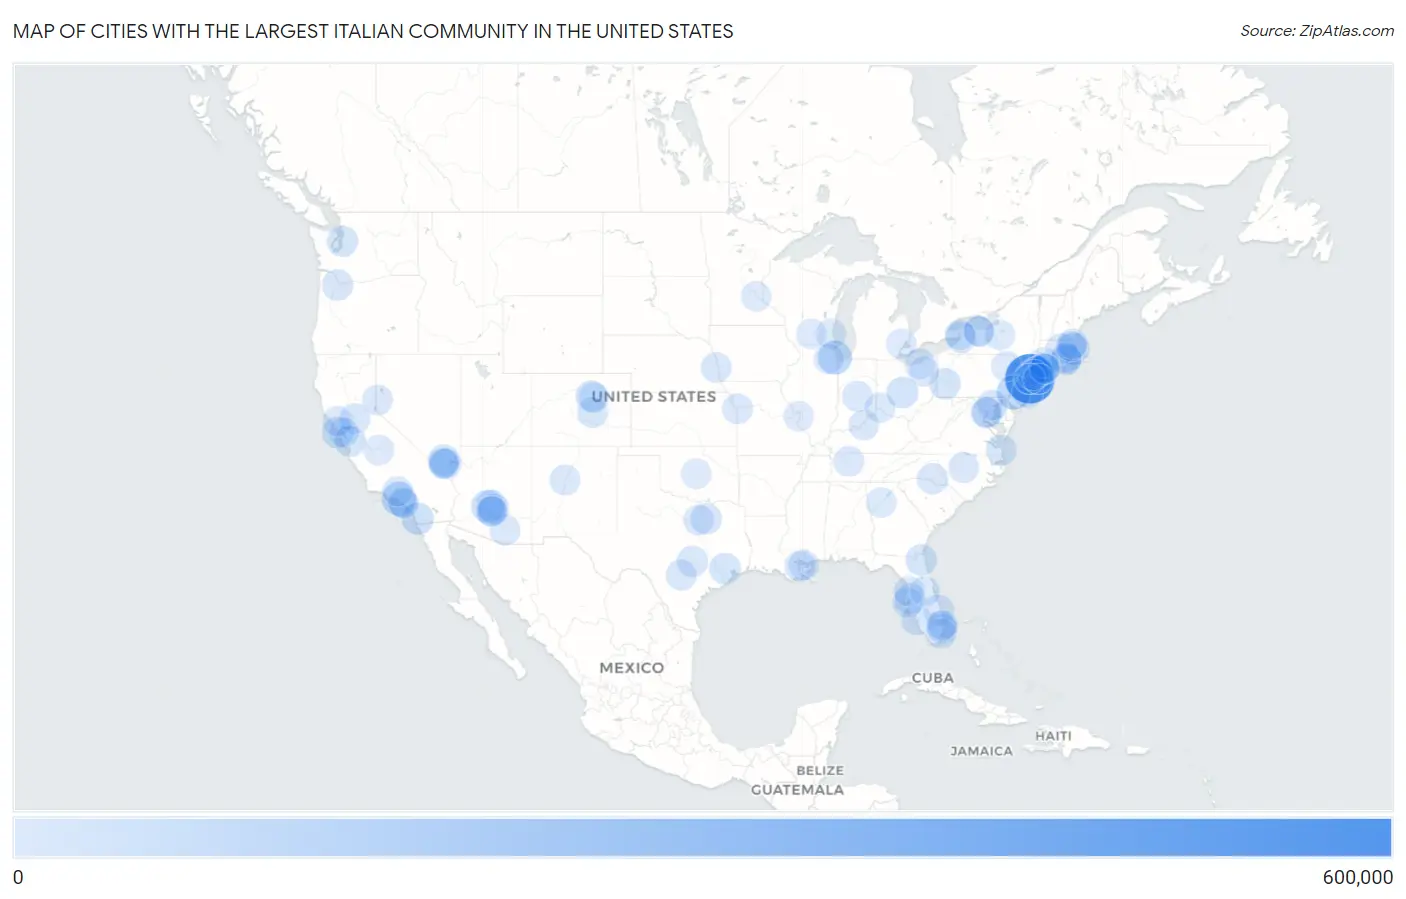
Cities with the Largest Italian Community in the United States
RELATED REPORTS & OPTIONS
Italian
United States
Compare Cities
Map of Cities with the Largest Italian Community in the United States
0
600,000
Cities with the Largest Italian Community in the United States
| City | Italian | vs State | vs National | |
| 1. | New York | 506,675 | 2,256,094(22.46%)#1 | 16,316,728(3.11%)#1 |
| 2. | Philadelphia | 108,240 | 1,405,580(7.70%)#1 | 16,316,728(0.66%)#2 |
| 3. | Los Angeles | 105,233 | 1,369,838(7.68%)#1 | 16,316,728(0.64%)#3 |
| 4. | Chicago | 103,645 | 701,382(14.78%)#1 | 16,316,728(0.64%)#4 |
| 5. | Phoenix | 60,900 | 294,690(20.67%)#1 | 16,316,728(0.37%)#5 |
| 6. | San Diego | 57,386 | 1,369,838(4.19%)#2 | 16,316,728(0.35%)#6 |
| 7. | Boston | 48,510 | 802,603(6.04%)#1 | 16,316,728(0.30%)#7 |
| 8. | Columbus | 43,135 | 694,652(6.21%)#1 | 16,316,728(0.26%)#8 |
| 9. | San Francisco | 38,497 | 1,369,838(2.81%)#3 | 16,316,728(0.24%)#9 |
| 10. | Houston | 38,161 | 542,080(7.04%)#1 | 16,316,728(0.23%)#10 |
| 11. | Denver | 37,275 | 279,072(13.36%)#1 | 16,316,728(0.23%)#11 |
| 12. | Pittsburgh | 35,767 | 1,405,580(2.54%)#2 | 16,316,728(0.22%)#12 |
| 13. | Jacksonville | 33,829 | 1,229,539(2.75%)#1 | 16,316,728(0.21%)#13 |
| 14. | Seattle | 33,670 | 250,568(13.44%)#1 | 16,316,728(0.21%)#14 |
| 15. | Las Vegas | 32,669 | 156,688(20.85%)#1 | 16,316,728(0.20%)#15 |
| 16. | San Jose | 32,436 | 1,369,838(2.37%)#4 | 16,316,728(0.20%)#16 |
| 17. | Charlotte | 29,903 | 335,066(8.92%)#1 | 16,316,728(0.18%)#17 |
| 18. | Austin | 29,597 | 542,080(5.46%)#2 | 16,316,728(0.18%)#18 |
| 19. | Portland | 29,237 | 151,732(19.27%)#1 | 16,316,728(0.18%)#19 |
| 20. | Washington | 28,294 | 28,294(100.00%)#1 | 16,316,728(0.17%)#20 |
| 21. | Buffalo | 28,068 | 2,256,094(1.24%)#2 | 16,316,728(0.17%)#21 |
| 22. | San Antonio | 27,167 | 542,080(5.01%)#3 | 16,316,728(0.17%)#22 |
| 23. | Virginia Beach | 25,217 | 334,275(7.54%)#1 | 16,316,728(0.15%)#23 |
| 24. | Toms River | 24,573 | 1,321,850(1.86%)#1 | 16,316,728(0.15%)#24 |
| 25. | Tampa | 24,160 | 1,229,539(1.96%)#2 | 16,316,728(0.15%)#25 |
| 26. | Dallas | 23,340 | 542,080(4.31%)#4 | 16,316,728(0.14%)#26 |
| 27. | Colorado Springs | 23,199 | 279,072(8.31%)#2 | 16,316,728(0.14%)#27 |
| 28. | Cranston | 21,593 | 165,626(13.04%)#1 | 16,316,728(0.13%)#28 |
| 29. | Yonkers | 21,584 | 2,256,094(0.96%)#3 | 16,316,728(0.13%)#29 |
| 30. | Henderson | 20,960 | 156,688(13.38%)#2 | 16,316,728(0.13%)#30 |
| 31. | Scottsdale | 19,568 | 294,690(6.64%)#2 | 16,316,728(0.12%)#31 |
| 32. | Omaha | 19,330 | 48,504(39.85%)#1 | 16,316,728(0.12%)#32 |
| 33. | Kansas City | 19,217 | 198,733(9.67%)#1 | 16,316,728(0.12%)#33 |
| 34. | Port St Lucie | 19,027 | 1,229,539(1.55%)#3 | 16,316,728(0.12%)#34 |
| 35. | Albuquerque | 18,418 | 48,523(37.96%)#1 | 16,316,728(0.11%)#35 |
| 36. | Tucson | 18,373 | 294,690(6.23%)#3 | 16,316,728(0.11%)#36 |
| 37. | Cape Coral | 18,353 | 1,229,539(1.49%)#4 | 16,316,728(0.11%)#37 |
| 38. | Baltimore | 18,108 | 283,327(6.39%)#1 | 16,316,728(0.11%)#38 |
| 39. | Worcester | 18,083 | 802,603(2.25%)#2 | 16,316,728(0.11%)#39 |
| 40. | Mesa | 17,896 | 294,690(6.07%)#4 | 16,316,728(0.11%)#40 |
| 41. | Indianapolis | 17,767 | 172,735(10.29%)#1 | 16,316,728(0.11%)#41 |
| 42. | Nashville | 17,699 | 155,480(11.38%)#1 | 16,316,728(0.11%)#42 |
| 43. | Raleigh | 17,666 | 335,066(5.27%)#2 | 16,316,728(0.11%)#43 |
| 44. | Sacramento | 17,623 | 1,369,838(1.29%)#5 | 16,316,728(0.11%)#44 |
| 45. | St Petersburg | 17,599 | 1,229,539(1.43%)#5 | 16,316,728(0.11%)#45 |
| 46. | Metairie | 17,074 | 198,629(8.60%)#1 | 16,316,728(0.10%)#46 |
| 47. | Spring Hill | 16,825 | 1,229,539(1.37%)#6 | 16,316,728(0.10%)#47 |
| 48. | Fort Worth | 16,578 | 542,080(3.06%)#5 | 16,316,728(0.10%)#48 |
| 49. | Warwick | 16,469 | 165,626(9.94%)#2 | 16,316,728(0.10%)#49 |
| 50. | Cleveland | 16,335 | 694,652(2.35%)#2 | 16,316,728(0.10%)#50 |
| 51. | Reno | 15,998 | 156,688(10.21%)#3 | 16,316,728(0.10%)#51 |
| 52. | Gilbert | 15,662 | 294,690(5.31%)#5 | 16,316,728(0.10%)#52 |
| 53. | Stamford | 15,537 | 572,842(2.71%)#1 | 16,316,728(0.10%)#53 |
| 54. | Louisville | 15,340 | 91,093(16.84%)#1 | 16,316,728(0.09%)#54 |
| 55. | Rochester | 15,190 | 2,256,094(0.67%)#4 | 16,316,728(0.09%)#55 |
| 56. | Arlington | 15,074 | 334,275(4.51%)#2 | 16,316,728(0.09%)#56 |
| 57. | Atlanta | 14,759 | 235,824(6.26%)#1 | 16,316,728(0.09%)#57 |
| 58. | New Orleans | 14,716 | 198,629(7.41%)#2 | 16,316,728(0.09%)#58 |
| 59. | Orlando | 14,652 | 1,229,539(1.19%)#7 | 16,316,728(0.09%)#59 |
| 60. | Fresno | 14,492 | 1,369,838(1.06%)#6 | 16,316,728(0.09%)#60 |
| 61. | Syracuse | 14,455 | 2,256,094(0.64%)#5 | 16,316,728(0.09%)#61 |
| 62. | Milwaukee | 14,344 | 202,351(7.09%)#1 | 16,316,728(0.09%)#62 |
| 63. | Jersey City | 14,072 | 1,321,850(1.06%)#2 | 16,316,728(0.09%)#63 |
| 64. | Levittown | 13,832 | 2,256,094(0.61%)#6 | 16,316,728(0.08%)#64 |
| 65. | Providence | 13,482 | 165,626(8.14%)#3 | 16,316,728(0.08%)#65 |
| 66. | Chandler | 13,329 | 294,690(4.52%)#6 | 16,316,728(0.08%)#66 |
| 67. | Huntington Beach | 13,200 | 1,369,838(0.96%)#7 | 16,316,728(0.08%)#67 |
| 68. | Long Beach | 13,088 | 1,369,838(0.96%)#8 | 16,316,728(0.08%)#68 |
| 69. | Fort Lauderdale | 13,014 | 1,229,539(1.06%)#8 | 16,316,728(0.08%)#69 |
| 70. | New Haven | 12,800 | 572,842(2.23%)#2 | 16,316,728(0.08%)#70 |
| 71. | Bridgeport | 12,797 | 572,842(2.23%)#3 | 16,316,728(0.08%)#71 |
| 72. | Scranton | 12,599 | 1,405,580(0.90%)#3 | 16,316,728(0.08%)#72 |
| 73. | Oakland | 12,539 | 1,369,838(0.92%)#9 | 16,316,728(0.08%)#73 |
| 74. | Akron | 12,275 | 694,652(1.77%)#3 | 16,316,728(0.08%)#74 |
| 75. | Aurora | 12,214 | 279,072(4.38%)#3 | 16,316,728(0.07%)#75 |
| 76. | Naperville | 12,075 | 701,382(1.72%)#2 | 16,316,728(0.07%)#76 |
| 77. | Spring Valley | 12,055 | 156,688(7.69%)#4 | 16,316,728(0.07%)#77 |
| 78. | Santa Rosa | 11,995 | 1,369,838(0.88%)#10 | 16,316,728(0.07%)#78 |
| 79. | Miami | 11,970 | 1,229,539(0.97%)#9 | 16,316,728(0.07%)#79 |
| 80. | Enterprise | 11,915 | 156,688(7.60%)#5 | 16,316,728(0.07%)#80 |
| 81. | St Louis | 11,900 | 198,733(5.99%)#2 | 16,316,728(0.07%)#81 |
| 82. | Norwalk | 11,855 | 572,842(2.07%)#4 | 16,316,728(0.07%)#82 |
| 83. | Waterbury | 11,776 | 572,842(2.06%)#5 | 16,316,728(0.07%)#83 |
| 84. | Milford City Balance | 11,673 | 572,842(2.04%)#6 | 16,316,728(0.07%)#84 |
| 85. | Cincinnati | 11,592 | 694,652(1.67%)#4 | 16,316,728(0.07%)#85 |
| 86. | New Rochelle | 11,565 | 2,256,094(0.51%)#7 | 16,316,728(0.07%)#86 |
| 87. | Coral Springs | 11,302 | 1,229,539(0.92%)#10 | 16,316,728(0.07%)#87 |
| 88. | Boca Raton | 11,283 | 1,229,539(0.92%)#11 | 16,316,728(0.07%)#88 |
| 89. | West Haven | 11,250 | 572,842(1.96%)#7 | 16,316,728(0.07%)#89 |
| 90. | Minneapolis | 11,243 | 125,847(8.93%)#1 | 16,316,728(0.07%)#90 |
| 91. | Oklahoma City | 11,166 | 66,962(16.68%)#1 | 16,316,728(0.07%)#91 |
| 92. | Santa Clarita | 11,091 | 1,369,838(0.81%)#11 | 16,316,728(0.07%)#92 |
| 93. | Tonawanda | 11,070 | 2,256,094(0.49%)#8 | 16,316,728(0.07%)#93 |
| 94. | Irondequoit | 10,974 | 2,256,094(0.49%)#9 | 16,316,728(0.07%)#94 |
| 95. | Hoboken | 10,945 | 1,321,850(0.83%)#3 | 16,316,728(0.07%)#95 |
| 96. | Sterling Heights | 10,888 | 443,221(2.46%)#1 | 16,316,728(0.07%)#96 |
| 97. | Peabody | 10,865 | 802,603(1.35%)#3 | 16,316,728(0.07%)#97 |
| 98. | Medford | 10,767 | 802,603(1.34%)#4 | 16,316,728(0.07%)#98 |
| 99. | Madison | 10,711 | 202,351(5.29%)#2 | 16,316,728(0.07%)#99 |
| 100. | West Babylon | 10,646 | 2,256,094(0.47%)#10 | 16,316,728(0.07%)#100 |
Common Questions
What are the Top 10 Cities with the Largest Italian Community in the United States?
Top 10 Cities with the Largest Italian Community in the United States are:
What city has the Largest Italian Community in the United States?
New York has the Largest Italian Community in the United States with 506,675.
What is the Total Italian Population in the United States?
Total Italian Population in the United States is 16,316,728.