Cities with the Largest Italian Community in New York
RELATED REPORTS & OPTIONS
Italian
New York
Compare Cities
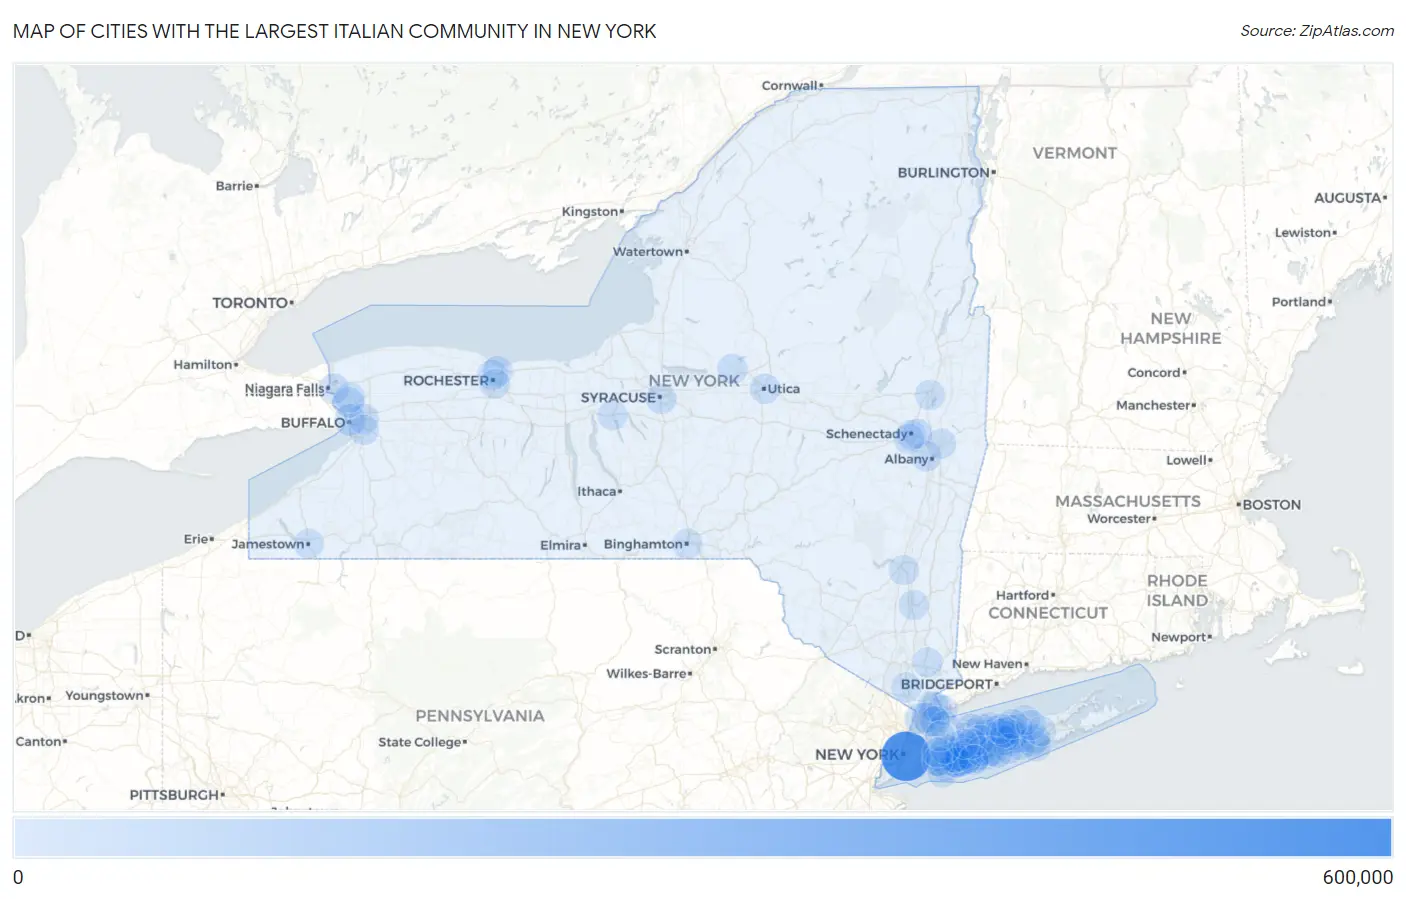
Map of Cities with the Largest Italian Community in New York
0
600,000
Cities with the Largest Italian Community in New York
| City | Italian | vs State | vs National | |
| 1. | New York | 506,675 | 2,256,094(22.46%)#1 | 16,316,728(3.11%)#1 |
| 2. | Buffalo | 28,068 | 2,256,094(1.24%)#2 | 16,316,728(0.17%)#21 |
| 3. | Yonkers | 21,584 | 2,256,094(0.96%)#3 | 16,316,728(0.13%)#29 |
| 4. | Rochester | 15,190 | 2,256,094(0.67%)#4 | 16,316,728(0.09%)#55 |
| 5. | Syracuse | 14,455 | 2,256,094(0.64%)#5 | 16,316,728(0.09%)#61 |
| 6. | Levittown | 13,832 | 2,256,094(0.61%)#6 | 16,316,728(0.08%)#64 |
| 7. | New Rochelle | 11,565 | 2,256,094(0.51%)#7 | 16,316,728(0.07%)#86 |
| 8. | Tonawanda | 11,070 | 2,256,094(0.49%)#8 | 16,316,728(0.07%)#93 |
| 9. | Irondequoit | 10,974 | 2,256,094(0.49%)#9 | 16,316,728(0.07%)#94 |
| 10. | West Babylon | 10,646 | 2,256,094(0.47%)#10 | 16,316,728(0.07%)#100 |
| 11. | Cheektowaga | 10,311 | 2,256,094(0.46%)#11 | 16,316,728(0.06%)#104 |
| 12. | Franklin Square | 10,130 | 2,256,094(0.45%)#12 | 16,316,728(0.06%)#109 |
| 13. | Albany | 10,042 | 2,256,094(0.45%)#13 | 16,316,728(0.06%)#111 |
| 14. | Utica | 9,846 | 2,256,094(0.44%)#14 | 16,316,728(0.06%)#118 |
| 15. | Commack | 9,743 | 2,256,094(0.43%)#15 | 16,316,728(0.06%)#120 |
| 16. | Coram | 9,554 | 2,256,094(0.42%)#16 | 16,316,728(0.06%)#129 |
| 17. | Niagara Falls | 9,473 | 2,256,094(0.42%)#17 | 16,316,728(0.06%)#132 |
| 18. | Centereach | 9,197 | 2,256,094(0.41%)#18 | 16,316,728(0.06%)#139 |
| 19. | West Islip | 9,106 | 2,256,094(0.40%)#19 | 16,316,728(0.06%)#142 |
| 20. | Harrison | 9,040 | 2,256,094(0.40%)#20 | 16,316,728(0.06%)#146 |
| 21. | Oceanside | 8,748 | 2,256,094(0.39%)#21 | 16,316,728(0.05%)#151 |
| 22. | West Seneca | 8,650 | 2,256,094(0.38%)#22 | 16,316,728(0.05%)#153 |
| 23. | Massapequa | 8,560 | 2,256,094(0.38%)#23 | 16,316,728(0.05%)#155 |
| 24. | North Massapequa | 8,087 | 2,256,094(0.36%)#24 | 16,316,728(0.05%)#174 |
| 25. | Holbrook | 8,043 | 2,256,094(0.36%)#25 | 16,316,728(0.05%)#176 |
| 26. | Lindenhurst | 7,906 | 2,256,094(0.35%)#26 | 16,316,728(0.05%)#182 |
| 27. | Smithtown | 7,786 | 2,256,094(0.35%)#27 | 16,316,728(0.05%)#185 |
| 28. | Schenectady | 7,634 | 2,256,094(0.34%)#28 | 16,316,728(0.05%)#196 |
| 29. | East Meadow | 7,069 | 2,256,094(0.31%)#29 | 16,316,728(0.04%)#218 |
| 30. | Rome | 6,914 | 2,256,094(0.31%)#30 | 16,316,728(0.04%)#224 |
| 31. | White Plains | 6,906 | 2,256,094(0.31%)#31 | 16,316,728(0.04%)#225 |
| 32. | Eastchester | 6,885 | 2,256,094(0.31%)#32 | 16,316,728(0.04%)#227 |
| 33. | Shirley | 6,705 | 2,256,094(0.30%)#33 | 16,316,728(0.04%)#233 |
| 34. | Garden City | 6,562 | 2,256,094(0.29%)#34 | 16,316,728(0.04%)#241 |
| 35. | Deer Park | 6,558 | 2,256,094(0.29%)#35 | 16,316,728(0.04%)#242 |
| 36. | Glen Cove | 6,512 | 2,256,094(0.29%)#36 | 16,316,728(0.04%)#246 |
| 37. | Hauppauge | 6,422 | 2,256,094(0.28%)#37 | 16,316,728(0.04%)#252 |
| 38. | Rotterdam | 6,408 | 2,256,094(0.28%)#38 | 16,316,728(0.04%)#254 |
| 39. | Hicksville | 6,376 | 2,256,094(0.28%)#39 | 16,316,728(0.04%)#257 |
| 40. | Binghamton | 6,358 | 2,256,094(0.28%)#40 | 16,316,728(0.04%)#259 |
| 41. | Long Beach | 6,279 | 2,256,094(0.28%)#41 | 16,316,728(0.04%)#269 |
| 42. | East Massapequa | 6,256 | 2,256,094(0.28%)#42 | 16,316,728(0.04%)#271 |
| 43. | Huntington Station | 6,147 | 2,256,094(0.27%)#43 | 16,316,728(0.04%)#276 |
| 44. | Selden | 6,034 | 2,256,094(0.27%)#44 | 16,316,728(0.04%)#282 |
| 45. | Holtsville | 6,024 | 2,256,094(0.27%)#45 | 16,316,728(0.04%)#284 |
| 46. | Massapequa Park | 5,983 | 2,256,094(0.27%)#46 | 16,316,728(0.04%)#288 |
| 47. | Wantagh | 5,931 | 2,256,094(0.26%)#47 | 16,316,728(0.04%)#290 |
| 48. | Medford | 5,735 | 2,256,094(0.25%)#48 | 16,316,728(0.04%)#303 |
| 49. | Rockville Centre | 5,660 | 2,256,094(0.25%)#49 | 16,316,728(0.03%)#309 |
| 50. | Seaford | 5,581 | 2,256,094(0.25%)#50 | 16,316,728(0.03%)#316 |
| 51. | North Bellmore | 5,547 | 2,256,094(0.25%)#51 | 16,316,728(0.03%)#317 |
| 52. | Auburn | 5,429 | 2,256,094(0.24%)#52 | 16,316,728(0.03%)#335 |
| 53. | Troy | 5,303 | 2,256,094(0.24%)#53 | 16,316,728(0.03%)#345 |
| 54. | Lynbrook | 5,247 | 2,256,094(0.23%)#54 | 16,316,728(0.03%)#351 |
| 55. | East Patchogue | 5,242 | 2,256,094(0.23%)#55 | 16,316,728(0.03%)#353 |
| 56. | New City | 5,187 | 2,256,094(0.23%)#56 | 16,316,728(0.03%)#358 |
| 57. | Bethpage | 5,165 | 2,256,094(0.23%)#57 | 16,316,728(0.03%)#362 |
| 58. | Lake Ronkonkoma | 5,157 | 2,256,094(0.23%)#58 | 16,316,728(0.03%)#364 |
| 59. | East Northport | 5,108 | 2,256,094(0.23%)#59 | 16,316,728(0.03%)#367 |
| 60. | Merrick | 5,063 | 2,256,094(0.22%)#60 | 16,316,728(0.03%)#371 |
| 61. | Saratoga Springs | 4,944 | 2,256,094(0.22%)#61 | 16,316,728(0.03%)#388 |
| 62. | Huntington | 4,912 | 2,256,094(0.22%)#62 | 16,316,728(0.03%)#394 |
| 63. | South Farmingdale | 4,898 | 2,256,094(0.22%)#63 | 16,316,728(0.03%)#395 |
| 64. | Kings Park | 4,886 | 2,256,094(0.22%)#64 | 16,316,728(0.03%)#396 |
| 65. | Port Chester | 4,873 | 2,256,094(0.22%)#65 | 16,316,728(0.03%)#399 |
| 66. | North Tonawanda | 4,820 | 2,256,094(0.21%)#66 | 16,316,728(0.03%)#408 |
| 67. | Ronkonkoma | 4,816 | 2,256,094(0.21%)#67 | 16,316,728(0.03%)#409 |
| 68. | Farmingville | 4,755 | 2,256,094(0.21%)#68 | 16,316,728(0.03%)#412 |
| 69. | Bellmore | 4,590 | 2,256,094(0.20%)#69 | 16,316,728(0.03%)#436 |
| 70. | Nesconset | 4,565 | 2,256,094(0.20%)#70 | 16,316,728(0.03%)#443 |
| 71. | Jamestown | 4,537 | 2,256,094(0.20%)#71 | 16,316,728(0.03%)#447 |
| 72. | Bay Shore | 4,452 | 2,256,094(0.20%)#72 | 16,316,728(0.03%)#462 |
| 73. | Brighton | 4,440 | 2,256,094(0.20%)#73 | 16,316,728(0.03%)#465 |
| 74. | Islip | 4,423 | 2,256,094(0.20%)#74 | 16,316,728(0.03%)#468 |
| 75. | Mastic | 4,423 | 2,256,094(0.20%)#75 | 16,316,728(0.03%)#469 |
| 76. | Dix Hills | 4,395 | 2,256,094(0.19%)#76 | 16,316,728(0.03%)#472 |
| 77. | Sayville | 4,393 | 2,256,094(0.19%)#77 | 16,316,728(0.03%)#473 |
| 78. | North Wantagh | 4,392 | 2,256,094(0.19%)#78 | 16,316,728(0.03%)#474 |
| 79. | Niskayuna | 4,386 | 2,256,094(0.19%)#79 | 16,316,728(0.03%)#475 |
| 80. | Mastic Beach | 4,341 | 2,256,094(0.19%)#80 | 16,316,728(0.03%)#481 |
| 81. | Manorville | 4,284 | 2,256,094(0.19%)#81 | 16,316,728(0.03%)#487 |
| 82. | North Babylon | 4,230 | 2,256,094(0.19%)#82 | 16,316,728(0.03%)#495 |
| 83. | Jefferson Valley Yorktown | 4,230 | 2,256,094(0.19%)#83 | 16,316,728(0.03%)#496 |
| 84. | East Islip | 4,106 | 2,256,094(0.18%)#84 | 16,316,728(0.03%)#517 |
| 85. | North Merrick | 3,993 | 2,256,094(0.18%)#85 | 16,316,728(0.02%)#532 |
| 86. | Valley Stream | 3,914 | 2,256,094(0.17%)#86 | 16,316,728(0.02%)#544 |
| 87. | St James | 3,891 | 2,256,094(0.17%)#87 | 16,316,728(0.02%)#548 |
| 88. | Rocky Point | 3,865 | 2,256,094(0.17%)#88 | 16,316,728(0.02%)#552 |
| 89. | Kingston | 3,795 | 2,256,094(0.17%)#89 | 16,316,728(0.02%)#559 |
| 90. | Mineola | 3,767 | 2,256,094(0.17%)#90 | 16,316,728(0.02%)#564 |
| 91. | Mamaroneck | 3,762 | 2,256,094(0.17%)#91 | 16,316,728(0.02%)#566 |
| 92. | Ridge | 3,738 | 2,256,094(0.17%)#92 | 16,316,728(0.02%)#570 |
| 93. | Poughkeepsie | 3,671 | 2,256,094(0.16%)#93 | 16,316,728(0.02%)#587 |
| 94. | Lake Grove | 3,667 | 2,256,094(0.16%)#94 | 16,316,728(0.02%)#589 |
| 95. | Port Washington | 3,665 | 2,256,094(0.16%)#95 | 16,316,728(0.02%)#590 |
| 96. | Melville | 3,647 | 2,256,094(0.16%)#96 | 16,316,728(0.02%)#592 |
| 97. | Terryville | 3,620 | 2,256,094(0.16%)#97 | 16,316,728(0.02%)#597 |
| 98. | Plainview | 3,531 | 2,256,094(0.16%)#98 | 16,316,728(0.02%)#622 |
| 99. | Copiague | 3,508 | 2,256,094(0.16%)#99 | 16,316,728(0.02%)#628 |
| 100. | Floral Park | 3,487 | 2,256,094(0.15%)#100 | 16,316,728(0.02%)#631 |
Common Questions
What are the Top 10 Cities with the Largest Italian Community in New York?
Top 10 Cities with the Largest Italian Community in New York are:
#1
506,675
#2
28,068
#3
21,584
#4
15,190
#5
14,455
#6
13,832
#7
11,565
#8
11,070
#9
10,974
#10
10,646
What city has the Largest Italian Community in New York?
New York has the Largest Italian Community in New York with 506,675.
What is the Total Italian Population in the State of New York?
Total Italian Population in New York is 2,256,094.
What is the Total Italian Population in the United States?
Total Italian Population in the United States is 16,316,728.