Cities with the Largest Italian Community in Ohio
RELATED REPORTS & OPTIONS
Italian
Ohio
Compare Cities
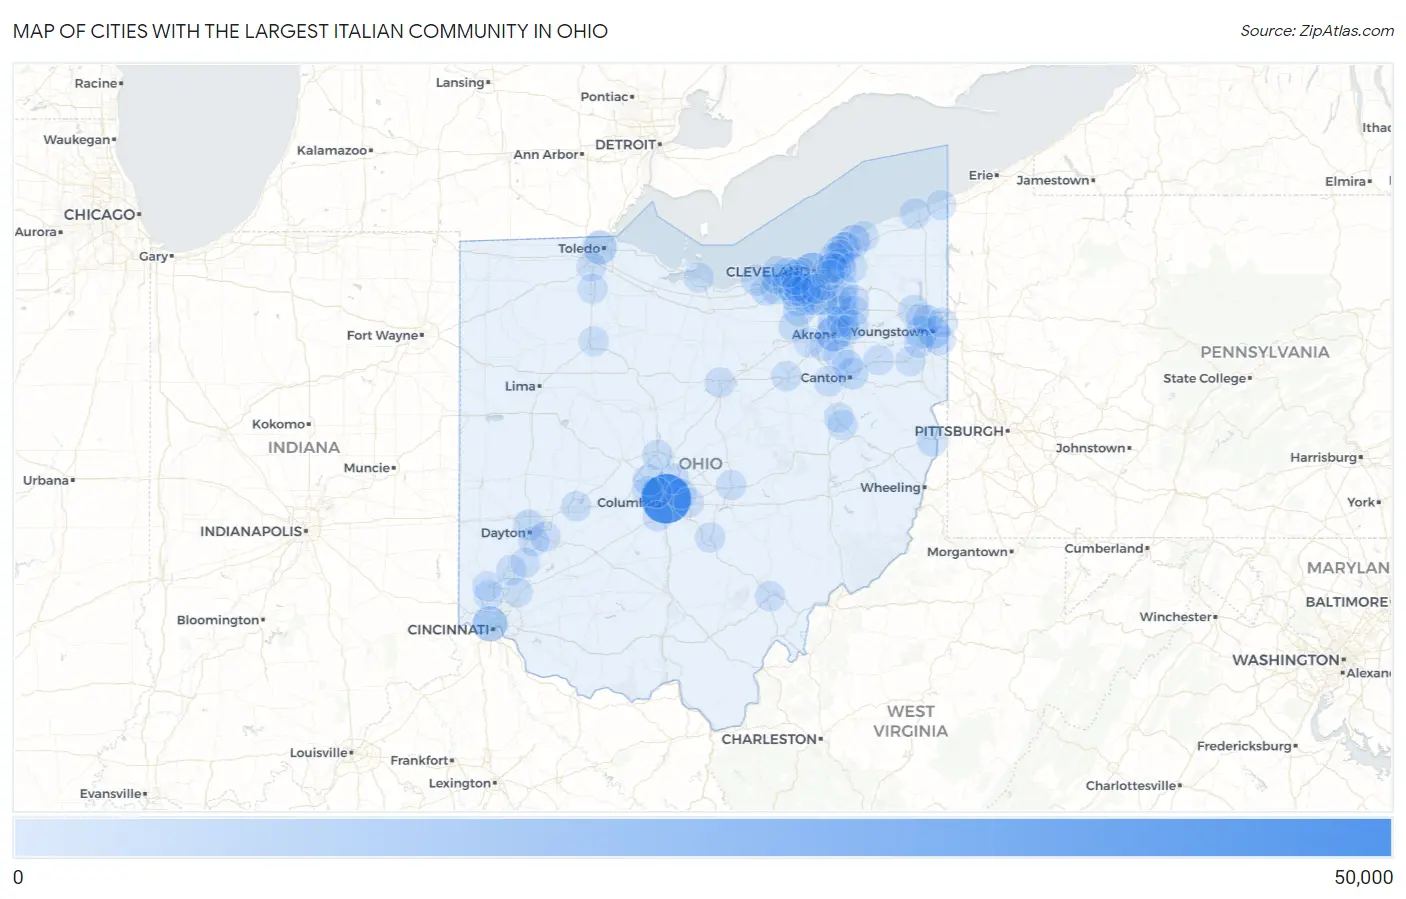
Map of Cities with the Largest Italian Community in Ohio
0
50,000
Cities with the Largest Italian Community in Ohio
| City | Italian | vs State | vs National | |
| 1. | Columbus | 43,135 | 694,652(6.21%)#1 | 16,316,728(0.26%)#8 |
| 2. | Cleveland | 16,335 | 694,652(2.35%)#2 | 16,316,728(0.10%)#50 |
| 3. | Akron | 12,275 | 694,652(1.77%)#3 | 16,316,728(0.08%)#74 |
| 4. | Cincinnati | 11,592 | 694,652(1.67%)#4 | 16,316,728(0.07%)#85 |
| 5. | Parma | 9,623 | 694,652(1.39%)#5 | 16,316,728(0.06%)#126 |
| 6. | Toledo | 8,518 | 694,652(1.23%)#6 | 16,316,728(0.05%)#158 |
| 7. | Mentor | 7,366 | 694,652(1.06%)#7 | 16,316,728(0.05%)#209 |
| 8. | Austintown | 6,455 | 694,652(0.93%)#8 | 16,316,728(0.04%)#248 |
| 9. | Lakewood | 6,373 | 694,652(0.92%)#9 | 16,316,728(0.04%)#258 |
| 10. | Youngstown | 5,949 | 694,652(0.86%)#10 | 16,316,728(0.04%)#289 |
| 11. | Strongsville | 5,622 | 694,652(0.81%)#11 | 16,316,728(0.03%)#312 |
| 12. | Cuyahoga Falls | 5,207 | 694,652(0.75%)#12 | 16,316,728(0.03%)#356 |
| 13. | Canton | 4,466 | 694,652(0.64%)#13 | 16,316,728(0.03%)#456 |
| 14. | Willoughby | 4,377 | 694,652(0.63%)#14 | 16,316,728(0.03%)#477 |
| 15. | Dublin | 4,234 | 694,652(0.61%)#15 | 16,316,728(0.03%)#494 |
| 16. | Stow | 4,078 | 694,652(0.59%)#16 | 16,316,728(0.02%)#521 |
| 17. | Brunswick | 4,072 | 694,652(0.59%)#17 | 16,316,728(0.02%)#523 |
| 18. | North Royalton | 3,914 | 694,652(0.56%)#18 | 16,316,728(0.02%)#545 |
| 19. | North Ridgeville | 3,768 | 694,652(0.54%)#19 | 16,316,728(0.02%)#563 |
| 20. | Lorain | 3,736 | 694,652(0.54%)#20 | 16,316,728(0.02%)#571 |
| 21. | Elyria | 3,595 | 694,652(0.52%)#21 | 16,316,728(0.02%)#605 |
| 22. | Dayton | 3,551 | 694,652(0.51%)#22 | 16,316,728(0.02%)#617 |
| 23. | Westlake | 3,546 | 694,652(0.51%)#23 | 16,316,728(0.02%)#618 |
| 24. | Hudson | 3,411 | 694,652(0.49%)#24 | 16,316,728(0.02%)#648 |
| 25. | Broadview Heights | 3,360 | 694,652(0.48%)#25 | 16,316,728(0.02%)#658 |
| 26. | Mayfield Heights | 3,340 | 694,652(0.48%)#26 | 16,316,728(0.02%)#665 |
| 27. | Westerville | 3,217 | 694,652(0.46%)#27 | 16,316,728(0.02%)#687 |
| 28. | Steubenville | 3,177 | 694,652(0.46%)#28 | 16,316,728(0.02%)#696 |
| 29. | Niles | 2,970 | 694,652(0.43%)#29 | 16,316,728(0.02%)#767 |
| 30. | Twinsburg | 2,922 | 694,652(0.42%)#30 | 16,316,728(0.02%)#782 |
| 31. | Ashtabula | 2,898 | 694,652(0.42%)#31 | 16,316,728(0.02%)#794 |
| 32. | Eastlake | 2,890 | 694,652(0.42%)#32 | 16,316,728(0.02%)#799 |
| 33. | Rocky River | 2,832 | 694,652(0.41%)#33 | 16,316,728(0.02%)#814 |
| 34. | Avon | 2,749 | 694,652(0.40%)#34 | 16,316,728(0.02%)#854 |
| 35. | Solon | 2,727 | 694,652(0.39%)#35 | 16,316,728(0.02%)#865 |
| 36. | North Olmsted | 2,689 | 694,652(0.39%)#36 | 16,316,728(0.02%)#886 |
| 37. | Upper Arlington | 2,653 | 694,652(0.38%)#37 | 16,316,728(0.02%)#903 |
| 38. | Avon Lake | 2,642 | 694,652(0.38%)#38 | 16,316,728(0.02%)#907 |
| 39. | Warren | 2,572 | 694,652(0.37%)#39 | 16,316,728(0.02%)#926 |
| 40. | Medina | 2,564 | 694,652(0.37%)#40 | 16,316,728(0.02%)#931 |
| 41. | Delaware | 2,516 | 694,652(0.36%)#41 | 16,316,728(0.02%)#957 |
| 42. | Hilliard | 2,465 | 694,652(0.35%)#42 | 16,316,728(0.02%)#984 |
| 43. | Cleveland Heights | 2,431 | 694,652(0.35%)#43 | 16,316,728(0.01%)#992 |
| 44. | Tallmadge | 2,407 | 694,652(0.35%)#44 | 16,316,728(0.01%)#1,002 |
| 45. | Highland Heights | 2,402 | 694,652(0.35%)#45 | 16,316,728(0.01%)#1,006 |
| 46. | Kettering | 2,360 | 694,652(0.34%)#46 | 16,316,728(0.01%)#1,029 |
| 47. | Green | 2,360 | 694,652(0.34%)#47 | 16,316,728(0.01%)#1,030 |
| 48. | Streetsboro | 2,350 | 694,652(0.34%)#48 | 16,316,728(0.01%)#1,037 |
| 49. | North Canton | 2,314 | 694,652(0.33%)#49 | 16,316,728(0.01%)#1,057 |
| 50. | Massillon | 2,309 | 694,652(0.33%)#50 | 16,316,728(0.01%)#1,059 |
| 51. | Gahanna | 2,306 | 694,652(0.33%)#51 | 16,316,728(0.01%)#1,060 |
| 52. | Mansfield | 2,303 | 694,652(0.33%)#52 | 16,316,728(0.01%)#1,061 |
| 53. | Beavercreek | 2,265 | 694,652(0.33%)#53 | 16,316,728(0.01%)#1,076 |
| 54. | Struthers | 2,258 | 694,652(0.33%)#54 | 16,316,728(0.01%)#1,081 |
| 55. | Macedonia | 2,245 | 694,652(0.32%)#55 | 16,316,728(0.01%)#1,091 |
| 56. | Newark | 2,213 | 694,652(0.32%)#56 | 16,316,728(0.01%)#1,106 |
| 57. | Willowick | 2,200 | 694,652(0.32%)#57 | 16,316,728(0.01%)#1,117 |
| 58. | Grove City | 2,195 | 694,652(0.32%)#58 | 16,316,728(0.01%)#1,120 |
| 59. | Berea | 2,138 | 694,652(0.31%)#59 | 16,316,728(0.01%)#1,151 |
| 60. | Parma Heights | 2,101 | 694,652(0.30%)#60 | 16,316,728(0.01%)#1,174 |
| 61. | Euclid | 2,098 | 694,652(0.30%)#61 | 16,316,728(0.01%)#1,175 |
| 62. | Brook Park | 2,033 | 694,652(0.29%)#62 | 16,316,728(0.01%)#1,229 |
| 63. | Aurora | 2,032 | 694,652(0.29%)#63 | 16,316,728(0.01%)#1,231 |
| 64. | Alliance | 2,018 | 694,652(0.29%)#64 | 16,316,728(0.01%)#1,242 |
| 65. | Kent | 1,996 | 694,652(0.29%)#65 | 16,316,728(0.01%)#1,260 |
| 66. | New Philadelphia | 1,958 | 694,652(0.28%)#66 | 16,316,728(0.01%)#1,283 |
| 67. | Lancaster | 1,956 | 694,652(0.28%)#67 | 16,316,728(0.01%)#1,288 |
| 68. | Brecksville | 1,948 | 694,652(0.28%)#68 | 16,316,728(0.01%)#1,298 |
| 69. | Wooster | 1,945 | 694,652(0.28%)#69 | 16,316,728(0.01%)#1,300 |
| 70. | Wickliffe | 1,940 | 694,652(0.28%)#70 | 16,316,728(0.01%)#1,304 |
| 71. | Middletown | 1,920 | 694,652(0.28%)#71 | 16,316,728(0.01%)#1,322 |
| 72. | Middleburg Heights | 1,899 | 694,652(0.27%)#72 | 16,316,728(0.01%)#1,336 |
| 73. | Girard | 1,897 | 694,652(0.27%)#73 | 16,316,728(0.01%)#1,339 |
| 74. | Garfield Heights | 1,853 | 694,652(0.27%)#74 | 16,316,728(0.01%)#1,380 |
| 75. | Athens | 1,836 | 694,652(0.26%)#75 | 16,316,728(0.01%)#1,389 |
| 76. | Lyndhurst | 1,820 | 694,652(0.26%)#76 | 16,316,728(0.01%)#1,397 |
| 77. | Canfield | 1,819 | 694,652(0.26%)#77 | 16,316,728(0.01%)#1,399 |
| 78. | Springfield | 1,815 | 694,652(0.26%)#78 | 16,316,728(0.01%)#1,404 |
| 79. | Fairview Park | 1,779 | 694,652(0.26%)#79 | 16,316,728(0.01%)#1,429 |
| 80. | South Euclid | 1,763 | 694,652(0.25%)#80 | 16,316,728(0.01%)#1,442 |
| 81. | Seven Hills | 1,754 | 694,652(0.25%)#81 | 16,316,728(0.01%)#1,447 |
| 82. | Shaker Heights | 1,727 | 694,652(0.25%)#82 | 16,316,728(0.01%)#1,471 |
| 83. | Painesville | 1,682 | 694,652(0.24%)#83 | 16,316,728(0.01%)#1,498 |
| 84. | Perrysburg | 1,670 | 694,652(0.24%)#84 | 16,316,728(0.01%)#1,508 |
| 85. | Sandusky | 1,663 | 694,652(0.24%)#85 | 16,316,728(0.01%)#1,514 |
| 86. | Fairfield | 1,644 | 694,652(0.24%)#86 | 16,316,728(0.01%)#1,524 |
| 87. | Hamilton | 1,615 | 694,652(0.23%)#87 | 16,316,728(0.01%)#1,558 |
| 88. | Dover | 1,614 | 694,652(0.23%)#88 | 16,316,728(0.01%)#1,562 |
| 89. | Bay Village | 1,574 | 694,652(0.23%)#89 | 16,316,728(0.01%)#1,609 |
| 90. | Findlay | 1,570 | 694,652(0.23%)#90 | 16,316,728(0.01%)#1,615 |
| 91. | Bowling Green | 1,563 | 694,652(0.23%)#91 | 16,316,728(0.01%)#1,624 |
| 92. | Wadsworth | 1,545 | 694,652(0.22%)#92 | 16,316,728(0.01%)#1,648 |
| 93. | Springboro | 1,519 | 694,652(0.22%)#93 | 16,316,728(0.01%)#1,678 |
| 94. | Chesterland | 1,486 | 694,652(0.21%)#94 | 16,316,728(0.01%)#1,711 |
| 95. | Salem | 1,472 | 694,652(0.21%)#95 | 16,316,728(0.01%)#1,733 |
| 96. | Reynoldsburg | 1,468 | 694,652(0.21%)#96 | 16,316,728(0.01%)#1,737 |
| 97. | Barberton | 1,459 | 694,652(0.21%)#97 | 16,316,728(0.01%)#1,752 |
| 98. | Mason | 1,425 | 694,652(0.21%)#98 | 16,316,728(0.01%)#1,788 |
| 99. | Hubbard | 1,417 | 694,652(0.20%)#99 | 16,316,728(0.01%)#1,797 |
| 100. | Conneaut | 1,395 | 694,652(0.20%)#100 | 16,316,728(0.01%)#1,829 |
Common Questions
What are the Top 10 Cities with the Largest Italian Community in Ohio?
Top 10 Cities with the Largest Italian Community in Ohio are:
#1
43,135
#2
16,335
#3
12,275
#4
11,592
#5
9,623
#6
8,518
#7
7,366
#8
6,455
#9
6,373
#10
5,949
What city has the Largest Italian Community in Ohio?
Columbus has the Largest Italian Community in Ohio with 43,135.
What is the Total Italian Population in the State of Ohio?
Total Italian Population in Ohio is 694,652.
What is the Total Italian Population in the United States?
Total Italian Population in the United States is 16,316,728.