Cities with the Largest Italian Community in Connecticut
RELATED REPORTS & OPTIONS
Italian
Connecticut
Compare Cities
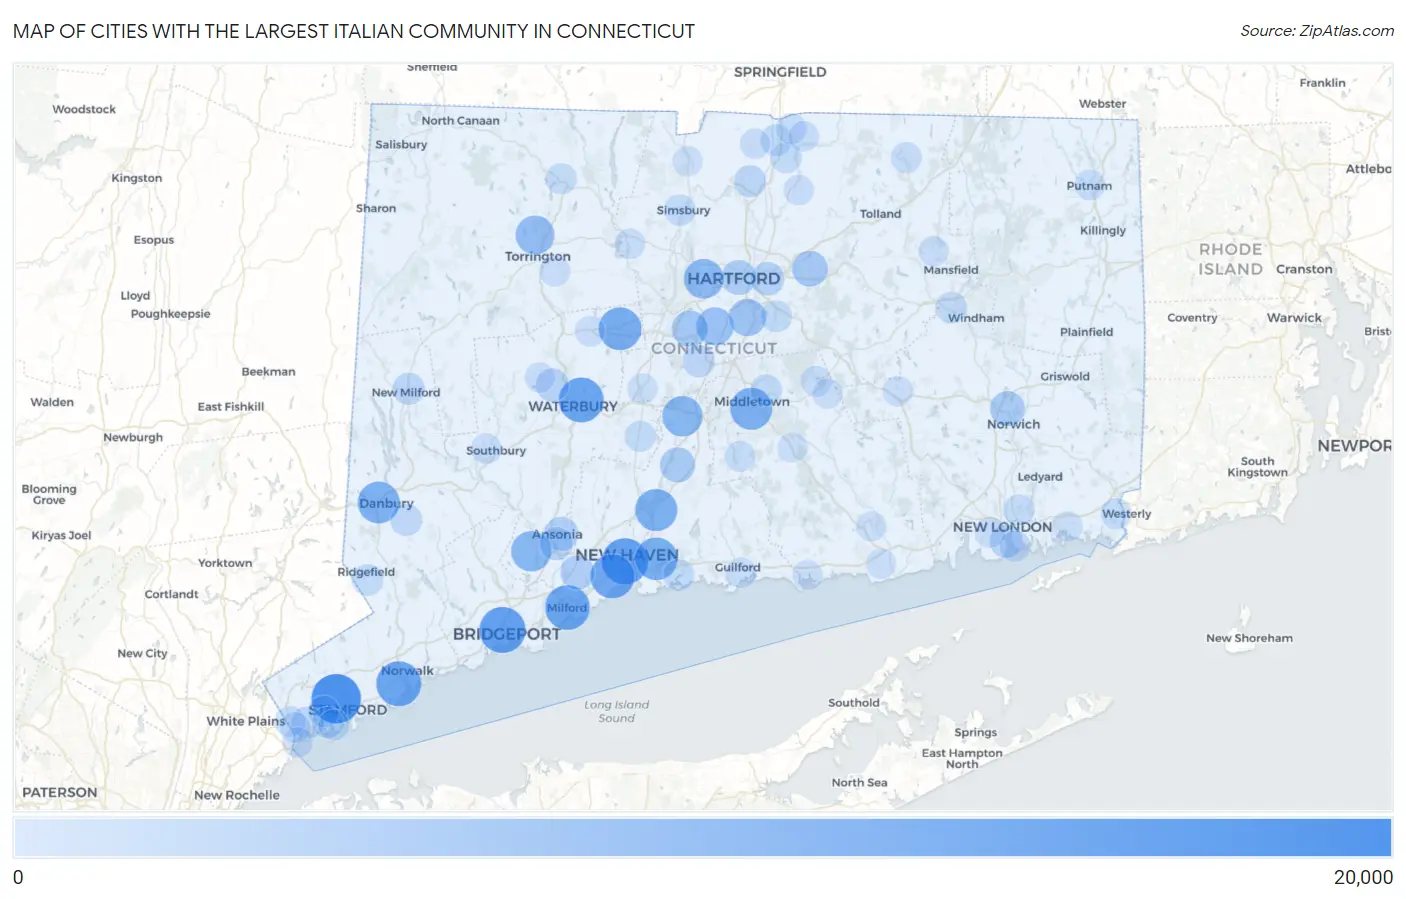
Map of Cities with the Largest Italian Community in Connecticut
0
20,000
Cities with the Largest Italian Community in Connecticut
| City | Italian | vs State | vs National | |
| 1. | Stamford | 15,537 | 572,842(2.71%)#1 | 16,316,728(0.10%)#53 |
| 2. | New Haven | 12,800 | 572,842(2.23%)#2 | 16,316,728(0.08%)#70 |
| 3. | Bridgeport | 12,797 | 572,842(2.23%)#3 | 16,316,728(0.08%)#71 |
| 4. | Norwalk | 11,855 | 572,842(2.07%)#4 | 16,316,728(0.07%)#82 |
| 5. | Waterbury | 11,776 | 572,842(2.06%)#5 | 16,316,728(0.07%)#83 |
| 6. | Milford City Balance | 11,673 | 572,842(2.04%)#6 | 16,316,728(0.07%)#84 |
| 7. | West Haven | 11,250 | 572,842(1.96%)#7 | 16,316,728(0.07%)#89 |
| 8. | Bristol | 10,177 | 572,842(1.78%)#8 | 16,316,728(0.06%)#106 |
| 9. | East Haven | 9,948 | 572,842(1.74%)#9 | 16,316,728(0.06%)#114 |
| 10. | North Haven | 9,656 | 572,842(1.69%)#10 | 16,316,728(0.06%)#124 |
| 11. | Middletown | 9,595 | 572,842(1.67%)#11 | 16,316,728(0.06%)#128 |
| 12. | Danbury | 9,477 | 572,842(1.65%)#12 | 16,316,728(0.06%)#131 |
| 13. | Shelton | 8,243 | 572,842(1.44%)#13 | 16,316,728(0.05%)#167 |
| 14. | Meriden | 8,226 | 572,842(1.44%)#14 | 16,316,728(0.05%)#168 |
| 15. | West Hartford | 7,720 | 572,842(1.35%)#15 | 16,316,728(0.05%)#190 |
| 16. | Torrington | 7,069 | 572,842(1.23%)#16 | 16,316,728(0.04%)#219 |
| 17. | Newington | 6,161 | 572,842(1.08%)#17 | 16,316,728(0.04%)#275 |
| 18. | Wethersfield | 5,761 | 572,842(1.01%)#18 | 16,316,728(0.04%)#299 |
| 19. | Naugatuck Borough | 5,444 | 572,842(0.95%)#19 | 16,316,728(0.03%)#331 |
| 20. | New Britain | 5,060 | 572,842(0.88%)#20 | 16,316,728(0.03%)#372 |
| 21. | Manchester | 4,692 | 572,842(0.82%)#21 | 16,316,728(0.03%)#420 |
| 22. | Wallingford Center | 4,219 | 572,842(0.74%)#22 | 16,316,728(0.03%)#498 |
| 23. | Norwich | 4,182 | 572,842(0.73%)#23 | 16,316,728(0.03%)#505 |
| 24. | Hartford | 4,074 | 572,842(0.71%)#24 | 16,316,728(0.02%)#522 |
| 25. | Orange | 3,594 | 572,842(0.63%)#25 | 16,316,728(0.02%)#607 |
| 26. | Ansonia | 3,356 | 572,842(0.59%)#26 | 16,316,728(0.02%)#661 |
| 27. | East Hartford | 2,989 | 572,842(0.52%)#27 | 16,316,728(0.02%)#760 |
| 28. | Oakville | 2,719 | 572,842(0.47%)#28 | 16,316,728(0.02%)#870 |
| 29. | New London | 2,713 | 572,842(0.47%)#29 | 16,316,728(0.02%)#873 |
| 30. | Derby | 2,676 | 572,842(0.47%)#30 | 16,316,728(0.02%)#894 |
| 31. | Northford | 2,641 | 572,842(0.46%)#31 | 16,316,728(0.02%)#908 |
| 32. | Sandy Hook | 2,558 | 572,842(0.45%)#32 | 16,316,728(0.02%)#936 |
| 33. | Greenwich | 2,073 | 572,842(0.36%)#33 | 16,316,728(0.01%)#1,192 |
| 34. | Trumbull Center | 2,028 | 572,842(0.35%)#34 | 16,316,728(0.01%)#1,234 |
| 35. | Kensington | 2,004 | 572,842(0.35%)#35 | 16,316,728(0.01%)#1,252 |
| 36. | New Milford | 1,913 | 572,842(0.33%)#36 | 16,316,728(0.01%)#1,326 |
| 37. | Windsor Locks | 1,896 | 572,842(0.33%)#37 | 16,316,728(0.01%)#1,340 |
| 38. | Bethel | 1,815 | 572,842(0.32%)#38 | 16,316,728(0.01%)#1,406 |
| 39. | Daniels Farm | 1,727 | 572,842(0.30%)#39 | 16,316,728(0.01%)#1,472 |
| 40. | Willimantic | 1,583 | 572,842(0.28%)#40 | 16,316,728(0.01%)#1,596 |
| 41. | Thompsonville | 1,583 | 572,842(0.28%)#41 | 16,316,728(0.01%)#1,599 |
| 42. | Glastonbury Center | 1,540 | 572,842(0.27%)#42 | 16,316,728(0.01%)#1,653 |
| 43. | Ridgefield | 1,490 | 572,842(0.26%)#43 | 16,316,728(0.01%)#1,708 |
| 44. | East | 1,451 | 572,842(0.25%)#44 | 16,316,728(0.01%)#1,765 |
| 45. | Cos Cob | 1,447 | 572,842(0.25%)#45 | 16,316,728(0.01%)#1,771 |
| 46. | Portland | 1,444 | 572,842(0.25%)#46 | 16,316,728(0.01%)#1,773 |
| 47. | Branford Center | 1,375 | 572,842(0.24%)#47 | 16,316,728(0.01%)#1,857 |
| 48. | Riverside | 1,374 | 572,842(0.24%)#48 | 16,316,728(0.01%)#1,859 |
| 49. | Simsbury Center | 1,357 | 572,842(0.24%)#49 | 16,316,728(0.01%)#1,888 |
| 50. | Quinnipiac University | 1,343 | 572,842(0.23%)#50 | 16,316,728(0.01%)#1,906 |
| 51. | Southwood Acres | 1,319 | 572,842(0.23%)#51 | 16,316,728(0.01%)#1,931 |
| 52. | Winsted | 1,233 | 572,842(0.22%)#52 | 16,316,728(0.01%)#2,058 |
| 53. | Cheshire Village | 1,229 | 572,842(0.21%)#53 | 16,316,728(0.01%)#2,062 |
| 54. | Old Greenwich | 1,223 | 572,842(0.21%)#54 | 16,316,728(0.01%)#2,071 |
| 55. | Conning Towers Nautilus Park | 1,218 | 572,842(0.21%)#55 | 16,316,728(0.01%)#2,078 |
| 56. | Staples | 1,218 | 572,842(0.21%)#56 | 16,316,728(0.01%)#2,079 |
| 57. | Pawcatuck | 1,157 | 572,842(0.20%)#57 | 16,316,728(0.01%)#2,162 |
| 58. | Stepney | 1,101 | 572,842(0.19%)#58 | 16,316,728(0.01%)#2,265 |
| 59. | Stafford Springs | 1,093 | 572,842(0.19%)#59 | 16,316,728(0.01%)#2,271 |
| 60. | Groton | 1,084 | 572,842(0.19%)#60 | 16,316,728(0.01%)#2,280 |
| 61. | Oronoque | 1,054 | 572,842(0.18%)#61 | 16,316,728(0.01%)#2,339 |
| 62. | Tashua | 1,035 | 572,842(0.18%)#62 | 16,316,728(0.01%)#2,372 |
| 63. | Lake Pocotopaug | 1,034 | 572,842(0.18%)#63 | 16,316,728(0.01%)#2,373 |
| 64. | Durham | 999 | 572,842(0.17%)#64 | 16,316,728(0.01%)#2,448 |
| 65. | Glenville | 987 | 572,842(0.17%)#65 | 16,316,728(0.01%)#2,466 |
| 66. | Pemberwick | 984 | 572,842(0.17%)#66 | 16,316,728(0.01%)#2,475 |
| 67. | Greens Farms | 942 | 572,842(0.16%)#67 | 16,316,728(0.01%)#2,574 |
| 68. | Fairfield University | 916 | 572,842(0.16%)#68 | 16,316,728(0.01%)#2,624 |
| 69. | Sherwood Manor | 907 | 572,842(0.16%)#69 | 16,316,728(0.01%)#2,652 |
| 70. | Putnam | 891 | 572,842(0.16%)#70 | 16,316,728(0.01%)#2,684 |
| 71. | Lordship | 850 | 572,842(0.15%)#71 | 16,316,728(0.01%)#2,790 |
| 72. | Byram | 841 | 572,842(0.15%)#72 | 16,316,728(0.01%)#2,813 |
| 73. | Heritage Village | 820 | 572,842(0.14%)#73 | 16,316,728(0.01%)#2,889 |
| 74. | Waterford | 807 | 572,842(0.14%)#74 | 16,316,728(0.00%)#2,925 |
| 75. | Collinsville | 780 | 572,842(0.14%)#75 | 16,316,728(0.00%)#2,987 |
| 76. | Colchester | 771 | 572,842(0.13%)#76 | 16,316,728(0.00%)#3,005 |
| 77. | Hazardville | 768 | 572,842(0.13%)#77 | 16,316,728(0.00%)#3,019 |
| 78. | Storrs | 761 | 572,842(0.13%)#78 | 16,316,728(0.00%)#3,045 |
| 79. | Broad Brook | 727 | 572,842(0.13%)#79 | 16,316,728(0.00%)#3,166 |
| 80. | Jewett City Borough | 725 | 572,842(0.13%)#80 | 16,316,728(0.00%)#3,173 |
| 81. | Ball Pond | 713 | 572,842(0.12%)#81 | 16,316,728(0.00%)#3,203 |
| 82. | Northwest Harwinton | 708 | 572,842(0.12%)#82 | 16,316,728(0.00%)#3,224 |
| 83. | New Canaan | 703 | 572,842(0.12%)#83 | 16,316,728(0.00%)#3,246 |
| 84. | Suffield Depot | 692 | 572,842(0.12%)#84 | 16,316,728(0.00%)#3,292 |
| 85. | Ridgebury | 672 | 572,842(0.12%)#85 | 16,316,728(0.00%)#3,370 |
| 86. | Plantsville | 646 | 572,842(0.11%)#86 | 16,316,728(0.00%)#3,480 |
| 87. | Terryville | 641 | 572,842(0.11%)#87 | 16,316,728(0.00%)#3,497 |
| 88. | Noroton | 609 | 572,842(0.11%)#88 | 16,316,728(0.00%)#3,624 |
| 89. | Watertown | 607 | 572,842(0.11%)#89 | 16,316,728(0.00%)#3,637 |
| 90. | Guilford Center | 603 | 572,842(0.11%)#90 | 16,316,728(0.00%)#3,657 |
| 91. | Salmon Brook | 593 | 572,842(0.10%)#91 | 16,316,728(0.00%)#3,708 |
| 92. | Compo | 562 | 572,842(0.10%)#92 | 16,316,728(0.00%)#3,878 |
| 93. | Newtown Borough | 550 | 572,842(0.10%)#93 | 16,316,728(0.00%)#3,935 |
| 94. | Mystic | 509 | 572,842(0.09%)#94 | 16,316,728(0.00%)#4,160 |
| 95. | East Hampton | 508 | 572,842(0.09%)#95 | 16,316,728(0.00%)#4,170 |
| 96. | Stratford Downtown | 508 | 572,842(0.09%)#96 | 16,316,728(0.00%)#4,172 |
| 97. | Clinton | 497 | 572,842(0.09%)#97 | 16,316,728(0.00%)#4,225 |
| 98. | Essex Village | 495 | 572,842(0.09%)#98 | 16,316,728(0.00%)#4,237 |
| 99. | Old Saybrook Center | 490 | 572,842(0.09%)#99 | 16,316,728(0.00%)#4,270 |
| 100. | Higganum | 472 | 572,842(0.08%)#100 | 16,316,728(0.00%)#4,370 |
Common Questions
What are the Top 10 Cities with the Largest Italian Community in Connecticut?
Top 10 Cities with the Largest Italian Community in Connecticut are:
#1
15,537
#2
12,800
#3
12,797
#4
11,855
#5
11,776
#6
11,673
#7
11,250
#8
10,177
#9
9,948
#10
9,656
What city has the Largest Italian Community in Connecticut?
Stamford has the Largest Italian Community in Connecticut with 15,537.
What is the Total Italian Population in the State of Connecticut?
Total Italian Population in Connecticut is 572,842.
What is the Total Italian Population in the United States?
Total Italian Population in the United States is 16,316,728.