Cities with the Largest Hungarian Community in New York
RELATED REPORTS & OPTIONS
Hungarian
New York
Compare Cities
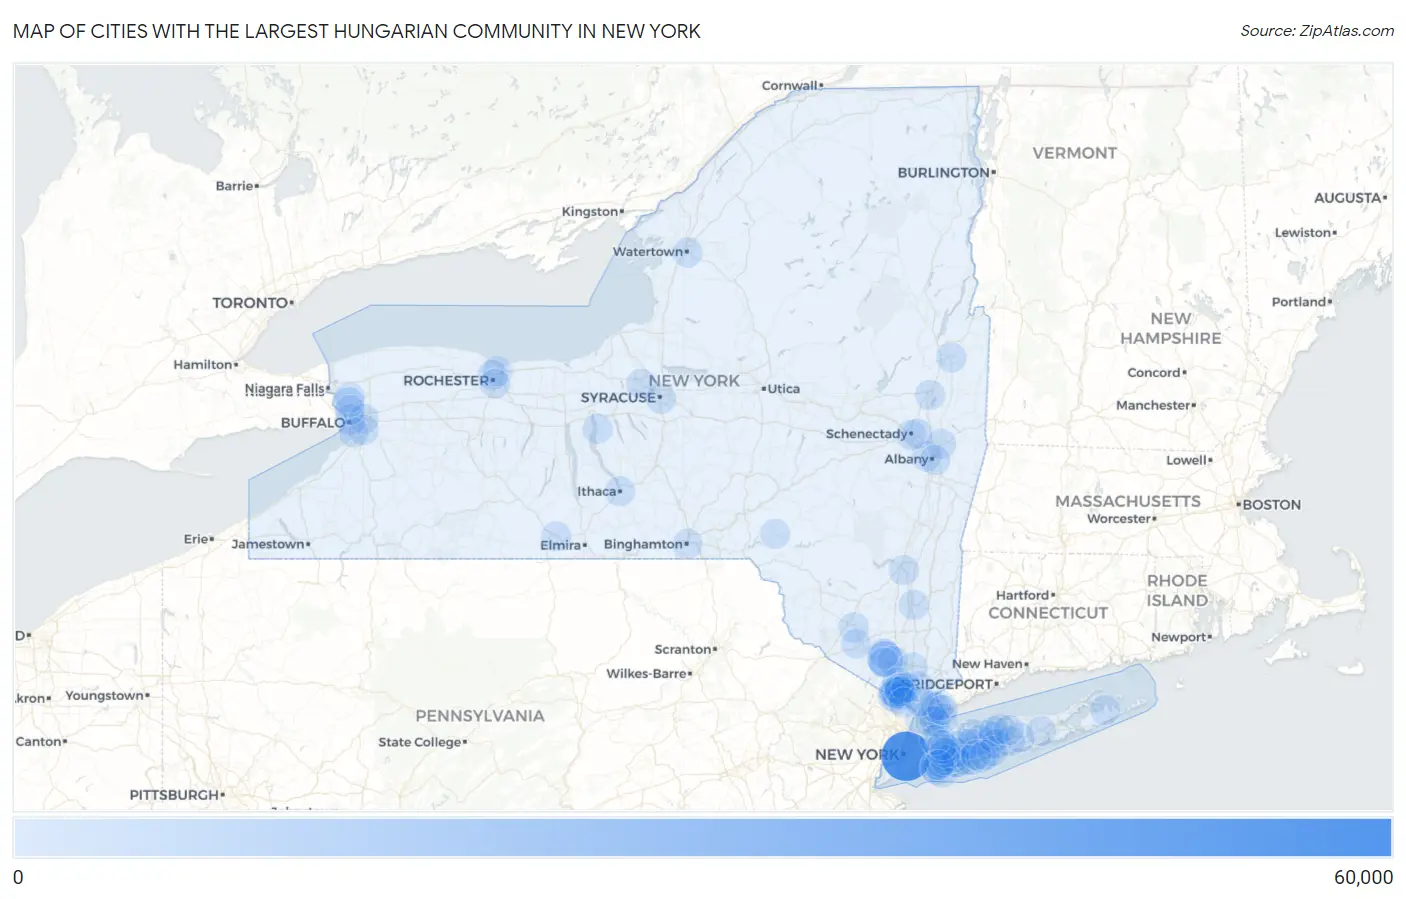
Map of Cities with the Largest Hungarian Community in New York
0
60,000
Cities with the Largest Hungarian Community in New York
| City | Hungarian | vs State | vs National | |
| 1. | New York | 52,560 | 147,442(35.65%)#1 | 1,294,135(4.06%)#1 |
| 2. | Kiryas Joel | 14,026 | 147,442(9.51%)#2 | 1,294,135(1.08%)#3 |
| 3. | Monsey | 6,038 | 147,442(4.10%)#3 | 1,294,135(0.47%)#6 |
| 4. | New Square | 3,731 | 147,442(2.53%)#4 | 1,294,135(0.29%)#12 |
| 5. | Spring Valley | 2,542 | 147,442(1.72%)#5 | 1,294,135(0.20%)#24 |
| 6. | Viola | 1,664 | 147,442(1.13%)#6 | 1,294,135(0.13%)#41 |
| 7. | Kaser | 1,392 | 147,442(0.94%)#7 | 1,294,135(0.11%)#56 |
| 8. | Buffalo | 1,264 | 147,442(0.86%)#8 | 1,294,135(0.10%)#65 |
| 9. | South Blooming Grove | 1,233 | 147,442(0.84%)#9 | 1,294,135(0.10%)#69 |
| 10. | Lawrence | 1,019 | 147,442(0.69%)#10 | 1,294,135(0.08%)#94 |
| 11. | Cedarhurst | 633 | 147,442(0.43%)#11 | 1,294,135(0.05%)#186 |
| 12. | Tonawanda | 563 | 147,442(0.38%)#12 | 1,294,135(0.04%)#226 |
| 13. | Yonkers | 503 | 147,442(0.34%)#13 | 1,294,135(0.04%)#271 |
| 14. | Chestnut Ridge | 493 | 147,442(0.33%)#14 | 1,294,135(0.04%)#282 |
| 15. | Airmont | 440 | 147,442(0.30%)#15 | 1,294,135(0.03%)#327 |
| 16. | Ithaca | 439 | 147,442(0.30%)#16 | 1,294,135(0.03%)#328 |
| 17. | North Tonawanda | 434 | 147,442(0.29%)#17 | 1,294,135(0.03%)#333 |
| 18. | Woodmere | 433 | 147,442(0.29%)#18 | 1,294,135(0.03%)#334 |
| 19. | West Seneca | 423 | 147,442(0.29%)#19 | 1,294,135(0.03%)#344 |
| 20. | Cheektowaga | 401 | 147,442(0.27%)#20 | 1,294,135(0.03%)#370 |
| 21. | Bloomingburg | 395 | 147,442(0.27%)#21 | 1,294,135(0.03%)#379 |
| 22. | Albany | 361 | 147,442(0.24%)#22 | 1,294,135(0.03%)#437 |
| 23. | Woodbury | 361 | 147,442(0.24%)#23 | 1,294,135(0.03%)#439 |
| 24. | Brentwood | 347 | 147,442(0.24%)#24 | 1,294,135(0.03%)#462 |
| 25. | Schenectady | 339 | 147,442(0.23%)#25 | 1,294,135(0.03%)#472 |
| 26. | Rochester | 336 | 147,442(0.23%)#26 | 1,294,135(0.03%)#480 |
| 27. | West Hempstead | 327 | 147,442(0.22%)#27 | 1,294,135(0.03%)#502 |
| 28. | Long Beach | 321 | 147,442(0.22%)#28 | 1,294,135(0.02%)#519 |
| 29. | Levittown | 315 | 147,442(0.21%)#29 | 1,294,135(0.02%)#534 |
| 30. | Nanuet | 305 | 147,442(0.21%)#30 | 1,294,135(0.02%)#558 |
| 31. | Syracuse | 300 | 147,442(0.20%)#31 | 1,294,135(0.02%)#568 |
| 32. | Kingston | 294 | 147,442(0.20%)#32 | 1,294,135(0.02%)#581 |
| 33. | Scarsdale | 294 | 147,442(0.20%)#33 | 1,294,135(0.02%)#582 |
| 34. | Hicksville | 293 | 147,442(0.20%)#34 | 1,294,135(0.02%)#588 |
| 35. | Merrick | 275 | 147,442(0.19%)#35 | 1,294,135(0.02%)#643 |
| 36. | White Plains | 270 | 147,442(0.18%)#36 | 1,294,135(0.02%)#657 |
| 37. | Port Washington | 269 | 147,442(0.18%)#37 | 1,294,135(0.02%)#662 |
| 38. | New Rochelle | 263 | 147,442(0.18%)#38 | 1,294,135(0.02%)#681 |
| 39. | Commack | 258 | 147,442(0.17%)#39 | 1,294,135(0.02%)#701 |
| 40. | Ossining | 252 | 147,442(0.17%)#40 | 1,294,135(0.02%)#723 |
| 41. | Peekskill | 251 | 147,442(0.17%)#41 | 1,294,135(0.02%)#726 |
| 42. | Dix Hills | 249 | 147,442(0.17%)#42 | 1,294,135(0.02%)#735 |
| 43. | Irondequoit | 241 | 147,442(0.16%)#43 | 1,294,135(0.02%)#766 |
| 44. | North Merrick | 240 | 147,442(0.16%)#44 | 1,294,135(0.02%)#769 |
| 45. | Pomona | 230 | 147,442(0.16%)#45 | 1,294,135(0.02%)#808 |
| 46. | Bellmore | 228 | 147,442(0.15%)#46 | 1,294,135(0.02%)#822 |
| 47. | Rye | 220 | 147,442(0.15%)#47 | 1,294,135(0.02%)#860 |
| 48. | Niskayuna | 218 | 147,442(0.15%)#48 | 1,294,135(0.02%)#869 |
| 49. | Poughkeepsie | 217 | 147,442(0.15%)#49 | 1,294,135(0.02%)#872 |
| 50. | Brighton | 213 | 147,442(0.14%)#50 | 1,294,135(0.02%)#891 |
| 51. | Plainview | 213 | 147,442(0.14%)#51 | 1,294,135(0.02%)#893 |
| 52. | Watertown | 207 | 147,442(0.14%)#52 | 1,294,135(0.02%)#921 |
| 53. | Huntington Station | 203 | 147,442(0.14%)#53 | 1,294,135(0.02%)#937 |
| 54. | Massapequa | 196 | 147,442(0.13%)#54 | 1,294,135(0.02%)#979 |
| 55. | New Hempstead | 190 | 147,442(0.13%)#55 | 1,294,135(0.01%)#1,021 |
| 56. | Lynbrook | 185 | 147,442(0.13%)#56 | 1,294,135(0.01%)#1,050 |
| 57. | Binghamton | 184 | 147,442(0.12%)#57 | 1,294,135(0.01%)#1,055 |
| 58. | Northwest Harbor | 184 | 147,442(0.12%)#58 | 1,294,135(0.01%)#1,057 |
| 59. | North New Hyde Park | 180 | 147,442(0.12%)#59 | 1,294,135(0.01%)#1,083 |
| 60. | East Meadow | 178 | 147,442(0.12%)#60 | 1,294,135(0.01%)#1,088 |
| 61. | Mineola | 173 | 147,442(0.12%)#61 | 1,294,135(0.01%)#1,127 |
| 62. | Walton | 172 | 147,442(0.12%)#62 | 1,294,135(0.01%)#1,144 |
| 63. | Rockville Centre | 170 | 147,442(0.12%)#63 | 1,294,135(0.01%)#1,154 |
| 64. | Hillcrest | 170 | 147,442(0.12%)#64 | 1,294,135(0.01%)#1,156 |
| 65. | Harrison | 168 | 147,442(0.11%)#65 | 1,294,135(0.01%)#1,173 |
| 66. | Saratoga Springs | 165 | 147,442(0.11%)#66 | 1,294,135(0.01%)#1,199 |
| 67. | Corning | 159 | 147,442(0.11%)#67 | 1,294,135(0.01%)#1,250 |
| 68. | Holbrook | 157 | 147,442(0.11%)#68 | 1,294,135(0.01%)#1,262 |
| 69. | Union Springs | 157 | 147,442(0.11%)#69 | 1,294,135(0.01%)#1,267 |
| 70. | Melville | 156 | 147,442(0.11%)#70 | 1,294,135(0.01%)#1,276 |
| 71. | Rye Brook | 156 | 147,442(0.11%)#71 | 1,294,135(0.01%)#1,278 |
| 72. | Hauppauge | 152 | 147,442(0.10%)#72 | 1,294,135(0.01%)#1,313 |
| 73. | Amityville | 151 | 147,442(0.10%)#73 | 1,294,135(0.01%)#1,320 |
| 74. | Mamaroneck | 147 | 147,442(0.10%)#74 | 1,294,135(0.01%)#1,356 |
| 75. | Hudson Falls | 146 | 147,442(0.10%)#75 | 1,294,135(0.01%)#1,369 |
| 76. | Troy | 143 | 147,442(0.10%)#76 | 1,294,135(0.01%)#1,393 |
| 77. | Babylon | 140 | 147,442(0.09%)#77 | 1,294,135(0.01%)#1,419 |
| 78. | Great Neck | 140 | 147,442(0.09%)#78 | 1,294,135(0.01%)#1,420 |
| 79. | Monroe | 140 | 147,442(0.09%)#79 | 1,294,135(0.01%)#1,421 |
| 80. | Smithtown | 139 | 147,442(0.09%)#80 | 1,294,135(0.01%)#1,427 |
| 81. | Rensselaer | 139 | 147,442(0.09%)#81 | 1,294,135(0.01%)#1,430 |
| 82. | Village Green | 139 | 147,442(0.09%)#82 | 1,294,135(0.01%)#1,432 |
| 83. | Middletown | 138 | 147,442(0.09%)#83 | 1,294,135(0.01%)#1,436 |
| 84. | New City | 137 | 147,442(0.09%)#84 | 1,294,135(0.01%)#1,444 |
| 85. | Garden City | 137 | 147,442(0.09%)#85 | 1,294,135(0.01%)#1,447 |
| 86. | Manorville | 136 | 147,442(0.09%)#86 | 1,294,135(0.01%)#1,461 |
| 87. | Lackawanna | 135 | 147,442(0.09%)#87 | 1,294,135(0.01%)#1,471 |
| 88. | Searingtown | 133 | 147,442(0.09%)#88 | 1,294,135(0.01%)#1,493 |
| 89. | Central Islip | 132 | 147,442(0.09%)#89 | 1,294,135(0.01%)#1,495 |
| 90. | Tarrytown | 129 | 147,442(0.09%)#90 | 1,294,135(0.01%)#1,528 |
| 91. | West Islip | 124 | 147,442(0.08%)#91 | 1,294,135(0.01%)#1,585 |
| 92. | Islip | 124 | 147,442(0.08%)#92 | 1,294,135(0.01%)#1,587 |
| 93. | Hewlett | 123 | 147,442(0.08%)#93 | 1,294,135(0.01%)#1,606 |
| 94. | West Babylon | 122 | 147,442(0.08%)#94 | 1,294,135(0.01%)#1,612 |
| 95. | Medford | 122 | 147,442(0.08%)#95 | 1,294,135(0.01%)#1,616 |
| 96. | St James | 122 | 147,442(0.08%)#96 | 1,294,135(0.01%)#1,622 |
| 97. | Port Chester | 120 | 147,442(0.08%)#97 | 1,294,135(0.01%)#1,640 |
| 98. | Pearl River | 120 | 147,442(0.08%)#98 | 1,294,135(0.01%)#1,643 |
| 99. | Kenmore | 120 | 147,442(0.08%)#99 | 1,294,135(0.01%)#1,645 |
| 100. | Centereach | 119 | 147,442(0.08%)#100 | 1,294,135(0.01%)#1,660 |
Common Questions
What are the Top 10 Cities with the Largest Hungarian Community in New York?
Top 10 Cities with the Largest Hungarian Community in New York are:
#1
52,560
#2
14,026
#3
6,038
#4
3,731
#5
2,542
#6
1,664
#7
1,392
#8
1,264
#9
1,233
#10
1,019
What city has the Largest Hungarian Community in New York?
New York has the Largest Hungarian Community in New York with 52,560.
What is the Total Hungarian Population in the State of New York?
Total Hungarian Population in New York is 147,442.
What is the Total Hungarian Population in the United States?
Total Hungarian Population in the United States is 1,294,135.