Cities with the Largest Hungarian Community in Maine

RELATED REPORTS & OPTIONS

Hungarian
Population
Families and Households
Female Fertility
Female Fertility (Unmarried)
Race (Community Size)
Race (Percentage)
Ancestry (Community Size)
AfghanAfricanAlaska NativeAlaskan AthabascanAlbanianAleutAlsatianAmericanApacheArabArapahoArgentineanArmenianAssyrian / Chaldean / SyriacAustralianAustrianBahamianBangladeshiBarbadianBasqueBelgianBelizeanBermudanBhutaneseBlackfeetBolivianBrazilianBritishBritish West IndianBulgarianBurmeseCajunCambodianCanadianCape VerdeanCarpatho RusynCelticCentral AmericanCentral American IndianCherokeeCheyenneChickasawChileanChineseChippewaChoctawColombianColvilleComancheCosta RicanCreeCreekCroatianCrowCubanCypriotCzechCzechoslovakianDanishDelawareDominicanDutchDutch West IndianEastern EuropeanEcuadorianEgyptianEnglishEstonianEthiopianEuropeanFijianFilipinoFinnishFrenchFrench American IndianFrench CanadianGermanGerman RussianGhanaianGreekGuamanian / ChamorroGuatemalanGuyaneseHaitianHmongHonduranHopiHoumaHungarianIcelanderIndian (Asian)IndonesianInupiatIranianIraqiIrishIroquoisIsraeliItalianJamaicanJapaneseJordanianKenyanKiowaKoreanLaotianLatvianLebaneseLiberianLithuanianLumbeeLuxembourgerMacedonianMalaysianMalteseMarshalleseMenomineeMexicanMexican American IndianMongolianMoroccanNative HawaiianNavajoNepaleseNew ZealanderNicaraguanNigerianNorthern EuropeanNorwegianOkinawanOsageOttawaPaiutePakistaniPalestinianPanamanianParaguayanPennsylvania GermanPeruvianPimaPolishPortuguesePotawatomiPuebloPuerto RicanPuget Sound SalishRomanianRussianSalvadoranSamoanScandinavianScotch-IrishScottishSeminoleSenegaleseSerbianShoshoneSierra LeoneanSiouxSlavicSlovakSloveneSomaliSouth AfricanSouth AmericanSouth American IndianSoviet UnionSpaniardSpanishSpanish AmericanSpanish American IndianSri LankanSubsaharan AfricanSudaneseSwedishSwissSyrianTaiwaneseThaiTlingit-HaidaTohono O'OdhamTonganTrinidadian and TobagonianTsimshianTurkishU.S. Virgin IslanderUgandanUkrainianUruguayanUteVenezuelanVietnameseWelshWest IndianYakamaYaquiYugoslavianYumanYup'ikZimbabwean
Ancestry (Percentage)
AfghanAfricanAlaska NativeAlaskan AthabascanAlbanianAleutAlsatianAmericanApacheArabArapahoArgentineanArmenianAssyrian / Chaldean / SyriacAustralianAustrianBahamianBangladeshiBarbadianBasqueBelgianBelizeanBermudanBhutaneseBlackfeetBolivianBrazilianBritishBritish West IndianBulgarianBurmeseCajunCambodianCanadianCape VerdeanCarpatho RusynCelticCentral AmericanCentral American IndianCherokeeCheyenneChickasawChileanChineseChippewaChoctawColombianColvilleComancheCosta RicanCreeCreekCroatianCrowCubanCypriotCzechCzechoslovakianDanishDelawareDominicanDutchDutch West IndianEastern EuropeanEcuadorianEgyptianEnglishEstonianEthiopianEuropeanFijianFilipinoFinnishFrenchFrench American IndianFrench CanadianGermanGerman RussianGhanaianGreekGuamanian / ChamorroGuatemalanGuyaneseHaitianHmongHonduranHopiHoumaHungarianIcelanderIndian (Asian)IndonesianInupiatIranianIraqiIrishIroquoisIsraeliItalianJamaicanJapaneseJordanianKenyanKiowaKoreanLaotianLatvianLebaneseLiberianLithuanianLumbeeLuxembourgerMacedonianMalaysianMalteseMarshalleseMenomineeMexicanMexican American IndianMongolianMoroccanNative HawaiianNavajoNepaleseNew ZealanderNicaraguanNigerianNorthern EuropeanNorwegianOkinawanOsageOttawaPaiutePakistaniPalestinianPanamanianParaguayanPennsylvania GermanPeruvianPimaPolishPortuguesePotawatomiPuebloPuerto RicanPuget Sound SalishRomanianRussianSalvadoranSamoanScandinavianScotch-IrishScottishSeminoleSenegaleseSerbianShoshoneSierra LeoneanSiouxSlavicSlovakSloveneSomaliSouth AfricanSouth AmericanSouth American IndianSoviet UnionSpaniardSpanishSpanish AmericanSpanish American IndianSri LankanSubsaharan AfricanSudaneseSwedishSwissSyrianTaiwaneseThaiTlingit-HaidaTohono O'OdhamTonganTrinidadian and TobagonianTsimshianTurkishU.S. Virgin IslanderUgandanUkrainianUruguayanUteVenezuelanVietnameseWelshWest IndianYakamaYaquiYugoslavianYumanYup'ikZimbabwean
Immigrant Origin (Total)
AfghanistanAfricaAlbaniaArgentinaArmeniaAsiaAustraliaAustriaAzoresBahamasBangladeshBarbadosBelarusBelgiumBelizeBoliviaBosnia and HerzegovinaBrazilBulgariaBurma / MyanmarCabo VerdeCambodiaCameroonCanadaCaribbeanCentral AmericaChileChinaColombiaCongoCosta RicaCroatiaCubaCzechoslovakiaDenmarkDominicaDominican RepublicEastern AfricaEastern AsiaEastern EuropeEcuadorEgyptEl SalvadorEnglandEritreaEthiopiaEuropeFijiFranceGermanyGhanaGreeceGrenadaGuatemalaGuyanaHaitiHondurasHong KongHungaryIndiaIndonesiaIranIraqIrelandIsraelItalyJamaicaJapanJordanKazakhstanKenyaKoreaKuwaitLaosLatin AmericaLatviaLebanonLiberiaLithuaniaMalaysiaMexicoMicronesiaMiddle AfricaMoldovaMoroccoNepalNetherlandsNicaraguaNigeriaNorth MacedoniaNorthern AfricaNorthern EuropeNorwayOceaniaPakistanPanamaPeruPhilippinesPolandPortugalRomaniaRussiaSaudi ArabiaScotlandSenegalSerbiaSierra LeoneSingaporeSomaliaSouth AfricaSouth AmericaSouth Central AsiaSouth Eastern AsiaSouthern EuropeSpainSri LankaSt. Vincent and the GrenadinesSudanSwedenSwitzerlandSyriaTaiwanThailandTrinidad and TobagoTurkeyUgandaUkraineUruguayUzbekistanVenezuelaVietnamWest IndiesWestern AfricaWestern AsiaWestern EuropeYemenZaireZimbabwe
Immigrant Origin (Percentage)
AfghanistanAfricaAlbaniaArgentinaArmeniaAsiaAustraliaAustriaAzoresBahamasBangladeshBarbadosBelarusBelgiumBelizeBoliviaBosnia and HerzegovinaBrazilBulgariaBurma / MyanmarCabo VerdeCambodiaCameroonCanadaCaribbeanCentral AmericaChileChinaColombiaCongoCosta RicaCroatiaCubaCzechoslovakiaDenmarkDominicaDominican RepublicEastern AfricaEastern AsiaEastern EuropeEcuadorEgyptEl SalvadorEnglandEritreaEthiopiaEuropeFijiFranceGermanyGhanaGreeceGrenadaGuatemalaGuyanaHaitiHondurasHong KongHungaryIndiaIndonesiaIranIraqIrelandIsraelItalyJamaicaJapanJordanKazakhstanKenyaKoreaKuwaitLaosLatin AmericaLatviaLebanonLiberiaLithuaniaMalaysiaMexicoMicronesiaMiddle AfricaMoldovaMoroccoNepalNetherlandsNicaraguaNigeriaNorth MacedoniaNorthern AfricaNorthern EuropeNorwayOceaniaPakistanPanamaPeruPhilippinesPolandPortugalRomaniaRussiaSaudi ArabiaScotlandSenegalSerbiaSierra LeoneSingaporeSomaliaSouth AfricaSouth AmericaSouth Central AsiaSouth Eastern AsiaSouthern EuropeSpainSri LankaSt. Vincent and the GrenadinesSudanSwedenSwitzerlandSyriaTaiwanThailandTrinidad and TobagoTurkeyUgandaUkraineUruguayUzbekistanVenezuelaVietnamWest IndiesWestern AfricaWestern AsiaWestern EuropeYemenZaireZimbabwe
Income
Income (Families)
Income (Households)
Poverty
Poverty (Families)
Unemployment
Employment Occupations
Employment Industries
Employer Class
Commute Time
Commute Means
School Enrollment
Education by Degree Field
Occupancy
Finances
Physical Characteristics
Maine
Compare Cities
Comparison Subject

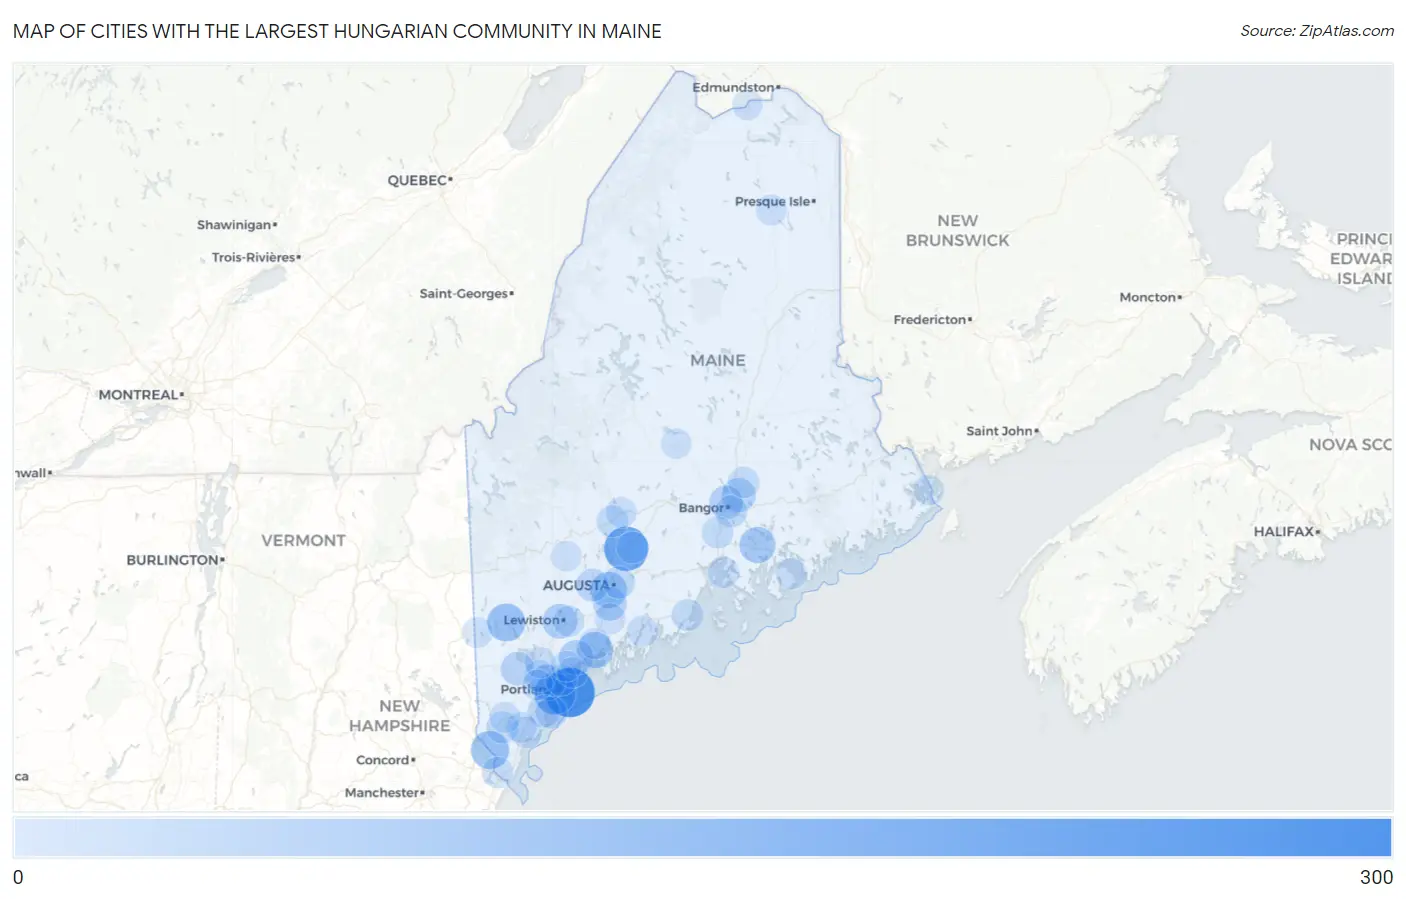
Map of Cities with the Largest Hungarian Community in Maine

0
300
Cities with the Largest Hungarian Community in Maine Map

Cities with the Largest Hungarian Community in Maine

City Hungarian vs State vs National
1.Portland2703,912(6.90%)#11,294,135(0.02%)#656
2.Waterville1943,912(4.96%)#21,294,135(0.01%)#995
3.South Portland1563,912(3.99%)#31,294,135(0.01%)#1,273
4.Berwick1083,912(2.76%)#41,294,135(0.01%)#1,849
5.Bridgton1053,912(2.68%)#51,294,135(0.01%)#1,896
6.Brunswick843,912(2.15%)#61,294,135(0.01%)#2,279
7.Hallowell833,912(2.12%)#71,294,135(0.01%)#2,310
8.Ellsworth813,912(2.07%)#81,294,135(0.01%)#2,351
9.Westbrook743,912(1.89%)#91,294,135(0.01%)#2,510
10.Auburn643,912(1.64%)#101,294,135(0.00%)#2,790
11.Freeport633,912(1.61%)#111,294,135(0.00%)#2,846
12.Orono533,912(1.35%)#121,294,135(0.00%)#3,185
13.Bangor503,912(1.28%)#131,294,135(0.00%)#3,286
14.Gardiner493,912(1.25%)#141,294,135(0.00%)#3,359
15.Steep Falls443,912(1.12%)#151,294,135(0.00%)#3,596
16.Winthrop373,912(0.95%)#161,294,135(0.00%)#3,972
17.Saco303,912(0.77%)#171,294,135(0.00%)#4,414
18.Augusta273,912(0.69%)#181,294,135(0.00%)#4,646
19.Brewer253,912(0.64%)#191,294,135(0.00%)#4,818
20.Old Orchard Beach253,912(0.64%)#201,294,135(0.00%)#4,820
21.Sanford243,912(0.61%)#211,294,135(0.00%)#4,899
22.Rockland243,912(0.61%)#221,294,135(0.00%)#4,928
23.Winslow243,912(0.61%)#231,294,135(0.00%)#4,940
24.Winterport213,912(0.54%)#241,294,135(0.00%)#5,289
25.Norridgewock213,912(0.54%)#251,294,135(0.00%)#5,290
26.South Windham193,912(0.49%)#261,294,135(0.00%)#5,545
27.Milford173,912(0.43%)#271,294,135(0.00%)#5,802
28.Falmouth173,912(0.43%)#281,294,135(0.00%)#5,813
29.South Eliot163,912(0.41%)#291,294,135(0.00%)#5,916
30.Kennebunk153,912(0.38%)#301,294,135(0.00%)#6,070
31.Damariscotta153,912(0.38%)#311,294,135(0.00%)#6,137
32.North Windham143,912(0.36%)#321,294,135(0.00%)#6,232
33.West Kennebunk143,912(0.36%)#331,294,135(0.00%)#6,302
34.Lewiston133,912(0.33%)#341,294,135(0.00%)#6,349
35.Topsham123,912(0.31%)#351,294,135(0.00%)#6,568
36.Bar Harbor123,912(0.31%)#361,294,135(0.00%)#6,626
37.Alfred123,912(0.31%)#371,294,135(0.00%)#6,673
38.Skowhegan113,912(0.28%)#381,294,135(0.00%)#6,778
39.Richmond103,912(0.26%)#391,294,135(0.00%)#7,096
40.Castine103,912(0.26%)#401,294,135(0.00%)#7,152
41.Ashland93,912(0.23%)#411,294,135(0.00%)#7,423
42.Kingfield93,912(0.23%)#421,294,135(0.00%)#7,430
43.Gorham83,912(0.20%)#431,294,135(0.00%)#7,516
44.Yarmouth83,912(0.20%)#441,294,135(0.00%)#7,524
45.Cousins Island73,912(0.18%)#451,294,135(0.00%)#8,012
46.Dover Foxcroft63,912(0.15%)#461,294,135(0.00%)#8,125
47.Fort Kent63,912(0.15%)#471,294,135(0.00%)#8,146
48.Fryeburg63,912(0.15%)#481,294,135(0.00%)#8,200
49.Eastport63,912(0.15%)#491,294,135(0.00%)#8,223
50.Chisholm53,912(0.13%)#501,294,135(0.00%)#8,547

Common Questions

What are the Top 10 Cities with the Largest Hungarian Community in Maine?
Top 10 Cities with the Largest Hungarian Community in Maine are:
What city has the Largest Hungarian Community in Maine?
Portland has the Largest Hungarian Community in Maine with 270.
What is the Total Hungarian Population in the State of Maine?
Total Hungarian Population in Maine is 3,912.
What is the Total Hungarian Population in the United States?
Total Hungarian Population in the United States is 1,294,135.