Cities with the Lowest Births per 1,000 Women in Labor Force in New Hampshire
RELATED REPORTS & OPTIONS
Lowest Birth Rate | In Labor Force
New Hampshire
Compare Cities
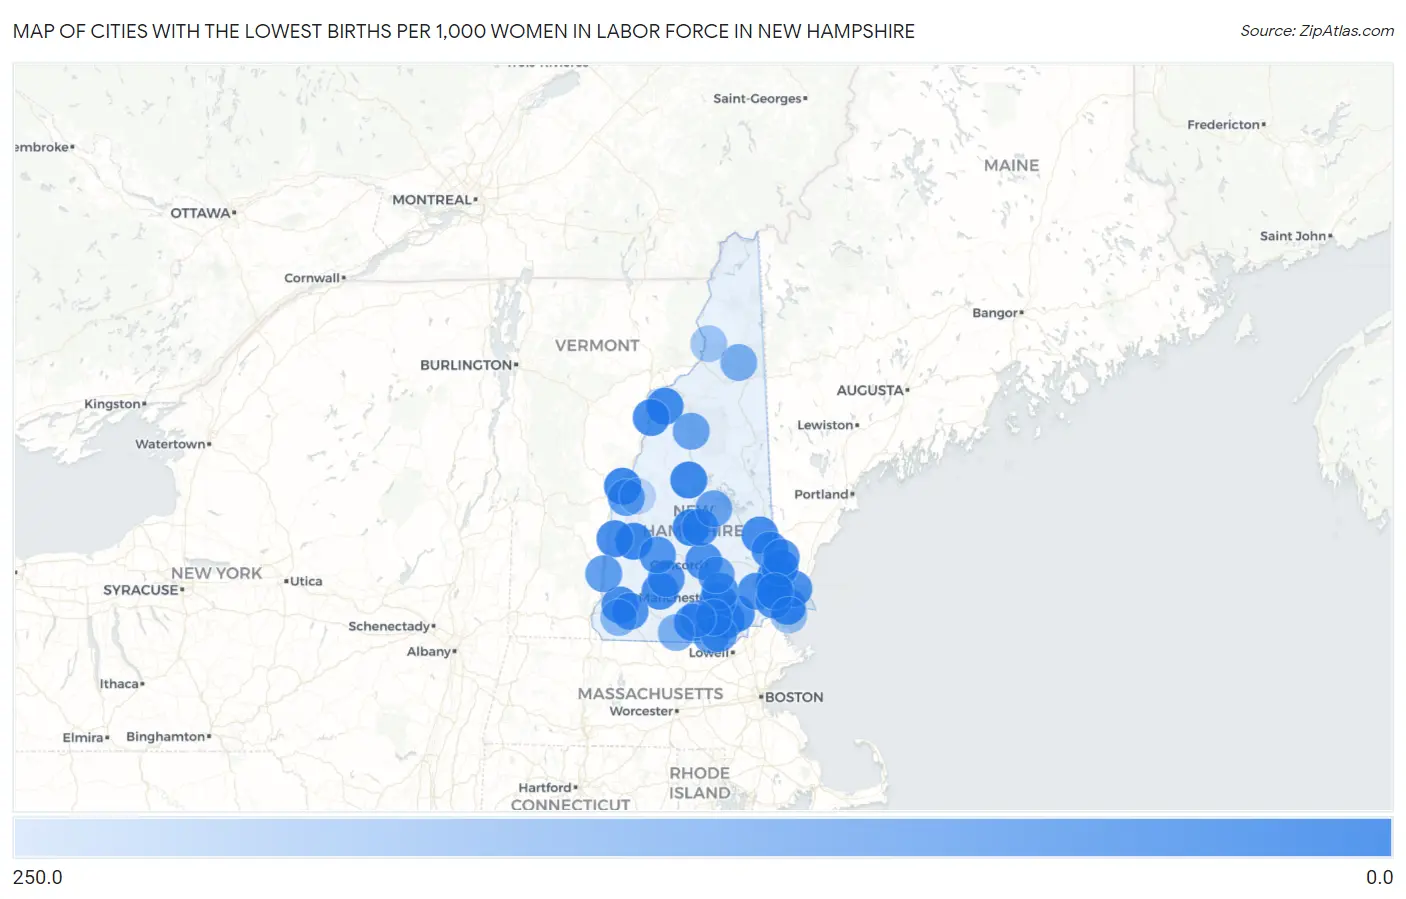
Map of Cities with the Lowest Births per 1,000 Women in Labor Force in New Hampshire
250.0
0.0
Cities with the Lowest Births per 1,000 Women in Labor Force in New Hampshire
| City | Births / 1,000 Women | vs State | vs National | |
| 1. | Durham | 5.0 | 44.0(-39.0)#1 | 48.0(-43.0)#65 |
| 2. | Newport | 11.0 | 44.0(-33.0)#2 | 48.0(-37.0)#524 |
| 3. | Franklin | 14.0 | 44.0(-30.0)#3 | 48.0(-34.0)#871 |
| 4. | Hanover | 14.0 | 44.0(-30.0)#4 | 48.0(-34.0)#876 |
| 5. | Plymouth | 16.0 | 44.0(-28.0)#5 | 48.0(-32.0)#1,177 |
| 6. | Hampton | 20.0 | 44.0(-24.0)#6 | 48.0(-28.0)#1,819 |
| 7. | Milford | 20.0 | 44.0(-24.0)#7 | 48.0(-28.0)#1,826 |
| 8. | Lisbon | 21.0 | 44.0(-23.0)#8 | 48.0(-27.0)#2,107 |
| 9. | Londonderry | 25.0 | 44.0(-19.0)#9 | 48.0(-23.0)#2,773 |
| 10. | Woodsville | 26.0 | 44.0(-18.0)#10 | 48.0(-22.0)#3,065 |
| 11. | Derry | 29.0 | 44.0(-15.0)#11 | 48.0(-19.0)#3,519 |
| 12. | Antrim | 29.0 | 44.0(-15.0)#12 | 48.0(-19.0)#3,642 |
| 13. | Claremont | 30.0 | 44.0(-14.0)#13 | 48.0(-18.0)#3,762 |
| 14. | Keene | 32.0 | 44.0(-12.0)#14 | 48.0(-16.0)#4,139 |
| 15. | Farmington | 32.0 | 44.0(-12.0)#15 | 48.0(-16.0)#4,197 |
| 16. | Manchester | 38.0 | 44.0(-6.00)#16 | 48.0(-10.00)#5,377 |
| 17. | Portsmouth | 38.0 | 44.0(-6.00)#17 | 48.0(-10.00)#5,422 |
| 18. | Newmarket | 38.0 | 44.0(-6.00)#18 | 48.0(-10.00)#5,491 |
| 19. | Concord | 41.0 | 44.0(-3.00)#19 | 48.0(-7.00)#6,093 |
| 20. | Epping | 41.0 | 44.0(-3.00)#20 | 48.0(-7.00)#6,186 |
| 21. | Rochester | 42.0 | 44.0(-2.00)#21 | 48.0(-6.00)#6,320 |
| 22. | Exeter | 46.0 | 44.0(+2.00)#22 | 48.0(-2.00)#7,241 |
| 23. | Hillsborough | 48.0 | 44.0(+4.00)#23 | 48.0(=0.000)#7,709 |
| 24. | Marlborough | 48.0 | 44.0(+4.00)#24 | 48.0(=0.000)#7,726 |
| 25. | Dover | 49.0 | 44.0(+5.00)#25 | 48.0(+1.000)#7,814 |
| 26. | South Hooksett | 49.0 | 44.0(+5.00)#26 | 48.0(+1.000)#7,899 |
| 27. | Tilton Northfield | 49.0 | 44.0(+5.00)#27 | 48.0(+1.000)#7,929 |
| 28. | Bradford | 54.0 | 44.0(+10.00)#28 | 48.0(+6.00)#8,982 |
| 29. | Somersworth | 55.0 | 44.0(+11.0)#29 | 48.0(+7.00)#9,049 |
| 30. | Newfields | 67.0 | 44.0(+23.0)#30 | 48.0(+19.0)#11,079 |
| 31. | Nashua | 70.0 | 44.0(+26.0)#31 | 48.0(+22.0)#11,367 |
| 32. | Hudson | 71.0 | 44.0(+27.0)#32 | 48.0(+23.0)#11,525 |
| 33. | North Walpole | 72.0 | 44.0(+28.0)#33 | 48.0(+24.0)#11,712 |
| 34. | Lebanon | 73.0 | 44.0(+29.0)#34 | 48.0(+25.0)#11,736 |
| 35. | Suncook | 82.0 | 44.0(+38.0)#35 | 48.0(+34.0)#12,682 |
| 36. | Laconia | 92.0 | 44.0(+48.0)#36 | 48.0(+44.0)#13,536 |
| 37. | Lincoln | 93.0 | 44.0(+49.0)#37 | 48.0(+45.0)#13,649 |
| 38. | East Merrimack | 109.0 | 44.0(+65.0)#38 | 48.0(+61.0)#14,638 |
| 39. | Amherst | 122.0 | 44.0(+78.0)#39 | 48.0(+74.0)#15,238 |
| 40. | Berlin | 126.0 | 44.0(+82.0)#40 | 48.0(+78.0)#15,389 |
| 41. | Greenville | 130.0 | 44.0(+86.0)#41 | 48.0(+82.0)#15,536 |
| 42. | West Swanzey | 144.0 | 44.0(+100.0)#42 | 48.0(+96.0)#15,978 |
| 43. | Seabrook Beach | 168.0 | 44.0(+124)#43 | 48.0(+120)#16,531 |
| 44. | Groveton | 186.0 | 44.0(+142)#44 | 48.0(+138)#16,804 |
| 45. | Enfield | 231.0 | 44.0(+187)#45 | 48.0(+183)#17,272 |
1
Common Questions
What are the Top 10 Cities with the Lowest Births per 1,000 Women in Labor Force in New Hampshire?
Top 10 Cities with the Lowest Births per 1,000 Women in Labor Force in New Hampshire are:
#1
0.0
#2
0.0
#3
0.0
#4
0.0
#5
0.0
#6
0.0
#7
0.0
#8
0.0
#9
0.0
#10
0.0
What city has the Lowest Births per 1,000 Women in Labor Force in New Hampshire?
Durham has the Lowest Births per 1,000 Women in Labor Force in New Hampshire with 5.0.
What is the Number Births per 1,000 Women in Labor Force in the State of New Hampshire?
Number Births per 1,000 Women in Labor Force in New Hampshire is 44.0.
What is the Number Births per 1,000 Women in Labor Force in the United States?
Number Births per 1,000 Women in Labor Force in the United States is 48.0.