Cities with the Lowest Births per 1,000 Women in Labor Force in Ohio
RELATED REPORTS & OPTIONS
Lowest Birth Rate | In Labor Force
Ohio
Compare Cities
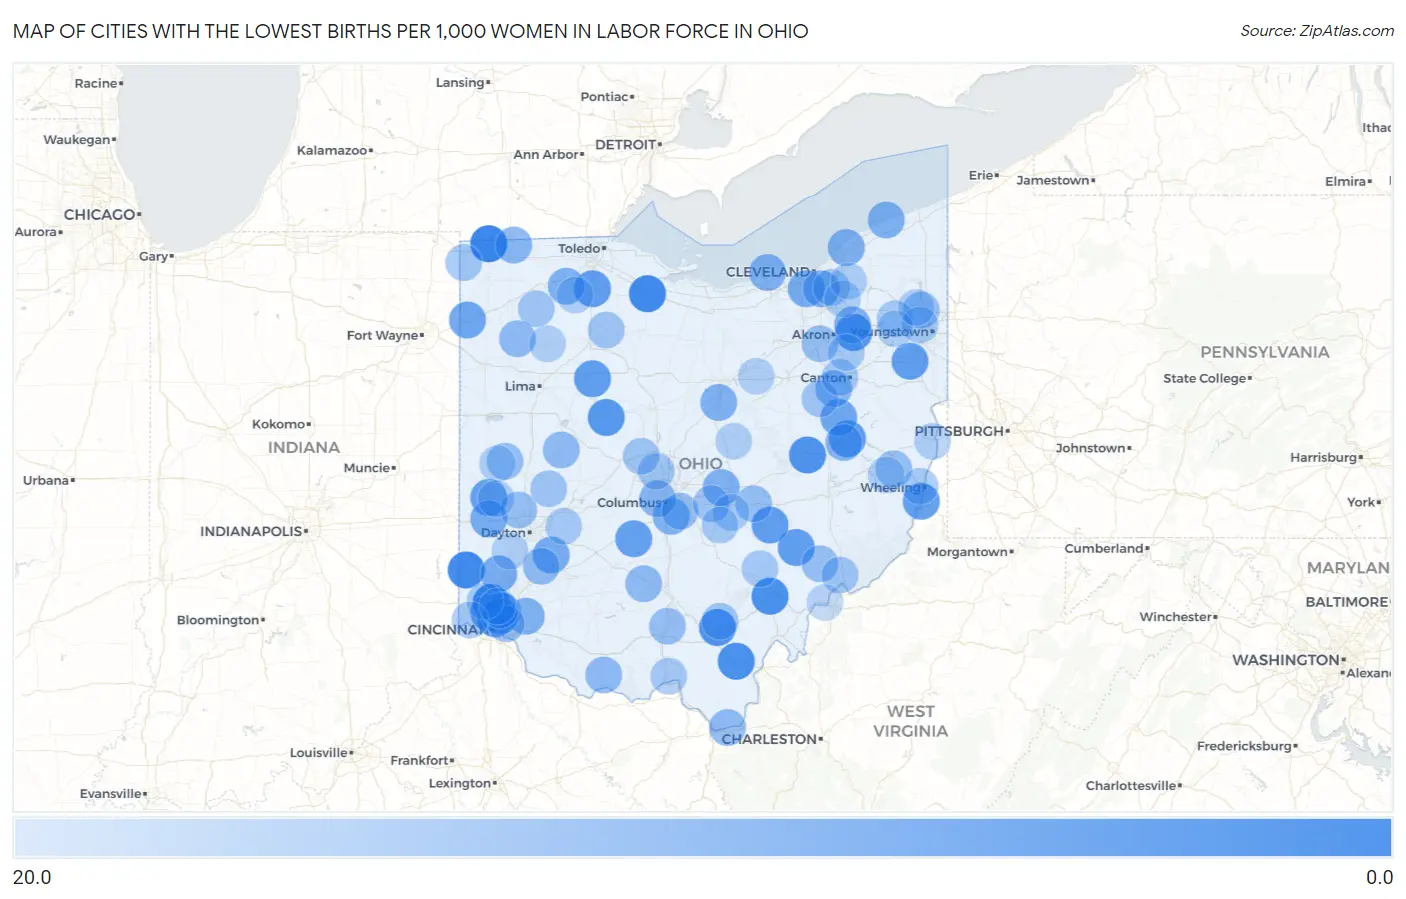
Map of Cities with the Lowest Births per 1,000 Women in Labor Force in Ohio
20.0
0.0
Cities with the Lowest Births per 1,000 Women in Labor Force in Ohio
| City | Births / 1,000 Women | vs State | vs National | |
| 1. | Forest Park | 4.0 | 51.0(-47.0)#1 | 48.0(-44.0)#33 |
| 2. | Pioneer | 4.0 | 51.0(-47.0)#2 | 48.0(-44.0)#52 |
| 3. | Oxford | 5.0 | 51.0(-46.0)#3 | 48.0(-43.0)#55 |
| 4. | Stony Prairie | 5.0 | 51.0(-46.0)#4 | 48.0(-43.0)#92 |
| 5. | Athens | 6.0 | 51.0(-45.0)#5 | 48.0(-42.0)#99 |
| 6. | Rio Grande | 6.0 | 51.0(-45.0)#6 | 48.0(-42.0)#137 |
| 7. | Wellston | 7.0 | 51.0(-44.0)#7 | 48.0(-41.0)#167 |
| 8. | West Lafayette | 7.0 | 51.0(-44.0)#8 | 48.0(-41.0)#176 |
| 9. | Brimfield | 8.0 | 51.0(-43.0)#9 | 48.0(-40.0)#243 |
| 10. | Mount Victory | 8.0 | 51.0(-43.0)#10 | 48.0(-40.0)#268 |
| 11. | Bowling Green | 9.0 | 51.0(-42.0)#11 | 48.0(-39.0)#276 |
| 12. | Salem | 9.0 | 51.0(-42.0)#12 | 48.0(-39.0)#289 |
| 13. | North College Hill | 9.0 | 51.0(-42.0)#13 | 48.0(-39.0)#295 |
| 14. | St Bernard | 9.0 | 51.0(-42.0)#14 | 48.0(-39.0)#320 |
| 15. | Shadyside | 9.0 | 51.0(-42.0)#15 | 48.0(-39.0)#326 |
| 16. | Mcconnelsville | 9.0 | 51.0(-42.0)#16 | 48.0(-39.0)#339 |
| 17. | Roseville | 9.0 | 51.0(-42.0)#17 | 48.0(-39.0)#343 |
| 18. | Tuscarawas | 9.0 | 51.0(-42.0)#18 | 48.0(-39.0)#355 |
| 19. | Dunkirk | 9.0 | 51.0(-42.0)#19 | 48.0(-39.0)#366 |
| 20. | Arcanum | 10.0 | 51.0(-41.0)#20 | 48.0(-38.0)#428 |
| 21. | Mount Sterling | 10.0 | 51.0(-41.0)#21 | 48.0(-38.0)#442 |
| 22. | Dover | 11.0 | 51.0(-40.0)#22 | 48.0(-37.0)#486 |
| 23. | Reading | 11.0 | 51.0(-40.0)#23 | 48.0(-37.0)#493 |
| 24. | Antwerp | 11.0 | 51.0(-40.0)#24 | 48.0(-37.0)#557 |
| 25. | Parma Heights | 12.0 | 51.0(-39.0)#25 | 48.0(-36.0)#599 |
| 26. | Trenton | 12.0 | 51.0(-39.0)#26 | 48.0(-36.0)#605 |
| 27. | Lewisburg | 12.0 | 51.0(-39.0)#27 | 48.0(-36.0)#673 |
| 28. | Spring Valley | 12.0 | 51.0(-39.0)#28 | 48.0(-36.0)#700 |
| 29. | Kent | 13.0 | 51.0(-38.0)#29 | 48.0(-35.0)#713 |
| 30. | Willoughby | 13.0 | 51.0(-38.0)#30 | 48.0(-35.0)#715 |
| 31. | Sheffield Lake | 13.0 | 51.0(-38.0)#31 | 48.0(-35.0)#734 |
| 32. | North Madison | 13.0 | 51.0(-38.0)#32 | 48.0(-35.0)#737 |
| 33. | Independence | 13.0 | 51.0(-38.0)#33 | 48.0(-35.0)#741 |
| 34. | Granville | 13.0 | 51.0(-38.0)#34 | 48.0(-35.0)#748 |
| 35. | Obetz | 13.0 | 51.0(-38.0)#35 | 48.0(-35.0)#751 |
| 36. | Reedurban | 13.0 | 51.0(-38.0)#36 | 48.0(-35.0)#760 |
| 37. | Mount Repose | 13.0 | 51.0(-38.0)#37 | 48.0(-35.0)#769 |
| 38. | Bellville | 13.0 | 51.0(-38.0)#38 | 48.0(-35.0)#794 |
| 39. | Grand Rapids | 13.0 | 51.0(-38.0)#39 | 48.0(-35.0)#822 |
| 40. | Golf Manor | 14.0 | 51.0(-37.0)#40 | 48.0(-34.0)#905 |
| 41. | Navarre | 14.0 | 51.0(-37.0)#41 | 48.0(-34.0)#930 |
| 42. | Gnadenhutten | 14.0 | 51.0(-37.0)#42 | 48.0(-34.0)#945 |
| 43. | Fayette | 14.0 | 51.0(-37.0)#43 | 48.0(-34.0)#950 |
| 44. | Marble Cliff | 14.0 | 51.0(-37.0)#44 | 48.0(-34.0)#957 |
| 45. | West Union | 15.0 | 51.0(-36.0)#45 | 48.0(-33.0)#1,046 |
| 46. | Waynesville | 15.0 | 51.0(-36.0)#46 | 48.0(-33.0)#1,053 |
| 47. | Roseland | 15.0 | 51.0(-36.0)#47 | 48.0(-33.0)#1,070 |
| 48. | De Graff | 15.0 | 51.0(-36.0)#48 | 48.0(-33.0)#1,076 |
| 49. | Frankfort | 15.0 | 51.0(-36.0)#49 | 48.0(-33.0)#1,086 |
| 50. | Chesapeake | 15.0 | 51.0(-36.0)#50 | 48.0(-33.0)#1,088 |
| 51. | Dupont | 15.0 | 51.0(-36.0)#51 | 48.0(-33.0)#1,121 |
| 52. | Norton | 16.0 | 51.0(-35.0)#52 | 48.0(-32.0)#1,136 |
| 53. | Blacklick Estates | 16.0 | 51.0(-35.0)#53 | 48.0(-32.0)#1,145 |
| 54. | Union | 16.0 | 51.0(-35.0)#54 | 48.0(-32.0)#1,158 |
| 55. | Howland Center | 16.0 | 51.0(-35.0)#55 | 48.0(-32.0)#1,163 |
| 56. | Waverly | 16.0 | 51.0(-35.0)#56 | 48.0(-32.0)#1,179 |
| 57. | Fairfax | 16.0 | 51.0(-35.0)#57 | 48.0(-32.0)#1,217 |
| 58. | Beverly | 16.0 | 51.0(-35.0)#58 | 48.0(-32.0)#1,218 |
| 59. | Russia | 16.0 | 51.0(-35.0)#59 | 48.0(-32.0)#1,248 |
| 60. | New Athens | 16.0 | 51.0(-35.0)#60 | 48.0(-32.0)#1,281 |
| 61. | Gratiot | 16.0 | 51.0(-35.0)#61 | 48.0(-32.0)#1,282 |
| 62. | Powell | 17.0 | 51.0(-34.0)#62 | 48.0(-31.0)#1,295 |
| 63. | Lockland | 17.0 | 51.0(-34.0)#63 | 48.0(-31.0)#1,351 |
| 64. | Devola | 17.0 | 51.0(-34.0)#64 | 48.0(-31.0)#1,361 |
| 65. | Holgate | 17.0 | 51.0(-34.0)#65 | 48.0(-31.0)#1,395 |
| 66. | Ostrander | 17.0 | 51.0(-34.0)#66 | 48.0(-31.0)#1,400 |
| 67. | Edon | 17.0 | 51.0(-34.0)#67 | 48.0(-31.0)#1,403 |
| 68. | Arcadia | 17.0 | 51.0(-34.0)#68 | 48.0(-31.0)#1,417 |
| 69. | Hamden | 17.0 | 51.0(-34.0)#69 | 48.0(-31.0)#1,418 |
| 70. | Christiansburg | 17.0 | 51.0(-34.0)#70 | 48.0(-31.0)#1,423 |
| 71. | Kirkersville | 17.0 | 51.0(-34.0)#71 | 48.0(-31.0)#1,427 |
| 72. | Wilmot | 17.0 | 51.0(-34.0)#72 | 48.0(-31.0)#1,441 |
| 73. | Bedford | 18.0 | 51.0(-33.0)#73 | 48.0(-30.0)#1,456 |
| 74. | Perry Heights | 18.0 | 51.0(-33.0)#74 | 48.0(-30.0)#1,476 |
| 75. | Uniontown | 18.0 | 51.0(-33.0)#75 | 48.0(-30.0)#1,492 |
| 76. | Pleasant Run | 18.0 | 51.0(-33.0)#76 | 48.0(-30.0)#1,502 |
| 77. | Miami Heights | 18.0 | 51.0(-33.0)#77 | 48.0(-30.0)#1,506 |
| 78. | Newton Falls | 18.0 | 51.0(-33.0)#78 | 48.0(-30.0)#1,507 |
| 79. | Mineral Ridge | 18.0 | 51.0(-33.0)#79 | 48.0(-30.0)#1,514 |
| 80. | Yellow Springs | 18.0 | 51.0(-33.0)#80 | 48.0(-30.0)#1,517 |
| 81. | Rosemount | 18.0 | 51.0(-33.0)#81 | 48.0(-30.0)#1,550 |
| 82. | Thornville | 18.0 | 51.0(-33.0)#82 | 48.0(-30.0)#1,560 |
| 83. | Pleasantville | 18.0 | 51.0(-33.0)#83 | 48.0(-30.0)#1,587 |
| 84. | Brookside | 18.0 | 51.0(-33.0)#84 | 48.0(-30.0)#1,595 |
| 85. | Murray City | 18.0 | 51.0(-33.0)#85 | 48.0(-30.0)#1,608 |
| 86. | Twinsburg | 19.0 | 51.0(-32.0)#86 | 48.0(-29.0)#1,633 |
| 87. | Steubenville | 19.0 | 51.0(-32.0)#87 | 48.0(-29.0)#1,637 |
| 88. | Germantown | 19.0 | 51.0(-32.0)#88 | 48.0(-29.0)#1,678 |
| 89. | Ottawa | 19.0 | 51.0(-32.0)#89 | 48.0(-29.0)#1,689 |
| 90. | Chagrin Falls | 19.0 | 51.0(-32.0)#90 | 48.0(-29.0)#1,699 |
| 91. | Versailles | 19.0 | 51.0(-32.0)#91 | 48.0(-29.0)#1,706 |
| 92. | Gambier | 19.0 | 51.0(-32.0)#92 | 48.0(-29.0)#1,722 |
| 93. | Craig Beach | 19.0 | 51.0(-32.0)#93 | 48.0(-29.0)#1,731 |
| 94. | Weston | 19.0 | 51.0(-32.0)#94 | 48.0(-29.0)#1,733 |
| 95. | Morgandale | 19.0 | 51.0(-32.0)#95 | 48.0(-29.0)#1,737 |
| 96. | Flushing | 19.0 | 51.0(-32.0)#96 | 48.0(-29.0)#1,757 |
| 97. | Jeromesville | 19.0 | 51.0(-32.0)#97 | 48.0(-29.0)#1,765 |
| 98. | Pitsburg | 19.0 | 51.0(-32.0)#98 | 48.0(-29.0)#1,781 |
| 99. | Belpre | 20.0 | 51.0(-31.0)#99 | 48.0(-28.0)#1,837 |
| 100. | Woodlawn | 20.0 | 51.0(-31.0)#100 | 48.0(-28.0)#1,869 |
Common Questions
What are the Top 10 Cities with the Lowest Births per 1,000 Women in Labor Force in Ohio?
Top 10 Cities with the Lowest Births per 1,000 Women in Labor Force in Ohio are:
#1
4.0
#2
4.0
#3
5.0
#4
5.0
#5
6.0
#6
6.0
#7
7.0
#8
7.0
#9
8.0
#10
8.0
What city has the Lowest Births per 1,000 Women in Labor Force in Ohio?
Forest Park has the Lowest Births per 1,000 Women in Labor Force in Ohio with 4.0.
What is the Number Births per 1,000 Women in Labor Force in the State of Ohio?
Number Births per 1,000 Women in Labor Force in Ohio is 51.0.
What is the Number Births per 1,000 Women in Labor Force in the United States?
Number Births per 1,000 Women in Labor Force in the United States is 48.0.