Cities with the Lowest Births per 1,000 Women in Labor Force in Kentucky
RELATED REPORTS & OPTIONS
Lowest Birth Rate | In Labor Force
Kentucky
Compare Cities
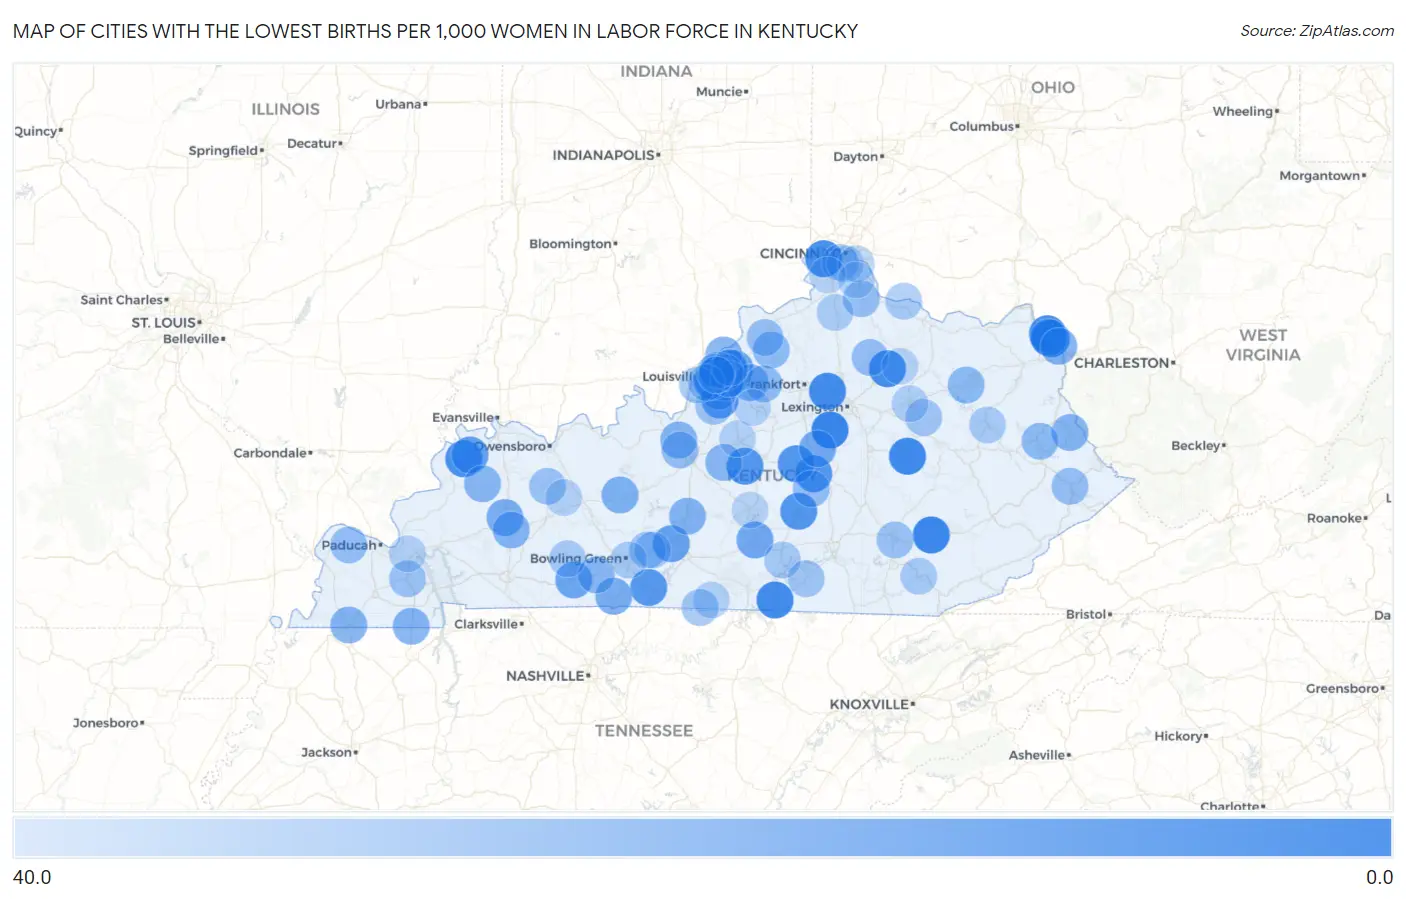
Map of Cities with the Lowest Births per 1,000 Women in Labor Force in Kentucky
40.0
0.0
Cities with the Lowest Births per 1,000 Women in Labor Force in Kentucky
| City | Births / 1,000 Women | vs State | vs National | |
| 1. | Wilmore | 5.0 | 50.0(-45.0)#1 | 48.0(-43.0)#76 |
| 2. | Manchester | 6.0 | 50.0(-44.0)#2 | 48.0(-42.0)#128 |
| 3. | Irvine | 7.0 | 50.0(-43.0)#3 | 48.0(-41.0)#175 |
| 4. | Russell | 8.0 | 50.0(-42.0)#4 | 48.0(-40.0)#240 |
| 5. | Albany | 8.0 | 50.0(-42.0)#5 | 48.0(-40.0)#249 |
| 6. | Midway | 8.0 | 50.0(-42.0)#6 | 48.0(-40.0)#254 |
| 7. | Hebron | 9.0 | 50.0(-41.0)#7 | 48.0(-39.0)#309 |
| 8. | Worthington | 9.0 | 50.0(-41.0)#8 | 48.0(-39.0)#346 |
| 9. | Millersburg | 9.0 | 50.0(-41.0)#9 | 48.0(-39.0)#367 |
| 10. | Breckinridge Center | 10.0 | 50.0(-40.0)#10 | 48.0(-38.0)#446 |
| 11. | Flatwoods | 12.0 | 50.0(-38.0)#11 | 48.0(-36.0)#616 |
| 12. | Junction City | 12.0 | 50.0(-38.0)#12 | 48.0(-36.0)#665 |
| 13. | Liberty | 12.0 | 50.0(-38.0)#13 | 48.0(-36.0)#666 |
| 14. | Plantation | 12.0 | 50.0(-38.0)#14 | 48.0(-36.0)#690 |
| 15. | Perryville | 12.0 | 50.0(-38.0)#15 | 48.0(-36.0)#693 |
| 16. | Loretto | 12.0 | 50.0(-38.0)#16 | 48.0(-36.0)#699 |
| 17. | Scottsville | 13.0 | 50.0(-37.0)#17 | 48.0(-35.0)#766 |
| 18. | Anchorage | 13.0 | 50.0(-37.0)#18 | 48.0(-35.0)#785 |
| 19. | Heritage Creek | 15.0 | 50.0(-35.0)#19 | 48.0(-33.0)#1,089 |
| 20. | Woodland Hills | 15.0 | 50.0(-35.0)#20 | 48.0(-33.0)#1,107 |
| 21. | Waverly | 16.0 | 50.0(-34.0)#21 | 48.0(-32.0)#1,277 |
| 22. | Park City | 17.0 | 50.0(-33.0)#22 | 48.0(-31.0)#1,415 |
| 23. | Strathmoor Village | 17.0 | 50.0(-33.0)#23 | 48.0(-31.0)#1,428 |
| 24. | Pewee Valley | 18.0 | 50.0(-32.0)#24 | 48.0(-30.0)#1,561 |
| 25. | Hollow Creek | 18.0 | 50.0(-32.0)#25 | 48.0(-30.0)#1,592 |
| 26. | Russellville | 19.0 | 50.0(-31.0)#26 | 48.0(-29.0)#1,668 |
| 27. | Fincastle | 19.0 | 50.0(-31.0)#27 | 48.0(-29.0)#1,767 |
| 28. | Columbia | 20.0 | 50.0(-30.0)#28 | 48.0(-28.0)#1,858 |
| 29. | Blue Ridge Manor | 20.0 | 50.0(-30.0)#29 | 48.0(-28.0)#1,924 |
| 30. | Burgin | 21.0 | 50.0(-29.0)#30 | 48.0(-27.0)#2,099 |
| 31. | Bellemeade | 21.0 | 50.0(-29.0)#31 | 48.0(-27.0)#2,103 |
| 32. | Franklin | 22.0 | 50.0(-28.0)#32 | 48.0(-26.0)#2,183 |
| 33. | Earlington | 22.0 | 50.0(-28.0)#33 | 48.0(-26.0)#2,262 |
| 34. | Woodlawn Park | 22.0 | 50.0(-28.0)#34 | 48.0(-26.0)#2,282 |
| 35. | Ashland | 23.0 | 50.0(-27.0)#35 | 48.0(-25.0)#2,342 |
| 36. | Caneyville | 23.0 | 50.0(-27.0)#36 | 48.0(-25.0)#2,486 |
| 37. | Murray Hill | 23.0 | 50.0(-27.0)#37 | 48.0(-25.0)#2,497 |
| 38. | Simpsonville | 24.0 | 50.0(-26.0)#38 | 48.0(-24.0)#2,633 |
| 39. | Fulton | 24.0 | 50.0(-26.0)#39 | 48.0(-24.0)#2,639 |
| 40. | Munfordville | 24.0 | 50.0(-26.0)#40 | 48.0(-24.0)#2,654 |
| 41. | Goshen | 24.0 | 50.0(-26.0)#41 | 48.0(-24.0)#2,682 |
| 42. | Hazel | 24.0 | 50.0(-26.0)#42 | 48.0(-24.0)#2,716 |
| 43. | Vine Grove | 25.0 | 50.0(-25.0)#43 | 48.0(-23.0)#2,802 |
| 44. | Northfield | 25.0 | 50.0(-25.0)#44 | 48.0(-23.0)#2,882 |
| 45. | Nortonville | 25.0 | 50.0(-25.0)#45 | 48.0(-23.0)#2,893 |
| 46. | Inez | 25.0 | 50.0(-25.0)#46 | 48.0(-23.0)#2,899 |
| 47. | Auburn | 26.0 | 50.0(-24.0)#47 | 48.0(-22.0)#3,055 |
| 48. | Dixon | 26.0 | 50.0(-24.0)#48 | 48.0(-22.0)#3,068 |
| 49. | New Haven | 26.0 | 50.0(-24.0)#49 | 48.0(-22.0)#3,082 |
| 50. | Jeffersontown | 27.0 | 50.0(-23.0)#50 | 48.0(-21.0)#3,136 |
| 51. | Morehead | 27.0 | 50.0(-23.0)#51 | 48.0(-21.0)#3,184 |
| 52. | Paintsville | 27.0 | 50.0(-23.0)#52 | 48.0(-21.0)#3,209 |
| 53. | New Castle | 27.0 | 50.0(-23.0)#53 | 48.0(-21.0)#3,282 |
| 54. | Strathmoor Manor | 27.0 | 50.0(-23.0)#54 | 48.0(-21.0)#3,302 |
| 55. | Shelbyville | 28.0 | 50.0(-22.0)#55 | 48.0(-20.0)#3,351 |
| 56. | Riverwood | 28.0 | 50.0(-22.0)#56 | 48.0(-20.0)#3,483 |
| 57. | Pikeville | 29.0 | 50.0(-21.0)#57 | 48.0(-19.0)#3,559 |
| 58. | Cynthiana | 29.0 | 50.0(-21.0)#58 | 48.0(-19.0)#3,566 |
| 59. | Rineyville | 29.0 | 50.0(-21.0)#59 | 48.0(-19.0)#3,596 |
| 60. | Windy Hills | 29.0 | 50.0(-21.0)#60 | 48.0(-19.0)#3,616 |
| 61. | Kevil | 29.0 | 50.0(-21.0)#61 | 48.0(-19.0)#3,670 |
| 62. | Hustonville | 29.0 | 50.0(-21.0)#62 | 48.0(-19.0)#3,673 |
| 63. | Campbellsburg | 30.0 | 50.0(-20.0)#63 | 48.0(-18.0)#3,860 |
| 64. | Butler | 30.0 | 50.0(-20.0)#64 | 48.0(-18.0)#3,876 |
| 65. | London | 31.0 | 50.0(-19.0)#65 | 48.0(-17.0)#3,979 |
| 66. | Benton | 31.0 | 50.0(-19.0)#66 | 48.0(-17.0)#3,996 |
| 67. | Hebron Estates | 31.0 | 50.0(-19.0)#67 | 48.0(-17.0)#4,070 |
| 68. | Meadow Vale | 31.0 | 50.0(-19.0)#68 | 48.0(-17.0)#4,080 |
| 69. | Livermore | 31.0 | 50.0(-19.0)#69 | 48.0(-17.0)#4,082 |
| 70. | Monticello | 32.0 | 50.0(-18.0)#70 | 48.0(-16.0)#4,186 |
| 71. | Jeffersonville | 32.0 | 50.0(-18.0)#71 | 48.0(-16.0)#4,222 |
| 72. | Gamaliel | 32.0 | 50.0(-18.0)#72 | 48.0(-16.0)#4,281 |
| 73. | Oakland | 32.0 | 50.0(-18.0)#73 | 48.0(-16.0)#4,295 |
| 74. | Shively | 33.0 | 50.0(-17.0)#74 | 48.0(-15.0)#4,353 |
| 75. | Douglass Hills | 33.0 | 50.0(-17.0)#75 | 48.0(-15.0)#4,404 |
| 76. | Smiths Grove | 33.0 | 50.0(-17.0)#76 | 48.0(-15.0)#4,494 |
| 77. | Glenview Hills | 33.0 | 50.0(-17.0)#77 | 48.0(-15.0)#4,512 |
| 78. | Bowling Green | 34.0 | 50.0(-16.0)#78 | 48.0(-14.0)#4,533 |
| 79. | West Liberty | 34.0 | 50.0(-16.0)#79 | 48.0(-14.0)#4,644 |
| 80. | Barbourville | 34.0 | 50.0(-16.0)#80 | 48.0(-14.0)#4,646 |
| 81. | Lakeside Park | 34.0 | 50.0(-16.0)#81 | 48.0(-14.0)#4,651 |
| 82. | Jamestown | 34.0 | 50.0(-16.0)#82 | 48.0(-14.0)#4,658 |
| 83. | Augusta | 34.0 | 50.0(-16.0)#83 | 48.0(-14.0)#4,669 |
| 84. | Lewisburg | 34.0 | 50.0(-16.0)#84 | 48.0(-14.0)#4,687 |
| 85. | Parkway Village | 34.0 | 50.0(-16.0)#85 | 48.0(-14.0)#4,711 |
| 86. | Dry Ridge | 35.0 | 50.0(-15.0)#86 | 48.0(-13.0)#4,861 |
| 87. | Mount Sterling | 36.0 | 50.0(-14.0)#87 | 48.0(-12.0)#5,011 |
| 88. | Coldstream | 36.0 | 50.0(-14.0)#88 | 48.0(-12.0)#5,090 |
| 89. | Maryhill Estates | 36.0 | 50.0(-14.0)#89 | 48.0(-12.0)#5,144 |
| 90. | Covington | 37.0 | 50.0(-13.0)#90 | 48.0(-11.0)#5,183 |
| 91. | Bardstown | 37.0 | 50.0(-13.0)#91 | 48.0(-11.0)#5,224 |
| 92. | Tompkinsville | 37.0 | 50.0(-13.0)#92 | 48.0(-11.0)#5,294 |
| 93. | Calvert City | 37.0 | 50.0(-13.0)#93 | 48.0(-11.0)#5,298 |
| 94. | Taylorsville | 37.0 | 50.0(-13.0)#94 | 48.0(-11.0)#5,317 |
| 95. | Crestview | 37.0 | 50.0(-13.0)#95 | 48.0(-11.0)#5,364 |
| 96. | Centertown | 37.0 | 50.0(-13.0)#96 | 48.0(-11.0)#5,366 |
| 97. | Campbellsville | 38.0 | 50.0(-12.0)#97 | 48.0(-10.00)#5,452 |
| 98. | Union | 38.0 | 50.0(-12.0)#98 | 48.0(-10.00)#5,477 |
| 99. | Claryville | 38.0 | 50.0(-12.0)#99 | 48.0(-10.00)#5,515 |
| 100. | Carlisle | 38.0 | 50.0(-12.0)#100 | 48.0(-10.00)#5,537 |
Common Questions
What are the Top 10 Cities with the Lowest Births per 1,000 Women in Labor Force in Kentucky?
Top 10 Cities with the Lowest Births per 1,000 Women in Labor Force in Kentucky are:
#1
5.0
#2
6.0
#3
7.0
#4
8.0
#5
8.0
#6
8.0
#7
9.0
#8
9.0
#9
9.0
#10
10.0
What city has the Lowest Births per 1,000 Women in Labor Force in Kentucky?
Wilmore has the Lowest Births per 1,000 Women in Labor Force in Kentucky with 5.0.
What is the Number Births per 1,000 Women in Labor Force in the State of Kentucky?
Number Births per 1,000 Women in Labor Force in Kentucky is 50.0.
What is the Number Births per 1,000 Women in Labor Force in the United States?
Number Births per 1,000 Women in Labor Force in the United States is 48.0.