Cities with the Lowest Births per 1,000 Women in Labor Force in Maryland
RELATED REPORTS & OPTIONS
Lowest Birth Rate | In Labor Force
Maryland
Compare Cities
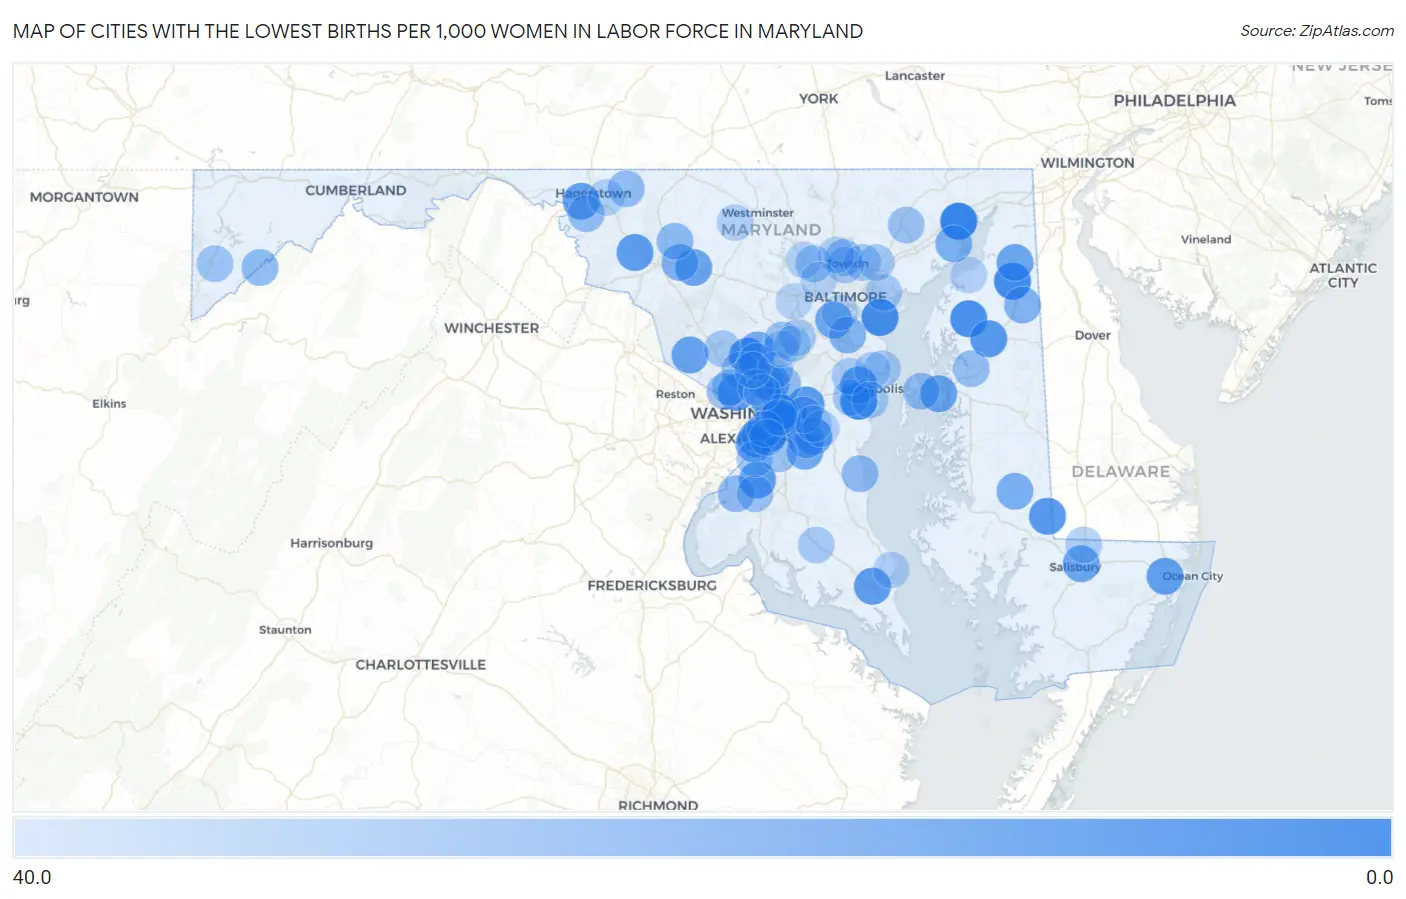
Map of Cities with the Lowest Births per 1,000 Women in Labor Force in Maryland
40.0
0.0
Cities with the Lowest Births per 1,000 Women in Labor Force in Maryland
| City | Births / 1,000 Women | vs State | vs National | |
| 1. | Havre De Grace | 2.0 | 50.0(-48.0)#1 | 48.0(-46.0)#9 |
| 2. | Edgewater | 5.0 | 50.0(-45.0)#2 | 48.0(-43.0)#69 |
| 3. | Galena | 5.0 | 50.0(-45.0)#3 | 48.0(-43.0)#97 |
| 4. | Edgemere | 6.0 | 50.0(-44.0)#4 | 48.0(-42.0)#104 |
| 5. | Marlow Heights | 6.0 | 50.0(-44.0)#5 | 48.0(-42.0)#113 |
| 6. | Peppermill Village | 6.0 | 50.0(-44.0)#6 | 48.0(-42.0)#115 |
| 7. | Chestertown | 7.0 | 50.0(-43.0)#7 | 48.0(-41.0)#166 |
| 8. | Layhill | 7.0 | 50.0(-43.0)#8 | 48.0(-41.0)#170 |
| 9. | Friendship Heights Village | 11.0 | 50.0(-39.0)#9 | 48.0(-37.0)#531 |
| 10. | Church Hill | 11.0 | 50.0(-39.0)#10 | 48.0(-37.0)#574 |
| 11. | Sharptown | 11.0 | 50.0(-39.0)#11 | 48.0(-37.0)#584 |
| 12. | Woodmore | 12.0 | 50.0(-38.0)#12 | 48.0(-36.0)#637 |
| 13. | Forest Heights | 12.0 | 50.0(-38.0)#13 | 48.0(-36.0)#657 |
| 14. | Parole | 13.0 | 50.0(-37.0)#14 | 48.0(-35.0)#720 |
| 15. | California | 13.0 | 50.0(-37.0)#15 | 48.0(-35.0)#727 |
| 16. | Accokeek | 13.0 | 50.0(-37.0)#16 | 48.0(-35.0)#728 |
| 17. | Middletown | 13.0 | 50.0(-37.0)#17 | 48.0(-35.0)#759 |
| 18. | Berlin | 14.0 | 50.0(-36.0)#18 | 48.0(-34.0)#892 |
| 19. | Upper Marlboro | 14.0 | 50.0(-36.0)#19 | 48.0(-34.0)#965 |
| 20. | Halfway | 15.0 | 50.0(-35.0)#20 | 48.0(-33.0)#1,012 |
| 21. | Darnestown | 16.0 | 50.0(-34.0)#21 | 48.0(-32.0)#1,161 |
| 22. | Grasonville | 16.0 | 50.0(-34.0)#22 | 48.0(-32.0)#1,188 |
| 23. | New Market | 16.0 | 50.0(-34.0)#23 | 48.0(-32.0)#1,220 |
| 24. | Colmar Manor | 16.0 | 50.0(-34.0)#24 | 48.0(-32.0)#1,222 |
| 25. | Salisbury | 17.0 | 50.0(-33.0)#25 | 48.0(-31.0)#1,285 |
| 26. | Linthicum | 17.0 | 50.0(-33.0)#26 | 48.0(-31.0)#1,303 |
| 27. | District Heights | 17.0 | 50.0(-33.0)#27 | 48.0(-31.0)#1,328 |
| 28. | Cecilton | 17.0 | 50.0(-33.0)#28 | 48.0(-31.0)#1,405 |
| 29. | National Harbor | 18.0 | 50.0(-32.0)#29 | 48.0(-30.0)#1,511 |
| 30. | Marlton | 19.0 | 50.0(-31.0)#30 | 48.0(-29.0)#1,659 |
| 31. | Burnt Mills | 19.0 | 50.0(-31.0)#31 | 48.0(-29.0)#1,690 |
| 32. | Cloverly | 20.0 | 50.0(-30.0)#32 | 48.0(-28.0)#1,804 |
| 33. | College Park | 21.0 | 50.0(-29.0)#33 | 48.0(-27.0)#1,968 |
| 34. | Coral Hills | 21.0 | 50.0(-29.0)#34 | 48.0(-27.0)#2,009 |
| 35. | Hurlock | 21.0 | 50.0(-29.0)#35 | 48.0(-27.0)#2,067 |
| 36. | Glassmanor | 22.0 | 50.0(-28.0)#36 | 48.0(-26.0)#2,160 |
| 37. | Aberdeen Proving Ground | 22.0 | 50.0(-28.0)#37 | 48.0(-26.0)#2,232 |
| 38. | Glen Burnie | 23.0 | 50.0(-27.0)#38 | 48.0(-25.0)#2,324 |
| 39. | Spring Ridge | 23.0 | 50.0(-27.0)#39 | 48.0(-25.0)#2,390 |
| 40. | Millington | 23.0 | 50.0(-27.0)#40 | 48.0(-25.0)#2,493 |
| 41. | Adelphi | 24.0 | 50.0(-26.0)#41 | 48.0(-24.0)#2,562 |
| 42. | Queensland | 24.0 | 50.0(-26.0)#42 | 48.0(-24.0)#2,648 |
| 43. | Kettering | 25.0 | 50.0(-25.0)#43 | 48.0(-23.0)#2,769 |
| 44. | Walkersville | 26.0 | 50.0(-24.0)#44 | 48.0(-22.0)#2,996 |
| 45. | Kitzmiller | 26.0 | 50.0(-24.0)#45 | 48.0(-22.0)#3,118 |
| 46. | Bryans Road | 27.0 | 50.0(-23.0)#46 | 48.0(-21.0)#3,176 |
| 47. | Chesapeake Beach | 27.0 | 50.0(-23.0)#47 | 48.0(-21.0)#3,188 |
| 48. | Greenbelt | 28.0 | 50.0(-22.0)#48 | 48.0(-20.0)#3,338 |
| 49. | Walker Mill | 28.0 | 50.0(-22.0)#49 | 48.0(-20.0)#3,371 |
| 50. | Seat Pleasant | 28.0 | 50.0(-22.0)#50 | 48.0(-20.0)#3,399 |
| 51. | Chester | 28.0 | 50.0(-22.0)#51 | 48.0(-20.0)#3,401 |
| 52. | St James | 28.0 | 50.0(-22.0)#52 | 48.0(-20.0)#3,408 |
| 53. | Smithsburg | 28.0 | 50.0(-22.0)#53 | 48.0(-20.0)#3,422 |
| 54. | North Kensington | 29.0 | 50.0(-21.0)#54 | 48.0(-19.0)#3,553 |
| 55. | Lutherville | 29.0 | 50.0(-21.0)#55 | 48.0(-19.0)#3,564 |
| 56. | Centreville | 29.0 | 50.0(-21.0)#56 | 48.0(-19.0)#3,578 |
| 57. | Glen Echo | 29.0 | 50.0(-21.0)#57 | 48.0(-19.0)#3,702 |
| 58. | Scaggsville | 30.0 | 50.0(-20.0)#58 | 48.0(-18.0)#3,769 |
| 59. | Bel Air | 30.0 | 50.0(-20.0)#59 | 48.0(-18.0)#3,770 |
| 60. | Clinton | 31.0 | 50.0(-19.0)#60 | 48.0(-17.0)#3,919 |
| 61. | Bensville | 31.0 | 50.0(-19.0)#61 | 48.0(-17.0)#3,948 |
| 62. | Colesville | 31.0 | 50.0(-19.0)#62 | 48.0(-17.0)#3,953 |
| 63. | Garrison | 31.0 | 50.0(-19.0)#63 | 48.0(-17.0)#3,964 |
| 64. | Riva | 31.0 | 50.0(-19.0)#64 | 48.0(-17.0)#3,995 |
| 65. | Mountain Lake Park | 31.0 | 50.0(-19.0)#65 | 48.0(-17.0)#4,039 |
| 66. | Carney | 32.0 | 50.0(-18.0)#66 | 48.0(-16.0)#4,130 |
| 67. | Green Valley | 32.0 | 50.0(-18.0)#67 | 48.0(-16.0)#4,156 |
| 68. | Towson | 33.0 | 50.0(-17.0)#68 | 48.0(-15.0)#4,315 |
| 69. | Essex | 33.0 | 50.0(-17.0)#69 | 48.0(-15.0)#4,323 |
| 70. | Perry Hall | 33.0 | 50.0(-17.0)#70 | 48.0(-15.0)#4,334 |
| 71. | Fort Washington | 33.0 | 50.0(-17.0)#71 | 48.0(-15.0)#4,338 |
| 72. | Hillcrest Heights | 33.0 | 50.0(-17.0)#72 | 48.0(-15.0)#4,351 |
| 73. | Derwood | 33.0 | 50.0(-17.0)#73 | 48.0(-15.0)#4,455 |
| 74. | Bethesda | 34.0 | 50.0(-16.0)#74 | 48.0(-14.0)#4,534 |
| 75. | Beltsville | 34.0 | 50.0(-16.0)#75 | 48.0(-14.0)#4,561 |
| 76. | Cape St Claire | 34.0 | 50.0(-16.0)#76 | 48.0(-14.0)#4,587 |
| 77. | Savage | 34.0 | 50.0(-16.0)#77 | 48.0(-14.0)#4,597 |
| 78. | Capitol Heights | 34.0 | 50.0(-16.0)#78 | 48.0(-14.0)#4,634 |
| 79. | Mechanicsville | 34.0 | 50.0(-16.0)#79 | 48.0(-14.0)#4,664 |
| 80. | Crownsville | 34.0 | 50.0(-16.0)#80 | 48.0(-14.0)#4,678 |
| 81. | Arnold | 35.0 | 50.0(-15.0)#81 | 48.0(-13.0)#4,777 |
| 82. | Annapolis Neck | 35.0 | 50.0(-15.0)#82 | 48.0(-13.0)#4,800 |
| 83. | Delmar | 35.0 | 50.0(-15.0)#83 | 48.0(-13.0)#4,840 |
| 84. | Temple Hills | 36.0 | 50.0(-14.0)#84 | 48.0(-12.0)#5,005 |
| 85. | Robinwood | 36.0 | 50.0(-14.0)#85 | 48.0(-12.0)#5,008 |
| 86. | West Laurel | 36.0 | 50.0(-14.0)#86 | 48.0(-12.0)#5,033 |
| 87. | Marlboro Meadows | 36.0 | 50.0(-14.0)#87 | 48.0(-12.0)#5,046 |
| 88. | New Windsor | 36.0 | 50.0(-14.0)#88 | 48.0(-12.0)#5,094 |
| 89. | Takoma Park | 37.0 | 50.0(-13.0)#89 | 48.0(-11.0)#5,210 |
| 90. | Mays Chapel | 37.0 | 50.0(-13.0)#90 | 48.0(-11.0)#5,229 |
| 91. | Chesapeake Ranch Estates | 37.0 | 50.0(-13.0)#91 | 48.0(-11.0)#5,238 |
| 92. | Betterton | 37.0 | 50.0(-13.0)#92 | 48.0(-11.0)#5,367 |
| 93. | Ellicott City | 38.0 | 50.0(-12.0)#93 | 48.0(-10.00)#5,384 |
| 94. | Chillum | 38.0 | 50.0(-12.0)#94 | 48.0(-10.00)#5,403 |
| 95. | Owings Mills | 38.0 | 50.0(-12.0)#95 | 48.0(-10.00)#5,405 |
| 96. | Lochearn | 38.0 | 50.0(-12.0)#96 | 48.0(-10.00)#5,412 |
| 97. | North Laurel | 38.0 | 50.0(-12.0)#97 | 48.0(-10.00)#5,418 |
| 98. | Kemp Mill | 38.0 | 50.0(-12.0)#98 | 48.0(-10.00)#5,439 |
| 99. | Brock Hall | 38.0 | 50.0(-12.0)#99 | 48.0(-10.00)#5,449 |
| 100. | Baltimore Highlands | 38.0 | 50.0(-12.0)#100 | 48.0(-10.00)#5,474 |
Common Questions
What are the Top 10 Cities with the Lowest Births per 1,000 Women in Labor Force in Maryland?
Top 10 Cities with the Lowest Births per 1,000 Women in Labor Force in Maryland are:
#1
2.0
#2
5.0
#3
5.0
#4
6.0
#5
6.0
#6
6.0
#7
7.0
#8
7.0
#9
11.0
#10
11.0
What city has the Lowest Births per 1,000 Women in Labor Force in Maryland?
Havre De Grace has the Lowest Births per 1,000 Women in Labor Force in Maryland with 2.0.
What is the Number Births per 1,000 Women in Labor Force in the State of Maryland?
Number Births per 1,000 Women in Labor Force in Maryland is 50.0.
What is the Number Births per 1,000 Women in Labor Force in the United States?
Number Births per 1,000 Women in Labor Force in the United States is 48.0.