Zip Codes with the Highest Percentage of Population Employed in Firefighting & Prevention in Bellingham, WA
RELATED REPORTS & OPTIONS
Firefighting & Prevention
Bellingham
Compare Zip Codes
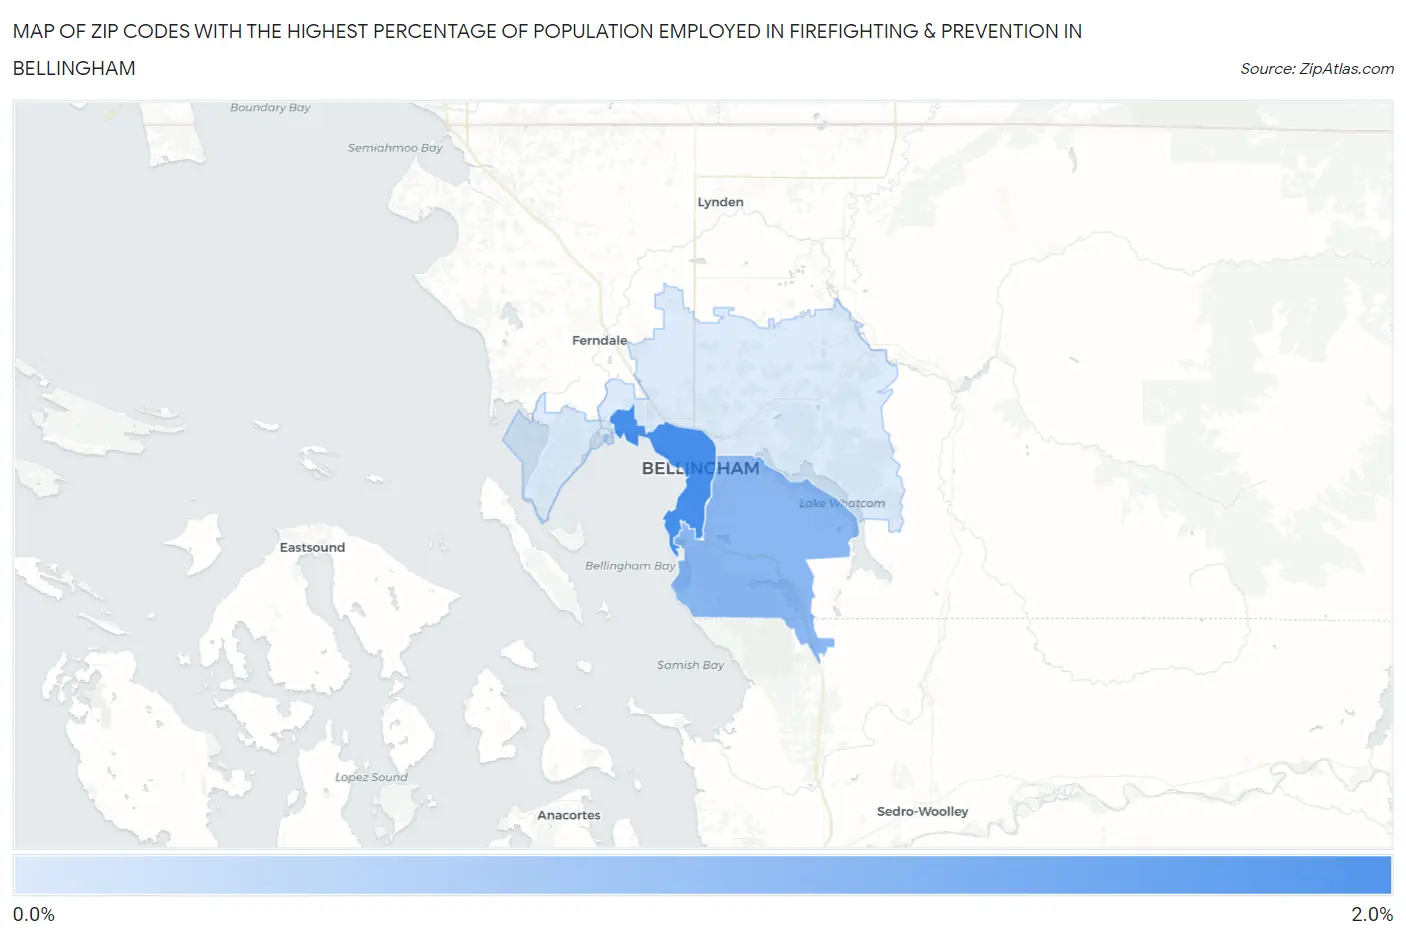
Map of Zip Codes with the Highest Percentage of Population Employed in Firefighting & Prevention in Bellingham
0.85%
1.6%
Zip Codes with the Highest Percentage of Population Employed in Firefighting & Prevention in Bellingham, WA
| Zip Code | % Employed | vs State | vs National | |
| 1. | 98225 | 1.6% | 1.1%(+0.422)#151 | 1.2%(+0.372)#6,604 |
| 2. | 98229 | 1.2% | 1.1%(+0.106)#204 | 1.2%(+0.056)#8,803 |
| 3. | 98226 | 0.85% | 1.1%(-0.287)#285 | 1.2%(-0.337)#12,690 |
1
Common Questions
What are the Top Zip Codes with the Highest Percentage of Population Employed in Firefighting & Prevention in Bellingham, WA?
Top Zip Codes with the Highest Percentage of Population Employed in Firefighting & Prevention in Bellingham, WA are:
What zip code has the Highest Percentage of Population Employed in Firefighting & Prevention in Bellingham, WA?
98225 has the Highest Percentage of Population Employed in Firefighting & Prevention in Bellingham, WA with 1.6%.
What is the Percentage of Population Employed in Firefighting & Prevention in Bellingham, WA?
Percentage of Population Employed in Firefighting & Prevention in Bellingham is 1.2%.
What is the Percentage of Population Employed in Firefighting & Prevention in Washington?
Percentage of Population Employed in Firefighting & Prevention in Washington is 1.1%.
What is the Percentage of Population Employed in Firefighting & Prevention in the United States?
Percentage of Population Employed in Firefighting & Prevention in the United States is 1.2%.