Zip Codes with the Highest Percentage of Population Employed in Firefighting & Prevention in Lynnwood, WA
RELATED REPORTS & OPTIONS
Firefighting & Prevention
Lynnwood
Compare Zip Codes
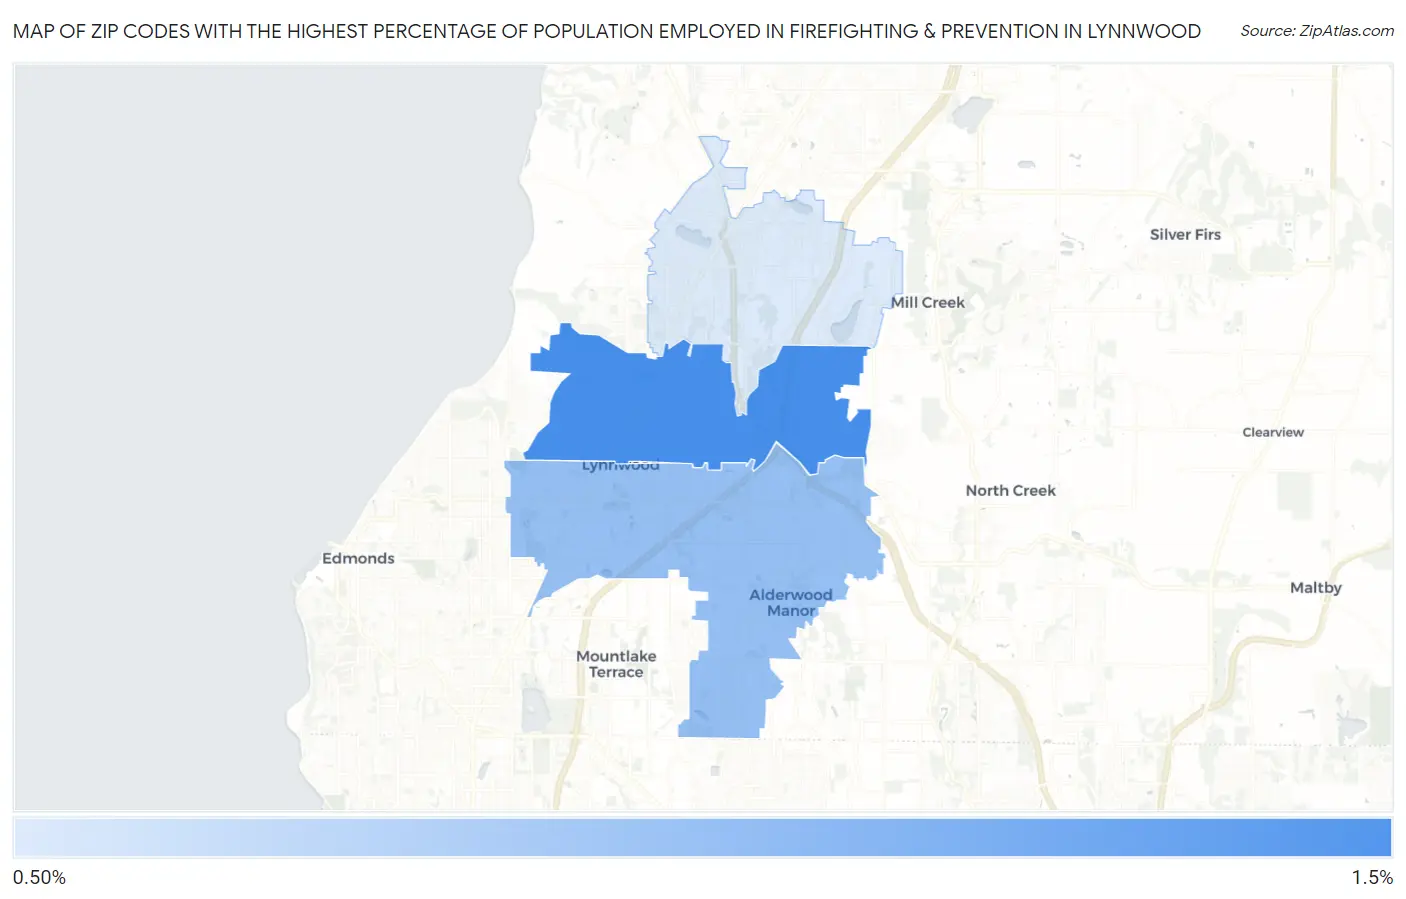
Map of Zip Codes with the Highest Percentage of Population Employed in Firefighting & Prevention in Lynnwood
0.60%
1.4%
Zip Codes with the Highest Percentage of Population Employed in Firefighting & Prevention in Lynnwood, WA
| Zip Code | % Employed | vs State | vs National | |
| 1. | 98037 | 1.4% | 1.1%(+0.284)#172 | 1.2%(+0.234)#7,502 |
| 2. | 98036 | 0.99% | 1.1%(-0.144)#257 | 1.2%(-0.194)#11,171 |
| 3. | 98087 | 0.60% | 1.1%(-0.541)#339 | 1.2%(-0.591)#15,471 |
1
Common Questions
What are the Top Zip Codes with the Highest Percentage of Population Employed in Firefighting & Prevention in Lynnwood, WA?
Top Zip Codes with the Highest Percentage of Population Employed in Firefighting & Prevention in Lynnwood, WA are:
What zip code has the Highest Percentage of Population Employed in Firefighting & Prevention in Lynnwood, WA?
98037 has the Highest Percentage of Population Employed in Firefighting & Prevention in Lynnwood, WA with 1.4%.
What is the Percentage of Population Employed in Firefighting & Prevention in Lynnwood, WA?
Percentage of Population Employed in Firefighting & Prevention in Lynnwood is 1.3%.
What is the Percentage of Population Employed in Firefighting & Prevention in Washington?
Percentage of Population Employed in Firefighting & Prevention in Washington is 1.1%.
What is the Percentage of Population Employed in Firefighting & Prevention in the United States?
Percentage of Population Employed in Firefighting & Prevention in the United States is 1.2%.