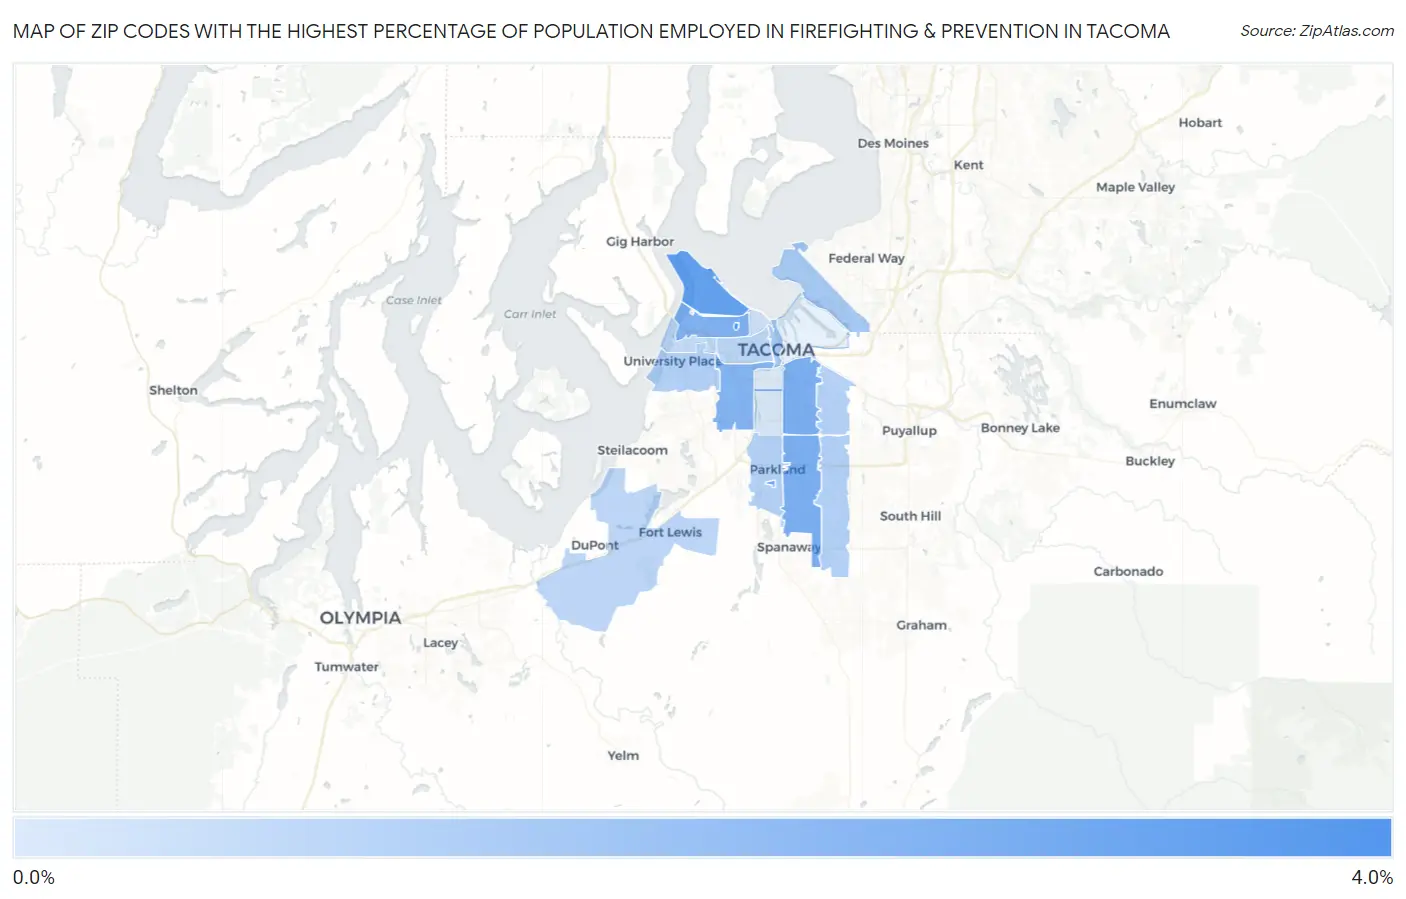
Zip Codes with the Highest Percentage of Population Employed in Firefighting & Prevention in Tacoma, WA
RELATED REPORTS & OPTIONS
Firefighting & Prevention
Tacoma
Compare Zip Codes
Map of Zip Codes with the Highest Percentage of Population Employed in Firefighting & Prevention in Tacoma
0.34%
3.0%
Zip Codes with the Highest Percentage of Population Employed in Firefighting & Prevention in Tacoma, WA
| Zip Code | % Employed | vs State | vs National | |
| 1. | 98416 | 3.0% | 1.1%(+1.89)#44 | 1.2%(+1.84)#2,202 |
| 2. | 98407 | 2.5% | 1.1%(+1.33)#67 | 1.2%(+1.28)#3,169 |
| 3. | 98447 | 2.3% | 1.1%(+1.12)#82 | 1.2%(+1.07)#3,705 |
| 4. | 98445 | 2.1% | 1.1%(+0.941)#95 | 1.2%(+0.891)#4,229 |
| 5. | 98404 | 2.1% | 1.1%(+0.926)#98 | 1.2%(+0.876)#4,284 |
| 6. | 98406 | 2.0% | 1.1%(+0.859)#104 | 1.2%(+0.809)#4,524 |
| 7. | 98409 | 1.9% | 1.1%(+0.790)#109 | 1.2%(+0.740)#4,806 |
| 8. | 98402 | 1.3% | 1.1%(+0.175)#187 | 1.2%(+0.125)#8,266 |
| 9. | 98422 | 1.3% | 1.1%(+0.152)#192 | 1.2%(+0.102)#8,442 |
| 10. | 98446 | 1.1% | 1.1%(-0.040)#233 | 1.2%(-0.090)#10,141 |
| 11. | 98466 | 1.1% | 1.1%(-0.049)#235 | 1.2%(-0.099)#10,222 |
| 12. | 98444 | 1.1% | 1.1%(-0.084)#245 | 1.2%(-0.134)#10,590 |
| 13. | 98443 | 1.0% | 1.1%(-0.097)#247 | 1.2%(-0.147)#10,695 |
| 14. | 98433 | 0.93% | 1.1%(-0.203)#268 | 1.2%(-0.253)#11,811 |
| 15. | 98405 | 0.90% | 1.1%(-0.237)#272 | 1.2%(-0.287)#12,182 |
| 16. | 98465 | 0.76% | 1.1%(-0.380)#309 | 1.2%(-0.430)#13,698 |
| 17. | 98403 | 0.59% | 1.1%(-0.543)#340 | 1.2%(-0.593)#15,497 |
| 18. | 98408 | 0.42% | 1.1%(-0.716)#379 | 1.2%(-0.766)#17,420 |
| 19. | 98418 | 0.34% | 1.1%(-0.794)#397 | 1.2%(-0.844)#18,328 |
1
Common Questions
What are the Top 10 Zip Codes with the Highest Percentage of Population Employed in Firefighting & Prevention in Tacoma, WA?
Top 10 Zip Codes with the Highest Percentage of Population Employed in Firefighting & Prevention in Tacoma, WA are:
What zip code has the Highest Percentage of Population Employed in Firefighting & Prevention in Tacoma, WA?
98416 has the Highest Percentage of Population Employed in Firefighting & Prevention in Tacoma, WA with 3.0%.
What is the Percentage of Population Employed in Firefighting & Prevention in Tacoma, WA?
Percentage of Population Employed in Firefighting & Prevention in Tacoma is 1.4%.
What is the Percentage of Population Employed in Firefighting & Prevention in Washington?
Percentage of Population Employed in Firefighting & Prevention in Washington is 1.1%.
What is the Percentage of Population Employed in Firefighting & Prevention in the United States?
Percentage of Population Employed in Firefighting & Prevention in the United States is 1.2%.