Cities with the Largest Native Hawaiian Community in Pennsylvania
RELATED REPORTS & OPTIONS
Native Hawaiian
Pennsylvania
Compare Cities
Map of Cities with the Largest Native Hawaiian Community in Pennsylvania
0
800
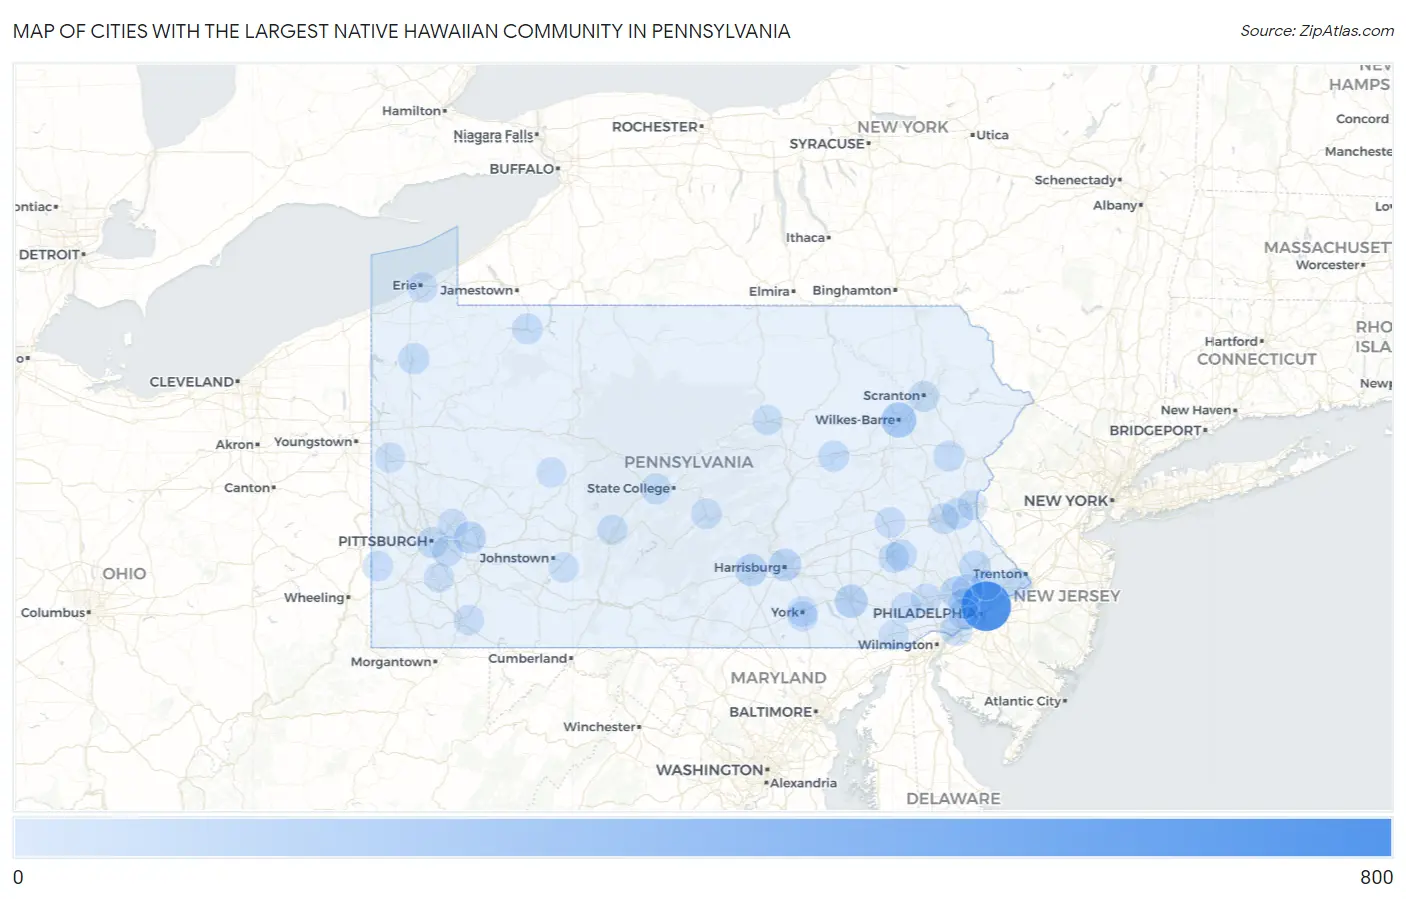
Cities with the Largest Native Hawaiian Community in Pennsylvania
| City | Native Hawaiian | vs State | vs National | |
| 1. | Philadelphia | 738 | 4,990 (14.79%)#1 | 654,614 (0.11%)#125 |
| 2. | Wilkes Barre | 187 | 4,990 (3.75%)#2 | 654,614 (0.03%)#449 |
| 3. | Media Borough | 143 | 4,990 (2.87%)#3 | 654,614 (0.02%)#567 |
| 4. | Lancaster | 110 | 4,990 (2.20%)#4 | 654,614 (0.02%)#699 |
| 5. | Harrisburg | 89 | 4,990 (1.78%)#5 | 654,614 (0.01%)#836 |
| 6. | Schlusser | 83 | 4,990 (1.66%)#6 | 654,614 (0.01%)#883 |
| 7. | Ambridge Borough | 80 | 4,990 (1.60%)#7 | 654,614 (0.01%)#912 |
| 8. | Steelton Borough | 76 | 4,990 (1.52%)#8 | 654,614 (0.01%)#947 |
| 9. | King Of Prussia | 69 | 4,990 (1.38%)#9 | 654,614 (0.01%)#1,000 |
| 10. | Murrysville | 69 | 4,990 (1.38%)#10 | 654,614 (0.01%)#1,002 |
| 11. | Chester | 68 | 4,990 (1.36%)#11 | 654,614 (0.01%)#1,015 |
| 12. | Brittany Farms The Highlands | 55 | 4,990 (1.10%)#12 | 654,614 (0.01%)#1,175 |
| 13. | Plymouth Meeting | 51 | 4,990 (1.02%)#13 | 654,614 (0.01%)#1,237 |
| 14. | Meyersdale Borough | 51 | 4,990 (1.02%)#14 | 654,614 (0.01%)#1,242 |
| 15. | Pittsburgh | 44 | 4,990 (0.88%)#15 | 654,614 (0.01%)#1,356 |
| 16. | Bethlehem | 44 | 4,990 (0.88%)#16 | 654,614 (0.01%)#1,358 |
| 17. | Mcdonald Borough | 39 | 4,990 (0.78%)#17 | 654,614 (0.01%)#1,486 |
| 18. | Meadville | 38 | 4,990 (0.76%)#18 | 654,614 (0.01%)#1,501 |
| 19. | Hallam Borough | 37 | 4,990 (0.74%)#19 | 654,614 (0.01%)#1,527 |
| 20. | Bloomsburg | 36 | 4,990 (0.72%)#20 | 654,614 (0.01%)#1,540 |
| 21. | Stony Creek Mills | 36 | 4,990 (0.72%)#21 | 654,614 (0.01%)#1,548 |
| 22. | Levittown | 33 | 4,990 (0.66%)#22 | 654,614 (0.01%)#1,605 |
| 23. | Bryn Mawr | 33 | 4,990 (0.66%)#23 | 654,614 (0.01%)#1,629 |
| 24. | Dillsburg Borough | 32 | 4,990 (0.64%)#24 | 654,614 (0.00%)#1,656 |
| 25. | Scranton | 31 | 4,990 (0.62%)#25 | 654,614 (0.00%)#1,666 |
| 26. | Stormstown | 31 | 4,990 (0.62%)#26 | 654,614 (0.00%)#1,692 |
| 27. | Larksville Borough | 29 | 4,990 (0.58%)#27 | 654,614 (0.00%)#1,747 |
| 28. | Warren | 28 | 4,990 (0.56%)#28 | 654,614 (0.00%)#1,775 |
| 29. | Gallitzin Borough | 28 | 4,990 (0.56%)#29 | 654,614 (0.00%)#1,792 |
| 30. | Penn Lake Park Borough | 27 | 4,990 (0.54%)#30 | 654,614 (0.00%)#1,823 |
| 31. | Folcroft Borough | 26 | 4,990 (0.52%)#31 | 654,614 (0.00%)#1,852 |
| 32. | Polk Borough | 26 | 4,990 (0.52%)#32 | 654,614 (0.00%)#1,863 |
| 33. | Mcveytown Borough | 26 | 4,990 (0.52%)#33 | 654,614 (0.00%)#1,864 |
| 34. | Allentown | 25 | 4,990 (0.50%)#34 | 654,614 (0.00%)#1,866 |
| 35. | Kennett Square Borough | 25 | 4,990 (0.50%)#35 | 654,614 (0.00%)#1,901 |
| 36. | Duquesne | 25 | 4,990 (0.50%)#36 | 654,614 (0.00%)#1,903 |
| 37. | Sierra View | 24 | 4,990 (0.48%)#37 | 654,614 (0.00%)#1,930 |
| 38. | Drexel Hill | 23 | 4,990 (0.46%)#38 | 654,614 (0.00%)#1,950 |
| 39. | Somerset Borough | 21 | 4,990 (0.42%)#39 | 654,614 (0.00%)#2,066 |
| 40. | Reading | 20 | 4,990 (0.40%)#40 | 654,614 (0.00%)#2,080 |
| 41. | Mifflinburg Borough | 20 | 4,990 (0.40%)#41 | 654,614 (0.00%)#2,111 |
| 42. | Phoenixville Borough | 19 | 4,990 (0.38%)#42 | 654,614 (0.00%)#2,142 |
| 43. | Lemont Furnace | 19 | 4,990 (0.38%)#43 | 654,614 (0.00%)#2,169 |
| 44. | Erie | 18 | 4,990 (0.36%)#44 | 654,614 (0.00%)#2,176 |
| 45. | Edenburg | 18 | 4,990 (0.36%)#45 | 654,614 (0.00%)#2,225 |
| 46. | Lionville | 17 | 4,990 (0.34%)#46 | 654,614 (0.00%)#2,265 |
| 47. | Highland Park | 17 | 4,990 (0.34%)#47 | 654,614 (0.00%)#2,283 |
| 48. | Baldwin Borough | 16 | 4,990 (0.32%)#48 | 654,614 (0.00%)#2,316 |
| 49. | Richlandtown Borough | 15 | 4,990 (0.30%)#49 | 654,614 (0.00%)#2,412 |
| 50. | Willow Grove | 14 | 4,990 (0.28%)#50 | 654,614 (0.00%)#2,450 |
| 51. | Stockertown Borough | 14 | 4,990 (0.28%)#51 | 654,614 (0.00%)#2,482 |
| 52. | Avella | 14 | 4,990 (0.28%)#52 | 654,614 (0.00%)#2,483 |
| 53. | York | 13 | 4,990 (0.26%)#53 | 654,614 (0.00%)#2,500 |
| 54. | Eagleville Cdp Montgomery County | 13 | 4,990 (0.26%)#54 | 654,614 (0.00%)#2,527 |
| 55. | Grantley | 13 | 4,990 (0.26%)#55 | 654,614 (0.00%)#2,528 |
| 56. | Marysville Borough | 13 | 4,990 (0.26%)#56 | 654,614 (0.00%)#2,538 |
| 57. | Manchester Borough | 12 | 4,990 (0.24%)#57 | 654,614 (0.00%)#2,604 |
| 58. | Mount Pleasant Borough | 11 | 4,990 (0.22%)#58 | 654,614 (0.00%)#2,681 |
| 59. | Altoona | 10 | 4,990 (0.20%)#59 | 654,614 (0.00%)#2,733 |
| 60. | Williamsport | 10 | 4,990 (0.20%)#60 | 654,614 (0.00%)#2,742 |
| 61. | Lansdale Borough | 10 | 4,990 (0.20%)#61 | 654,614 (0.00%)#2,750 |
| 62. | Waynesboro Borough | 10 | 4,990 (0.20%)#62 | 654,614 (0.00%)#2,761 |
| 63. | Old Forge Borough | 10 | 4,990 (0.20%)#63 | 654,614 (0.00%)#2,769 |
| 64. | Camp Hill Borough | 10 | 4,990 (0.20%)#64 | 654,614 (0.00%)#2,771 |
| 65. | Ellwood City Borough | 10 | 4,990 (0.20%)#65 | 654,614 (0.00%)#2,775 |
| 66. | Forty Fort Borough | 10 | 4,990 (0.20%)#66 | 654,614 (0.00%)#2,783 |
| 67. | Wyoming Borough | 10 | 4,990 (0.20%)#67 | 654,614 (0.00%)#2,789 |
| 68. | West Leechburg Borough | 10 | 4,990 (0.20%)#68 | 654,614 (0.00%)#2,807 |
| 69. | Bryn Athyn Borough | 10 | 4,990 (0.20%)#69 | 654,614 (0.00%)#2,810 |
| 70. | Norristown Borough | 9 | 4,990 (0.18%)#70 | 654,614 (0.00%)#2,841 |
| 71. | Forest Hills Borough | 9 | 4,990 (0.18%)#71 | 654,614 (0.00%)#2,883 |
| 72. | Freemansburg Borough | 9 | 4,990 (0.18%)#72 | 654,614 (0.00%)#2,898 |
| 73. | Jacobus Borough | 9 | 4,990 (0.18%)#73 | 654,614 (0.00%)#2,907 |
| 74. | Bellwood Borough | 9 | 4,990 (0.18%)#74 | 654,614 (0.00%)#2,913 |
| 75. | Coatesville | 8 | 4,990 (0.16%)#75 | 654,614 (0.00%)#2,974 |
| 76. | Loretto Borough | 8 | 4,990 (0.16%)#76 | 654,614 (0.00%)#3,029 |
| 77. | New Castle | 7 | 4,990 (0.14%)#77 | 654,614 (0.00%)#3,077 |
| 78. | Palmyra Borough | 7 | 4,990 (0.14%)#78 | 654,614 (0.00%)#3,097 |
| 79. | Summit Hill Borough | 7 | 4,990 (0.14%)#79 | 654,614 (0.00%)#3,112 |
| 80. | Weatherly Borough | 7 | 4,990 (0.14%)#80 | 654,614 (0.00%)#3,119 |
| 81. | Glen Rock Borough | 7 | 4,990 (0.14%)#81 | 654,614 (0.00%)#3,121 |
| 82. | Lincoln University | 7 | 4,990 (0.14%)#82 | 654,614 (0.00%)#3,124 |
| 83. | Yeadon Borough | 6 | 4,990 (0.12%)#83 | 654,614 (0.00%)#3,179 |
| 84. | West View Borough | 6 | 4,990 (0.12%)#84 | 654,614 (0.00%)#3,191 |
| 85. | Boyertown Borough | 6 | 4,990 (0.12%)#85 | 654,614 (0.00%)#3,198 |
| 86. | Monongahela | 5 | 4,990 (0.10%)#86 | 654,614 (0.00%)#3,307 |
| 87. | South Greensburg Borough | 5 | 4,990 (0.10%)#87 | 654,614 (0.00%)#3,321 |
| 88. | Saegertown Borough | 5 | 4,990 (0.10%)#88 | 654,614 (0.00%)#3,351 |
| 89. | Harwick | 5 | 4,990 (0.10%)#89 | 654,614 (0.00%)#3,355 |
| 90. | Villanova | 4 | 4,990 (0.08%)#90 | 654,614 (0.00%)#3,424 |
| 91. | Patton Borough | 4 | 4,990 (0.08%)#91 | 654,614 (0.00%)#3,448 |
| 92. | Elizabethville Borough | 4 | 4,990 (0.08%)#92 | 654,614 (0.00%)#3,455 |
| 93. | University Of Pittsburgh Johnstown | 4 | 4,990 (0.08%)#93 | 654,614 (0.00%)#3,458 |
| 94. | Palo Alto Borough | 4 | 4,990 (0.08%)#94 | 654,614 (0.00%)#3,474 |
| 95. | Cresson Borough | 3 | 4,990 (0.06%)#95 | 654,614 (0.00%)#3,579 |
| 96. | South Renovo Borough | 3 | 4,990 (0.06%)#96 | 654,614 (0.00%)#3,633 |
| 97. | Avis Borough | 2 | 4,990 (0.04%)#97 | 654,614 (0.00%)#3,706 |
| 98. | Rossiter | 2 | 4,990 (0.04%)#98 | 654,614 (0.00%)#3,737 |
| 99. | Saltillo Borough | 2 | 4,990 (0.04%)#99 | 654,614 (0.00%)#3,748 |
| 100. | Easton | 1 | 4,990 (0.02%)#100 | 654,614 (0.00%)#3,792 |
1
2Common Questions
What are the Top 10 Cities with the Largest Native Hawaiian Community in Pennsylvania?
Top 10 Cities with the Largest Native Hawaiian Community in Pennsylvania are:
#1
738
#2
187
#3
110
#4
89
#5
83
#6
69
#7
69
#8
68
#9
55
#10
51
What city has the Largest Native Hawaiian Community in Pennsylvania?
Philadelphia has the Largest Native Hawaiian Community in Pennsylvania with 738.
What is the Total Native Hawaiian Population in the State of Pennsylvania?
Total Native Hawaiian Population in Pennsylvania is 4,990.
What is the Total Native Hawaiian Population in the United States?
Total Native Hawaiian Population in the United States is 654,614.