Cities with the Most Immigrants from South Central Asia in Oklahoma
RELATED REPORTS & OPTIONS
South Central Asia
Oklahoma
Compare Cities
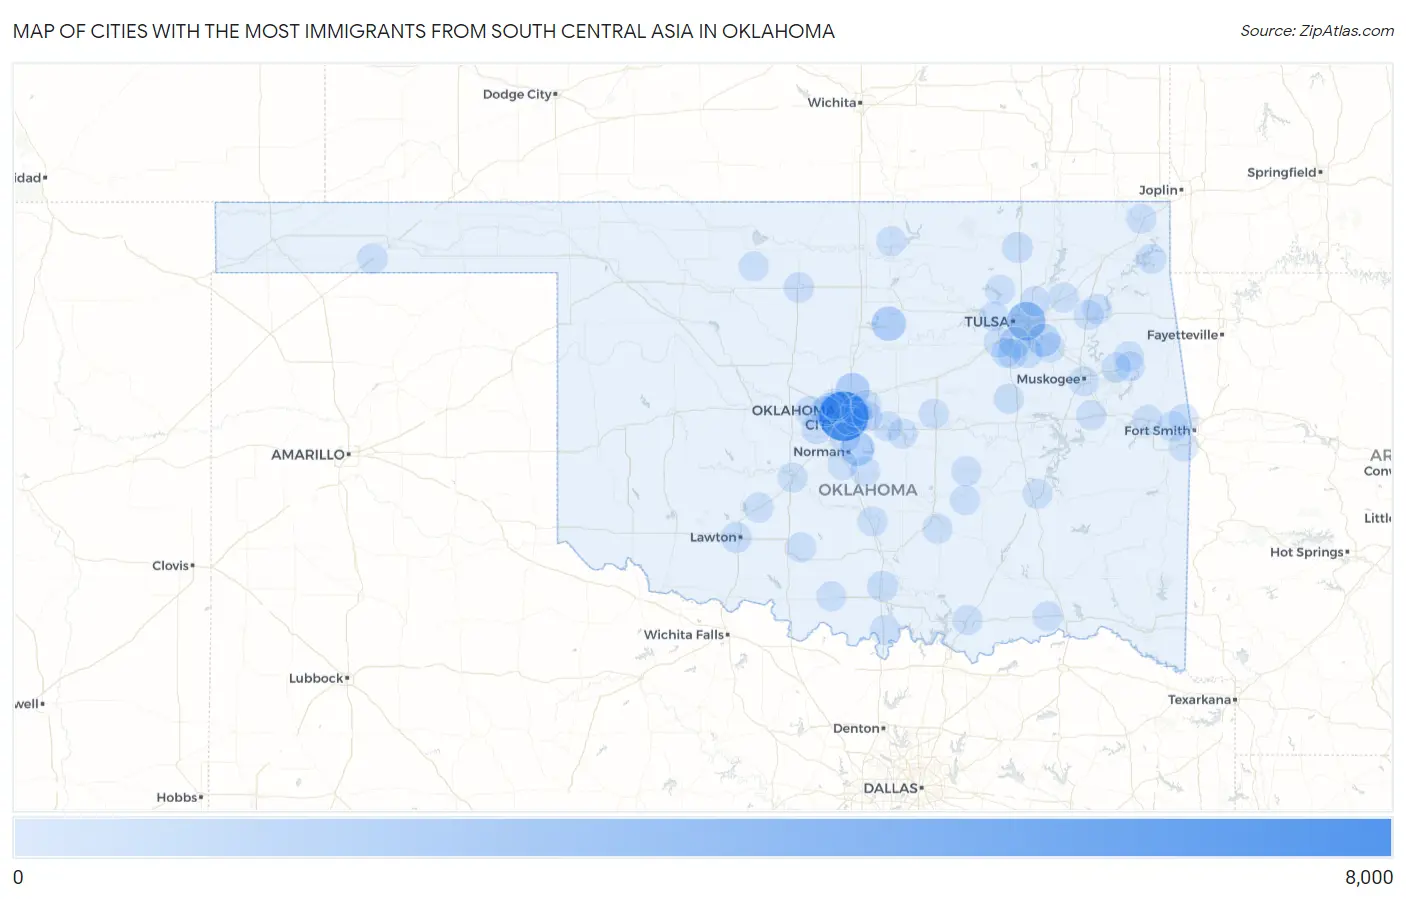
Map of Cities with the Most Immigrants from South Central Asia in Oklahoma
0
8,000
Cities with the Most Immigrants from South Central Asia in Oklahoma
| City | South Central Asia | vs State | vs National | |
| 1. | Oklahoma City | 6,316 | 17,100(36.94%)#1 | 4,330,976(0.15%)#73 |
| 2. | Tulsa | 2,633 | 17,100(15.40%)#2 | 4,330,976(0.06%)#240 |
| 3. | Stillwater | 1,311 | 17,100(7.67%)#3 | 4,330,976(0.03%)#497 |
| 4. | Norman | 1,273 | 17,100(7.44%)#4 | 4,330,976(0.03%)#510 |
| 5. | Edmond | 1,267 | 17,100(7.41%)#5 | 4,330,976(0.03%)#512 |
| 6. | Broken Arrow | 843 | 17,100(4.93%)#6 | 4,330,976(0.02%)#779 |
| 7. | Jenks | 386 | 17,100(2.26%)#7 | 4,330,976(0.01%)#1,329 |
| 8. | Bixby | 301 | 17,100(1.76%)#8 | 4,330,976(0.01%)#1,561 |
| 9. | Bartlesville | 256 | 17,100(1.50%)#9 | 4,330,976(0.01%)#1,730 |
| 10. | Lawton | 239 | 17,100(1.40%)#10 | 4,330,976(0.01%)#1,807 |
| 11. | Ardmore | 229 | 17,100(1.34%)#11 | 4,330,976(0.01%)#1,843 |
| 12. | Warr Acres | 207 | 17,100(1.21%)#12 | 4,330,976(0.00%)#1,963 |
| 13. | Enid | 150 | 17,100(0.88%)#13 | 4,330,976(0.00%)#2,330 |
| 14. | Yukon | 134 | 17,100(0.78%)#14 | 4,330,976(0.00%)#2,446 |
| 15. | Midwest City | 96 | 17,100(0.56%)#15 | 4,330,976(0.00%)#2,875 |
| 16. | Moore | 86 | 17,100(0.50%)#16 | 4,330,976(0.00%)#3,032 |
| 17. | Owasso | 74 | 17,100(0.43%)#17 | 4,330,976(0.00%)#3,210 |
| 18. | Mustang | 74 | 17,100(0.43%)#18 | 4,330,976(0.00%)#3,217 |
| 19. | Glenpool | 74 | 17,100(0.43%)#19 | 4,330,976(0.00%)#3,220 |
| 20. | Okmulgee | 58 | 17,100(0.34%)#20 | 4,330,976(0.00%)#3,556 |
| 21. | Muldrow | 54 | 17,100(0.32%)#21 | 4,330,976(0.00%)#3,654 |
| 22. | Muskogee | 52 | 17,100(0.30%)#22 | 4,330,976(0.00%)#3,681 |
| 23. | Skiatook | 49 | 17,100(0.29%)#23 | 4,330,976(0.00%)#3,786 |
| 24. | Sapulpa | 38 | 17,100(0.22%)#24 | 4,330,976(0.00%)#4,106 |
| 25. | Grove | 36 | 17,100(0.21%)#25 | 4,330,976(0.00%)#4,190 |
| 26. | Del City | 35 | 17,100(0.20%)#26 | 4,330,976(0.00%)#4,211 |
| 27. | Ada | 33 | 17,100(0.19%)#27 | 4,330,976(0.00%)#4,294 |
| 28. | Shawnee | 31 | 17,100(0.18%)#28 | 4,330,976(0.00%)#4,374 |
| 29. | Spencer | 27 | 17,100(0.16%)#29 | 4,330,976(0.00%)#4,599 |
| 30. | Durant | 22 | 17,100(0.13%)#30 | 4,330,976(0.00%)#4,890 |
| 31. | Pocola | 22 | 17,100(0.13%)#31 | 4,330,976(0.00%)#4,914 |
| 32. | Duncan | 21 | 17,100(0.12%)#32 | 4,330,976(0.00%)#4,949 |
| 33. | Tahlequah | 21 | 17,100(0.12%)#33 | 4,330,976(0.00%)#4,954 |
| 34. | The Village | 20 | 17,100(0.12%)#34 | 4,330,976(0.00%)#5,016 |
| 35. | Ponca City | 19 | 17,100(0.11%)#35 | 4,330,976(0.00%)#5,065 |
| 36. | Mcloud | 19 | 17,100(0.11%)#36 | 4,330,976(0.00%)#5,095 |
| 37. | Claremore | 14 | 17,100(0.08%)#37 | 4,330,976(0.00%)#5,425 |
| 38. | Coweta | 14 | 17,100(0.08%)#38 | 4,330,976(0.00%)#5,438 |
| 39. | Park Hill | 12 | 17,100(0.07%)#39 | 4,330,976(0.00%)#5,672 |
| 40. | Mcalester | 11 | 17,100(0.06%)#40 | 4,330,976(0.00%)#5,721 |
| 41. | Helena | 11 | 17,100(0.06%)#41 | 4,330,976(0.00%)#5,795 |
| 42. | Slaughterville | 9 | 17,100(0.05%)#42 | 4,330,976(0.00%)#6,006 |
| 43. | Nichols Hills | 9 | 17,100(0.05%)#43 | 4,330,976(0.00%)#6,010 |
| 44. | Pauls Valley | 8 | 17,100(0.05%)#44 | 4,330,976(0.00%)#6,121 |
| 45. | Prague | 8 | 17,100(0.05%)#45 | 4,330,976(0.00%)#6,170 |
| 46. | Fletcher | 8 | 17,100(0.05%)#46 | 4,330,976(0.00%)#6,182 |
| 47. | Choctaw | 7 | 17,100(0.04%)#47 | 4,330,976(0.00%)#6,217 |
| 48. | Sportsmen Acres | 7 | 17,100(0.04%)#48 | 4,330,976(0.00%)#6,335 |
| 49. | Sallisaw | 6 | 17,100(0.04%)#49 | 4,330,976(0.00%)#6,358 |
| 50. | Goldsby | 6 | 17,100(0.04%)#50 | 4,330,976(0.00%)#6,386 |
| 51. | Remy | 6 | 17,100(0.04%)#51 | 4,330,976(0.00%)#6,444 |
| 52. | Jones | 5 | 17,100(0.03%)#52 | 4,330,976(0.00%)#6,505 |
| 53. | Marietta | 5 | 17,100(0.03%)#53 | 4,330,976(0.00%)#6,507 |
| 54. | Kiefer | 5 | 17,100(0.03%)#54 | 4,330,976(0.00%)#6,519 |
| 55. | Chouteau | 5 | 17,100(0.03%)#55 | 4,330,976(0.00%)#6,527 |
| 56. | Bethany | 4 | 17,100(0.02%)#56 | 4,330,976(0.00%)#6,595 |
| 57. | Sand Springs | 4 | 17,100(0.02%)#57 | 4,330,976(0.00%)#6,597 |
| 58. | Chickasha | 4 | 17,100(0.02%)#58 | 4,330,976(0.00%)#6,600 |
| 59. | Holdenville | 4 | 17,100(0.02%)#59 | 4,330,976(0.00%)#6,624 |
| 60. | Warner | 4 | 17,100(0.02%)#60 | 4,330,976(0.00%)#6,672 |
| 61. | Woodall | 4 | 17,100(0.02%)#61 | 4,330,976(0.00%)#6,690 |
| 62. | Goodwell | 4 | 17,100(0.02%)#62 | 4,330,976(0.00%)#6,695 |
| 63. | Soper | 3 | 17,100(0.02%)#63 | 4,330,976(0.00%)#6,862 |
| 64. | Miami | 2 | 17,100(0.01%)#64 | 4,330,976(0.00%)#6,879 |
| 65. | Allen | 1 | 17,100(0.01%)#65 | 4,330,976(0.00%)#7,101 |
| 66. | Ringling | 1 | 17,100(0.01%)#66 | 4,330,976(0.00%)#7,104 |
Common Questions
What are the Top 10 Cities with the Most Immigrants from South Central Asia in Oklahoma?
Top 10 Cities with the Most Immigrants from South Central Asia in Oklahoma are:
#1
6,316
#2
2,633
#3
1,311
#4
1,273
#5
1,267
#6
843
#7
386
#8
301
#9
256
#10
239
What city has the Most Immigrants from South Central Asia in Oklahoma?
Oklahoma City has the Most Immigrants from South Central Asia in Oklahoma with 6,316.
What is the Total Immigrants from South Central Asia in the State of Oklahoma?
Total Immigrants from South Central Asia in Oklahoma is 17,100.
What is the Total Immigrants from South Central Asia in the United States?
Total Immigrants from South Central Asia in the United States is 4,330,976.