Cities with the Most Immigrants from South Central Asia in Pennsylvania
RELATED REPORTS & OPTIONS
South Central Asia
Pennsylvania
Compare Cities
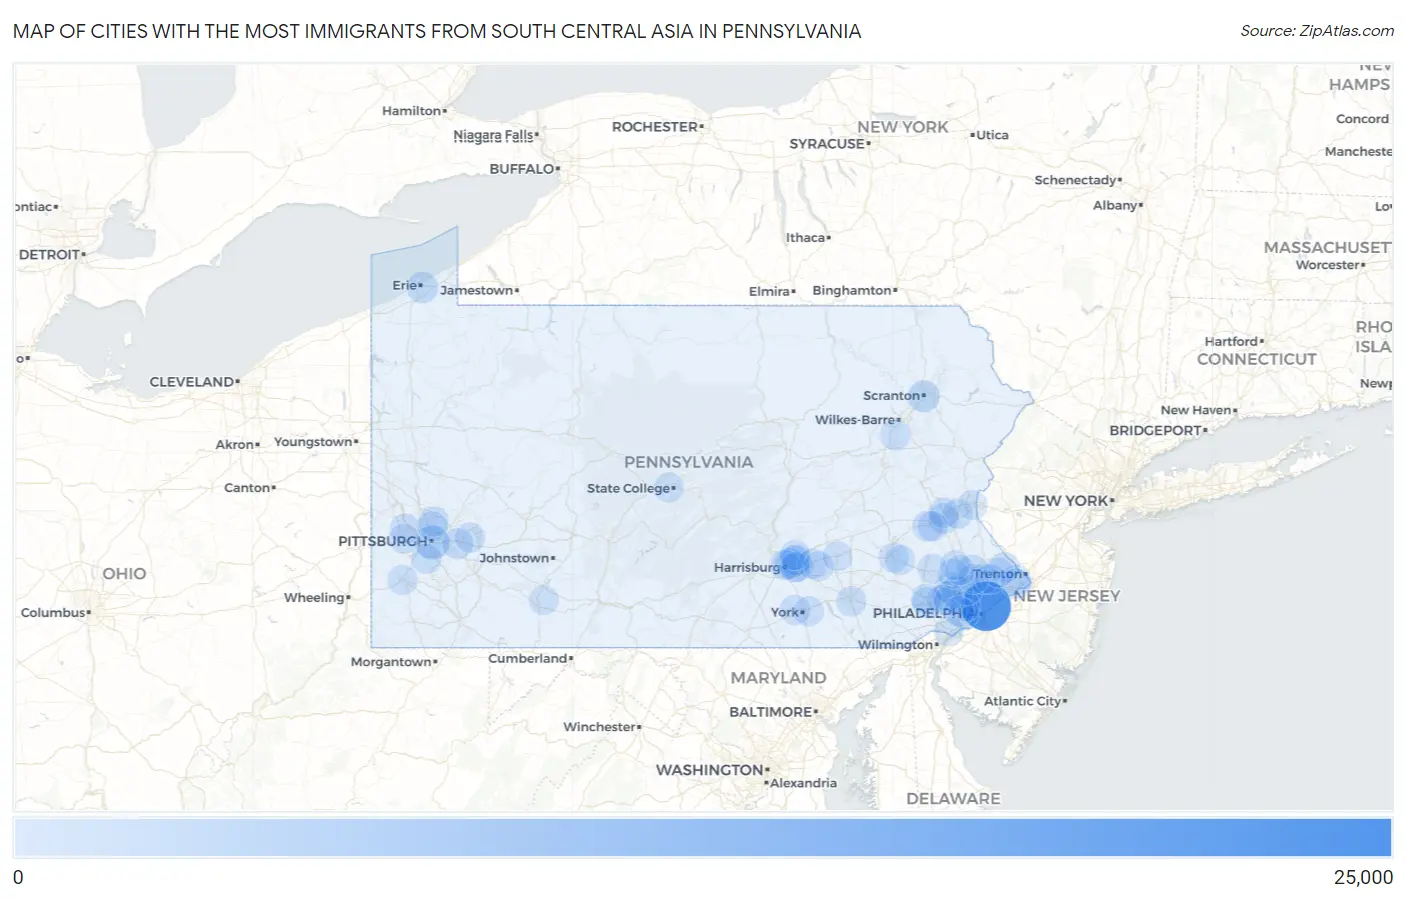
Map of Cities with the Most Immigrants from South Central Asia in Pennsylvania
0
25,000
Cities with the Most Immigrants from South Central Asia in Pennsylvania
| City | South Central Asia | vs State | vs National | |
| 1. | Philadelphia | 22,762 | 149,233(15.25%)#1 | 4,330,976(0.53%)#17 |
| 2. | Pittsburgh | 4,418 | 149,233(2.96%)#2 | 4,330,976(0.10%)#126 |
| 3. | King Of Prussia | 2,826 | 149,233(1.89%)#3 | 4,330,976(0.07%)#225 |
| 4. | Scranton | 2,081 | 149,233(1.39%)#4 | 4,330,976(0.05%)#312 |
| 5. | Erie | 1,600 | 149,233(1.07%)#5 | 4,330,976(0.04%)#413 |
| 6. | Baldwin Borough | 1,407 | 149,233(0.94%)#6 | 4,330,976(0.03%)#466 |
| 7. | Whitehall Borough | 1,309 | 149,233(0.88%)#7 | 4,330,976(0.03%)#498 |
| 8. | Lansdale Borough | 1,177 | 149,233(0.79%)#8 | 4,330,976(0.03%)#550 |
| 9. | Exton | 1,152 | 149,233(0.77%)#9 | 4,330,976(0.03%)#565 |
| 10. | Frazer | 1,078 | 149,233(0.72%)#10 | 4,330,976(0.02%)#614 |
| 11. | Monroeville | 1,056 | 149,233(0.71%)#11 | 4,330,976(0.02%)#627 |
| 12. | Audubon | 1,056 | 149,233(0.71%)#12 | 4,330,976(0.02%)#628 |
| 13. | State College Borough | 1,007 | 149,233(0.67%)#13 | 4,330,976(0.02%)#669 |
| 14. | Colonial Park | 982 | 149,233(0.66%)#14 | 4,330,976(0.02%)#683 |
| 15. | Franklin Park Borough | 871 | 149,233(0.58%)#15 | 4,330,976(0.02%)#760 |
| 16. | Montgomeryville | 862 | 149,233(0.58%)#16 | 4,330,976(0.02%)#766 |
| 17. | Rutherford | 818 | 149,233(0.55%)#17 | 4,330,976(0.02%)#804 |
| 18. | Breinigsville | 799 | 149,233(0.54%)#18 | 4,330,976(0.02%)#822 |
| 19. | Progress | 791 | 149,233(0.53%)#19 | 4,330,976(0.02%)#826 |
| 20. | Allentown | 722 | 149,233(0.48%)#20 | 4,330,976(0.02%)#888 |
| 21. | Paxtonia | 618 | 149,233(0.41%)#21 | 4,330,976(0.01%)#995 |
| 22. | Chesterbrook | 598 | 149,233(0.40%)#22 | 4,330,976(0.01%)#1,020 |
| 23. | Millbourne Borough | 503 | 149,233(0.34%)#23 | 4,330,976(0.01%)#1,141 |
| 24. | Paoli | 484 | 149,233(0.32%)#24 | 4,330,976(0.01%)#1,172 |
| 25. | Hatfield Borough | 457 | 149,233(0.31%)#25 | 4,330,976(0.01%)#1,202 |
| 26. | Castle Shannon Borough | 404 | 149,233(0.27%)#26 | 4,330,976(0.01%)#1,282 |
| 27. | Harrisburg | 389 | 149,233(0.26%)#27 | 4,330,976(0.01%)#1,320 |
| 28. | Fairless Hills | 370 | 149,233(0.25%)#28 | 4,330,976(0.01%)#1,373 |
| 29. | Norristown Borough | 366 | 149,233(0.25%)#29 | 4,330,976(0.01%)#1,380 |
| 30. | Mountain Top | 360 | 149,233(0.24%)#30 | 4,330,976(0.01%)#1,395 |
| 31. | Middletown Borough | 360 | 149,233(0.24%)#31 | 4,330,976(0.01%)#1,396 |
| 32. | Carnot Moon | 357 | 149,233(0.24%)#32 | 4,330,976(0.01%)#1,409 |
| 33. | Downingtown Borough | 351 | 149,233(0.24%)#33 | 4,330,976(0.01%)#1,425 |
| 34. | Murrysville | 348 | 149,233(0.23%)#34 | 4,330,976(0.01%)#1,439 |
| 35. | Newtown Grant | 346 | 149,233(0.23%)#35 | 4,330,976(0.01%)#1,444 |
| 36. | Fullerton | 338 | 149,233(0.23%)#36 | 4,330,976(0.01%)#1,468 |
| 37. | Drexel Hill | 337 | 149,233(0.23%)#37 | 4,330,976(0.01%)#1,470 |
| 38. | Dunmore Borough | 337 | 149,233(0.23%)#38 | 4,330,976(0.01%)#1,472 |
| 39. | Hershey | 322 | 149,233(0.22%)#39 | 4,330,976(0.01%)#1,510 |
| 40. | Bethlehem | 304 | 149,233(0.20%)#40 | 4,330,976(0.01%)#1,546 |
| 41. | Lawnton | 302 | 149,233(0.20%)#41 | 4,330,976(0.01%)#1,557 |
| 42. | Pleasant Hills Borough | 296 | 149,233(0.20%)#42 | 4,330,976(0.01%)#1,578 |
| 43. | Lancaster | 294 | 149,233(0.20%)#43 | 4,330,976(0.01%)#1,581 |
| 44. | Ancient Oaks | 287 | 149,233(0.19%)#44 | 4,330,976(0.01%)#1,612 |
| 45. | Camp Hill Borough | 260 | 149,233(0.17%)#45 | 4,330,976(0.01%)#1,713 |
| 46. | Ardmore | 256 | 149,233(0.17%)#46 | 4,330,976(0.01%)#1,734 |
| 47. | Shiloh | 252 | 149,233(0.17%)#47 | 4,330,976(0.01%)#1,752 |
| 48. | Millersville Borough | 252 | 149,233(0.17%)#48 | 4,330,976(0.01%)#1,754 |
| 49. | Allison Park | 241 | 149,233(0.16%)#49 | 4,330,976(0.01%)#1,797 |
| 50. | Lionville | 241 | 149,233(0.16%)#50 | 4,330,976(0.01%)#1,803 |
| 51. | Jefferson Hills Borough | 234 | 149,233(0.16%)#51 | 4,330,976(0.01%)#1,822 |
| 52. | Horsham | 224 | 149,233(0.15%)#52 | 4,330,976(0.01%)#1,867 |
| 53. | Plymouth Meeting | 223 | 149,233(0.15%)#53 | 4,330,976(0.01%)#1,873 |
| 54. | Brentwood Borough | 216 | 149,233(0.14%)#54 | 4,330,976(0.00%)#1,909 |
| 55. | Bethel Park | 214 | 149,233(0.14%)#55 | 4,330,976(0.00%)#1,924 |
| 56. | Indiana Borough | 204 | 149,233(0.14%)#56 | 4,330,976(0.00%)#1,977 |
| 57. | Swissvale Borough | 201 | 149,233(0.13%)#57 | 4,330,976(0.00%)#1,990 |
| 58. | Wayne | 190 | 149,233(0.13%)#58 | 4,330,976(0.00%)#2,059 |
| 59. | Spring House | 181 | 149,233(0.12%)#59 | 4,330,976(0.00%)#2,103 |
| 60. | Park Forest Village | 179 | 149,233(0.12%)#60 | 4,330,976(0.00%)#2,115 |
| 61. | Linglestown | 176 | 149,233(0.12%)#61 | 4,330,976(0.00%)#2,138 |
| 62. | Danville Borough | 174 | 149,233(0.12%)#62 | 4,330,976(0.00%)#2,163 |
| 63. | Broomall | 173 | 149,233(0.12%)#63 | 4,330,976(0.00%)#2,173 |
| 64. | Reading | 172 | 149,233(0.12%)#64 | 4,330,976(0.00%)#2,176 |
| 65. | Levittown | 170 | 149,233(0.11%)#65 | 4,330,976(0.00%)#2,191 |
| 66. | Skippack | 170 | 149,233(0.11%)#66 | 4,330,976(0.00%)#2,194 |
| 67. | Malvern Borough | 169 | 149,233(0.11%)#67 | 4,330,976(0.00%)#2,206 |
| 68. | Phoenixville Borough | 168 | 149,233(0.11%)#68 | 4,330,976(0.00%)#2,207 |
| 69. | Carnegie Borough | 167 | 149,233(0.11%)#69 | 4,330,976(0.00%)#2,213 |
| 70. | Eagleville Cdp Montgomery County | 161 | 149,233(0.11%)#70 | 4,330,976(0.00%)#2,250 |
| 71. | Enlow | 161 | 149,233(0.11%)#71 | 4,330,976(0.00%)#2,253 |
| 72. | Sanatoga | 160 | 149,233(0.11%)#72 | 4,330,976(0.00%)#2,255 |
| 73. | Chalfont Borough | 158 | 149,233(0.11%)#73 | 4,330,976(0.00%)#2,272 |
| 74. | Wormleysburg Borough | 158 | 149,233(0.11%)#74 | 4,330,976(0.00%)#2,273 |
| 75. | Sayre Borough | 155 | 149,233(0.10%)#75 | 4,330,976(0.00%)#2,298 |
| 76. | Plum Borough | 154 | 149,233(0.10%)#76 | 4,330,976(0.00%)#2,301 |
| 77. | Sinking Spring Borough | 152 | 149,233(0.10%)#77 | 4,330,976(0.00%)#2,318 |
| 78. | Bala Cynwyd | 151 | 149,233(0.10%)#78 | 4,330,976(0.00%)#2,325 |
| 79. | Green Tree Borough | 149 | 149,233(0.10%)#79 | 4,330,976(0.00%)#2,346 |
| 80. | Reiffton | 148 | 149,233(0.10%)#80 | 4,330,976(0.00%)#2,354 |
| 81. | Harleysville | 145 | 149,233(0.10%)#81 | 4,330,976(0.00%)#2,377 |
| 82. | Campbelltown | 144 | 149,233(0.10%)#82 | 4,330,976(0.00%)#2,385 |
| 83. | Mcadoo Borough | 138 | 149,233(0.09%)#83 | 4,330,976(0.00%)#2,421 |
| 84. | Washington | 137 | 149,233(0.09%)#84 | 4,330,976(0.00%)#2,429 |
| 85. | Warminster Heights | 135 | 149,233(0.09%)#85 | 4,330,976(0.00%)#2,444 |
| 86. | Carlisle Borough | 134 | 149,233(0.09%)#86 | 4,330,976(0.00%)#2,447 |
| 87. | Chestnut Hill | 132 | 149,233(0.09%)#87 | 4,330,976(0.00%)#2,471 |
| 88. | Glenshaw | 129 | 149,233(0.09%)#88 | 4,330,976(0.00%)#2,498 |
| 89. | Kulpsville | 129 | 149,233(0.09%)#89 | 4,330,976(0.00%)#2,499 |
| 90. | Matamoras Borough | 129 | 149,233(0.09%)#90 | 4,330,976(0.00%)#2,501 |
| 91. | Richboro | 126 | 149,233(0.08%)#91 | 4,330,976(0.00%)#2,529 |
| 92. | Easton | 125 | 149,233(0.08%)#92 | 4,330,976(0.00%)#2,533 |
| 93. | Friedens | 125 | 149,233(0.08%)#93 | 4,330,976(0.00%)#2,541 |
| 94. | East Lansdowne Borough | 122 | 149,233(0.08%)#94 | 4,330,976(0.00%)#2,562 |
| 95. | East York | 120 | 149,233(0.08%)#95 | 4,330,976(0.00%)#2,584 |
| 96. | Berwyn | 120 | 149,233(0.08%)#96 | 4,330,976(0.00%)#2,586 |
| 97. | Boothwyn | 118 | 149,233(0.08%)#97 | 4,330,976(0.00%)#2,615 |
| 98. | Lebanon | 117 | 149,233(0.08%)#98 | 4,330,976(0.00%)#2,621 |
| 99. | Wilson Borough | 116 | 149,233(0.08%)#99 | 4,330,976(0.00%)#2,631 |
| 100. | Palmyra Borough | 116 | 149,233(0.08%)#100 | 4,330,976(0.00%)#2,632 |
Common Questions
What are the Top 10 Cities with the Most Immigrants from South Central Asia in Pennsylvania?
Top 10 Cities with the Most Immigrants from South Central Asia in Pennsylvania are:
#1
22,762
#2
4,418
#3
2,826
#4
2,081
#5
1,600
#6
1,152
#7
1,056
#8
1,056
#9
982
#10
862
What city has the Most Immigrants from South Central Asia in Pennsylvania?
Philadelphia has the Most Immigrants from South Central Asia in Pennsylvania with 22,762.
What is the Total Immigrants from South Central Asia in the State of Pennsylvania?
Total Immigrants from South Central Asia in Pennsylvania is 149,233.
What is the Total Immigrants from South Central Asia in the United States?
Total Immigrants from South Central Asia in the United States is 4,330,976.