Cities with the Most Immigrants from South Central Asia in Georgia
RELATED REPORTS & OPTIONS
South Central Asia
Georgia
Compare Cities
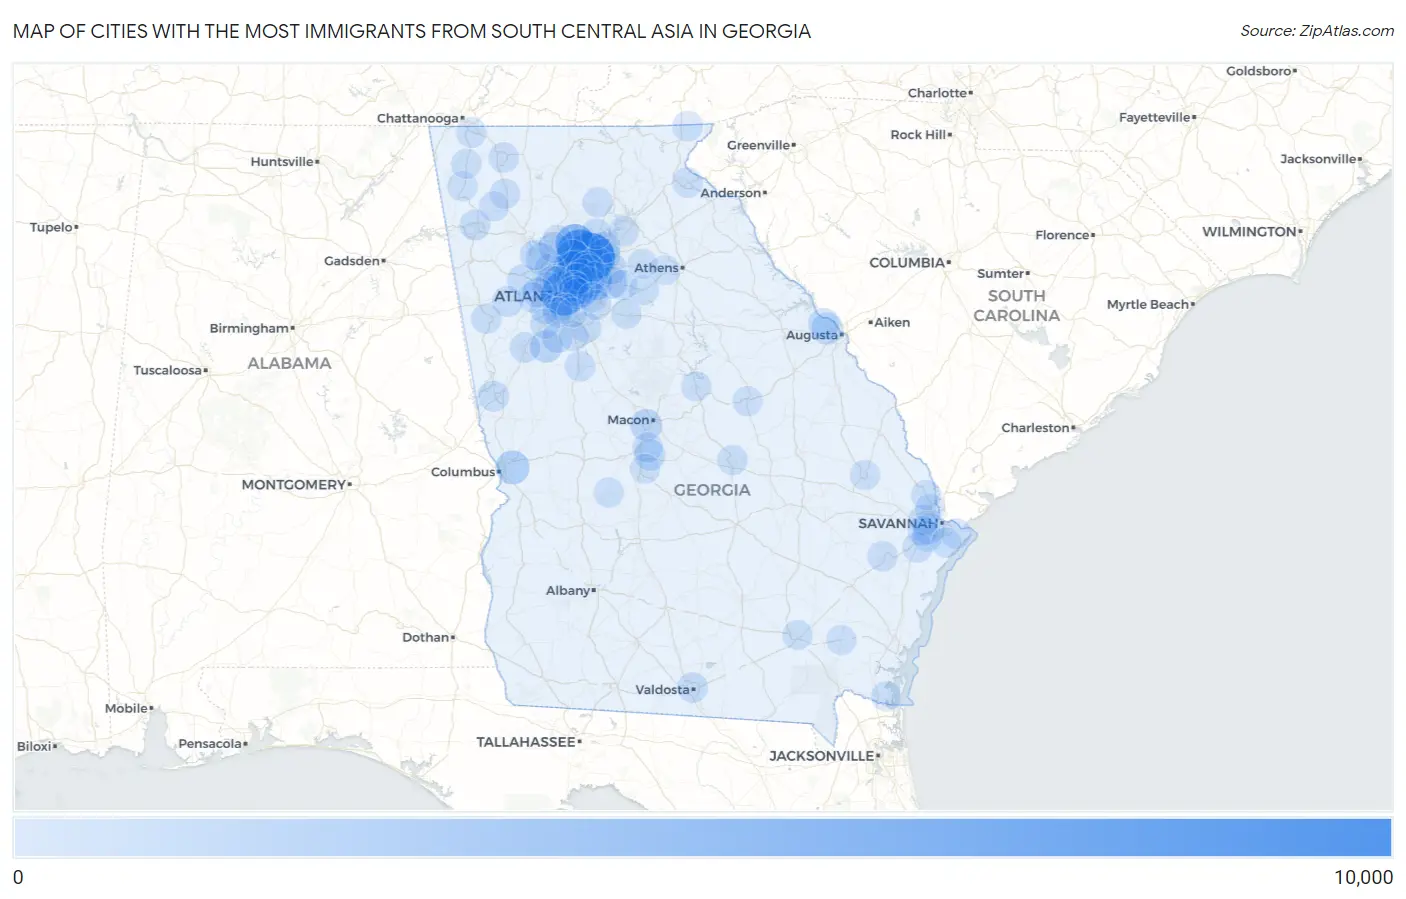
Map of Cities with the Most Immigrants from South Central Asia in Georgia
0
10,000
Cities with the Most Immigrants from South Central Asia in Georgia
| City | South Central Asia | vs State | vs National | |
| 1. | Johns Creek | 9,553 | 141,735(6.74%)#1 | 4,330,976(0.22%)#42 |
| 2. | Alpharetta | 7,729 | 141,735(5.45%)#2 | 4,330,976(0.18%)#54 |
| 3. | Atlanta | 6,601 | 141,735(4.66%)#3 | 4,330,976(0.15%)#68 |
| 4. | Milton | 4,499 | 141,735(3.17%)#4 | 4,330,976(0.10%)#120 |
| 5. | Dunwoody | 4,371 | 141,735(3.08%)#5 | 4,330,976(0.10%)#128 |
| 6. | Sandy Springs | 3,771 | 141,735(2.66%)#6 | 4,330,976(0.09%)#160 |
| 7. | Scottdale | 1,976 | 141,735(1.39%)#7 | 4,330,976(0.05%)#332 |
| 8. | Columbus | 1,827 | 141,735(1.29%)#8 | 4,330,976(0.04%)#364 |
| 9. | Brookhaven | 1,626 | 141,735(1.15%)#9 | 4,330,976(0.04%)#408 |
| 10. | Roswell | 1,422 | 141,735(1.00%)#10 | 4,330,976(0.03%)#457 |
| 11. | Smyrna | 1,419 | 141,735(1.00%)#11 | 4,330,976(0.03%)#459 |
| 12. | Clarkston | 1,272 | 141,735(0.90%)#12 | 4,330,976(0.03%)#511 |
| 13. | Mountain Park | 1,259 | 141,735(0.89%)#13 | 4,330,976(0.03%)#517 |
| 14. | Suwanee | 1,206 | 141,735(0.85%)#14 | 4,330,976(0.03%)#537 |
| 15. | Peachtree City | 1,174 | 141,735(0.83%)#15 | 4,330,976(0.03%)#552 |
| 16. | Athens-Clarke County Unified Government (Balance) | 1,132 | 141,735(0.80%)#16 | 4,330,976(0.03%)#575 |
| 17. | Duluth | 1,122 | 141,735(0.79%)#17 | 4,330,976(0.03%)#590 |
| 18. | Peachtree Corners | 927 | 141,735(0.65%)#18 | 4,330,976(0.02%)#720 |
| 19. | Macon Bibb County | 921 | 141,735(0.65%)#19 | 4,330,976(0.02%)#725 |
| 20. | Snellville | 884 | 141,735(0.62%)#20 | 4,330,976(0.02%)#752 |
| 21. | Augusta-Richmond County Consolidated Government (Balance) | 848 | 141,735(0.60%)#21 | 4,330,976(0.02%)#775 |
| 22. | Lilburn | 843 | 141,735(0.59%)#22 | 4,330,976(0.02%)#780 |
| 23. | Martinez | 809 | 141,735(0.57%)#23 | 4,330,976(0.02%)#810 |
| 24. | Kennesaw | 785 | 141,735(0.55%)#24 | 4,330,976(0.02%)#830 |
| 25. | Tucker | 745 | 141,735(0.53%)#25 | 4,330,976(0.02%)#868 |
| 26. | North Decatur | 705 | 141,735(0.50%)#26 | 4,330,976(0.02%)#900 |
| 27. | Doraville | 687 | 141,735(0.48%)#27 | 4,330,976(0.02%)#912 |
| 28. | Lawrenceville | 675 | 141,735(0.48%)#28 | 4,330,976(0.02%)#923 |
| 29. | Evans | 622 | 141,735(0.44%)#29 | 4,330,976(0.01%)#988 |
| 30. | Warner Robins | 583 | 141,735(0.41%)#30 | 4,330,976(0.01%)#1,040 |
| 31. | Sugar Hill | 546 | 141,735(0.39%)#31 | 4,330,976(0.01%)#1,080 |
| 32. | Savannah | 522 | 141,735(0.37%)#32 | 4,330,976(0.01%)#1,109 |
| 33. | Chamblee | 514 | 141,735(0.36%)#33 | 4,330,976(0.01%)#1,122 |
| 34. | Norcross | 484 | 141,735(0.34%)#34 | 4,330,976(0.01%)#1,170 |
| 35. | Stockbridge | 392 | 141,735(0.28%)#35 | 4,330,976(0.01%)#1,316 |
| 36. | Hiram | 375 | 141,735(0.26%)#36 | 4,330,976(0.01%)#1,356 |
| 37. | Rome | 369 | 141,735(0.26%)#37 | 4,330,976(0.01%)#1,374 |
| 38. | Marietta | 368 | 141,735(0.26%)#38 | 4,330,976(0.01%)#1,377 |
| 39. | Lagrange | 366 | 141,735(0.26%)#39 | 4,330,976(0.01%)#1,381 |
| 40. | Woodstock | 355 | 141,735(0.25%)#40 | 4,330,976(0.01%)#1,413 |
| 41. | Mableton | 354 | 141,735(0.25%)#41 | 4,330,976(0.01%)#1,416 |
| 42. | Villa Rica | 337 | 141,735(0.24%)#42 | 4,330,976(0.01%)#1,471 |
| 43. | Fayetteville | 316 | 141,735(0.22%)#43 | 4,330,976(0.01%)#1,521 |
| 44. | Cumming | 294 | 141,735(0.21%)#44 | 4,330,976(0.01%)#1,583 |
| 45. | North Druid Hills | 293 | 141,735(0.21%)#45 | 4,330,976(0.01%)#1,588 |
| 46. | Newnan | 279 | 141,735(0.20%)#46 | 4,330,976(0.01%)#1,643 |
| 47. | Valdosta | 262 | 141,735(0.18%)#47 | 4,330,976(0.01%)#1,699 |
| 48. | Pooler | 245 | 141,735(0.17%)#48 | 4,330,976(0.01%)#1,780 |
| 49. | Acworth | 229 | 141,735(0.16%)#49 | 4,330,976(0.01%)#1,844 |
| 50. | Griffin | 215 | 141,735(0.15%)#50 | 4,330,976(0.00%)#1,915 |
| 51. | Douglasville | 214 | 141,735(0.15%)#51 | 4,330,976(0.00%)#1,923 |
| 52. | South Fulton | 213 | 141,735(0.15%)#52 | 4,330,976(0.00%)#1,928 |
| 53. | Decatur | 206 | 141,735(0.15%)#53 | 4,330,976(0.00%)#1,967 |
| 54. | Fort Oglethorpe | 204 | 141,735(0.14%)#54 | 4,330,976(0.00%)#1,978 |
| 55. | Centerville | 204 | 141,735(0.14%)#55 | 4,330,976(0.00%)#1,979 |
| 56. | Hinesville | 193 | 141,735(0.14%)#56 | 4,330,976(0.00%)#2,037 |
| 57. | Dalton | 164 | 141,735(0.12%)#57 | 4,330,976(0.00%)#2,224 |
| 58. | Dublin | 164 | 141,735(0.12%)#58 | 4,330,976(0.00%)#2,226 |
| 59. | Georgetown | 164 | 141,735(0.12%)#59 | 4,330,976(0.00%)#2,228 |
| 60. | Sky Valley | 149 | 141,735(0.11%)#60 | 4,330,976(0.00%)#2,348 |
| 61. | Carrollton | 143 | 141,735(0.10%)#61 | 4,330,976(0.00%)#2,386 |
| 62. | Richmond Hill | 134 | 141,735(0.09%)#62 | 4,330,976(0.00%)#2,449 |
| 63. | East Point | 128 | 141,735(0.09%)#63 | 4,330,976(0.00%)#2,503 |
| 64. | Vinings | 128 | 141,735(0.09%)#64 | 4,330,976(0.00%)#2,507 |
| 65. | Lithia Springs | 126 | 141,735(0.09%)#65 | 4,330,976(0.00%)#2,526 |
| 66. | Loganville | 124 | 141,735(0.09%)#66 | 4,330,976(0.00%)#2,543 |
| 67. | Druid Hills | 124 | 141,735(0.09%)#67 | 4,330,976(0.00%)#2,547 |
| 68. | Rincon | 117 | 141,735(0.08%)#68 | 4,330,976(0.00%)#2,625 |
| 69. | Monroe | 113 | 141,735(0.08%)#69 | 4,330,976(0.00%)#2,670 |
| 70. | Dawsonville | 102 | 141,735(0.07%)#70 | 4,330,976(0.00%)#2,796 |
| 71. | Calhoun | 95 | 141,735(0.07%)#71 | 4,330,976(0.00%)#2,897 |
| 72. | Toccoa | 87 | 141,735(0.06%)#72 | 4,330,976(0.00%)#3,020 |
| 73. | Deenwood | 87 | 141,735(0.06%)#73 | 4,330,976(0.00%)#3,029 |
| 74. | Wilmington Island | 85 | 141,735(0.06%)#74 | 4,330,976(0.00%)#3,048 |
| 75. | Oxford | 80 | 141,735(0.06%)#75 | 4,330,976(0.00%)#3,125 |
| 76. | Bonanza | 79 | 141,735(0.06%)#76 | 4,330,976(0.00%)#3,148 |
| 77. | Statesboro | 78 | 141,735(0.06%)#77 | 4,330,976(0.00%)#3,155 |
| 78. | Montezuma | 78 | 141,735(0.06%)#78 | 4,330,976(0.00%)#3,164 |
| 79. | Oakwood | 75 | 141,735(0.05%)#79 | 4,330,976(0.00%)#3,204 |
| 80. | Stonecrest | 74 | 141,735(0.05%)#80 | 4,330,976(0.00%)#3,209 |
| 81. | Henderson | 73 | 141,735(0.05%)#81 | 4,330,976(0.00%)#3,247 |
| 82. | College Park | 68 | 141,735(0.05%)#82 | 4,330,976(0.00%)#3,338 |
| 83. | Crescent | 68 | 141,735(0.05%)#83 | 4,330,976(0.00%)#3,347 |
| 84. | Skidaway Island | 66 | 141,735(0.05%)#84 | 4,330,976(0.00%)#3,377 |
| 85. | Hapeville | 63 | 141,735(0.04%)#85 | 4,330,976(0.00%)#3,443 |
| 86. | St Marys | 61 | 141,735(0.04%)#86 | 4,330,976(0.00%)#3,479 |
| 87. | Conley | 61 | 141,735(0.04%)#87 | 4,330,976(0.00%)#3,490 |
| 88. | Holly Springs | 60 | 141,735(0.04%)#88 | 4,330,976(0.00%)#3,495 |
| 89. | Port Wentworth | 60 | 141,735(0.04%)#89 | 4,330,976(0.00%)#3,501 |
| 90. | Sandersville | 60 | 141,735(0.04%)#90 | 4,330,976(0.00%)#3,509 |
| 91. | Redan | 56 | 141,735(0.04%)#91 | 4,330,976(0.00%)#3,590 |
| 92. | Trion | 55 | 141,735(0.04%)#92 | 4,330,976(0.00%)#3,630 |
| 93. | Lafayette | 53 | 141,735(0.04%)#93 | 4,330,976(0.00%)#3,668 |
| 94. | Nahunta | 53 | 141,735(0.04%)#94 | 4,330,976(0.00%)#3,675 |
| 95. | Bogart | 51 | 141,735(0.04%)#95 | 4,330,976(0.00%)#3,744 |
| 96. | Milledgeville | 48 | 141,735(0.03%)#96 | 4,330,976(0.00%)#3,810 |
| 97. | Plainville | 47 | 141,735(0.03%)#97 | 4,330,976(0.00%)#3,865 |
| 98. | Fairburn | 46 | 141,735(0.03%)#98 | 4,330,976(0.00%)#3,876 |
| 99. | Winder | 45 | 141,735(0.03%)#99 | 4,330,976(0.00%)#3,900 |
| 100. | Perry | 42 | 141,735(0.03%)#100 | 4,330,976(0.00%)#3,984 |
Common Questions
What are the Top 10 Cities with the Most Immigrants from South Central Asia in Georgia?
Top 10 Cities with the Most Immigrants from South Central Asia in Georgia are:
#1
9,553
#2
7,729
#3
6,601
#4
4,499
#5
4,371
#6
3,771
#7
1,976
#8
1,827
#9
1,626
#10
1,422
What city has the Most Immigrants from South Central Asia in Georgia?
Johns Creek has the Most Immigrants from South Central Asia in Georgia with 9,553.
What is the Total Immigrants from South Central Asia in the State of Georgia?
Total Immigrants from South Central Asia in Georgia is 141,735.
What is the Total Immigrants from South Central Asia in the United States?
Total Immigrants from South Central Asia in the United States is 4,330,976.