Cities with the Most Immigrants from South Central Asia in Colorado
RELATED REPORTS & OPTIONS
South Central Asia
Colorado
Compare Cities
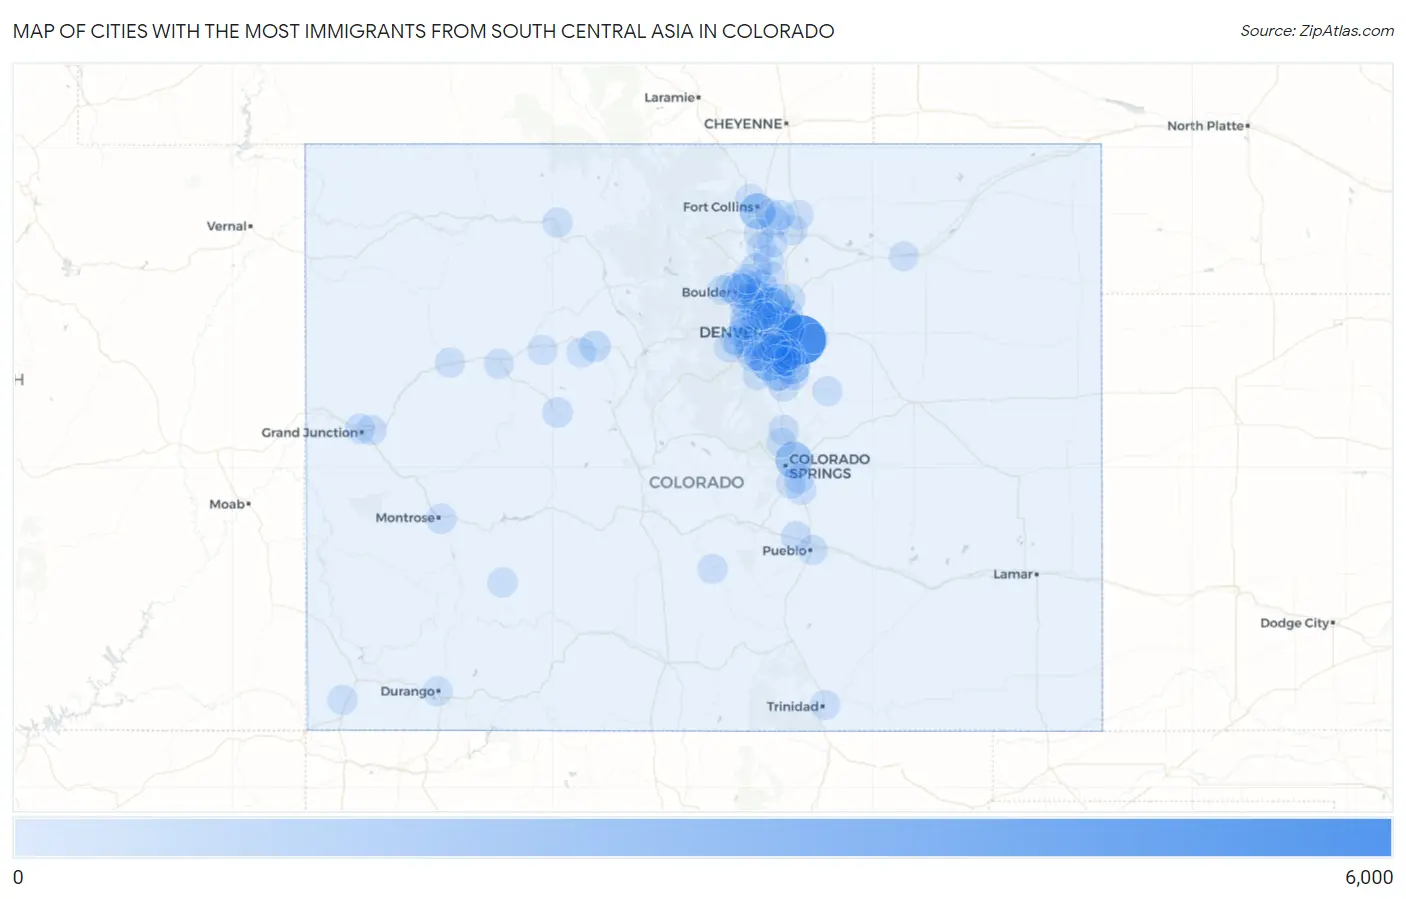
Map of Cities with the Most Immigrants from South Central Asia in Colorado
0
6,000
Cities with the Most Immigrants from South Central Asia in Colorado
| City | South Central Asia | vs State | vs National | |
| 1. | Aurora | 5,348 | 38,562(13.87%)#1 | 4,330,976(0.12%)#92 |
| 2. | Denver | 3,720 | 38,562(9.65%)#2 | 4,330,976(0.09%)#164 |
| 3. | Centennial | 2,099 | 38,562(5.44%)#3 | 4,330,976(0.05%)#308 |
| 4. | Thornton | 1,919 | 38,562(4.98%)#4 | 4,330,976(0.04%)#342 |
| 5. | Highlands Ranch | 1,798 | 38,562(4.66%)#5 | 4,330,976(0.04%)#368 |
| 6. | Colorado Springs | 1,779 | 38,562(4.61%)#6 | 4,330,976(0.04%)#371 |
| 7. | Fort Collins | 1,509 | 38,562(3.91%)#7 | 4,330,976(0.03%)#435 |
| 8. | Broomfield | 1,376 | 38,562(3.57%)#8 | 4,330,976(0.03%)#473 |
| 9. | Parker | 1,321 | 38,562(3.43%)#9 | 4,330,976(0.03%)#492 |
| 10. | Boulder | 1,200 | 38,562(3.11%)#10 | 4,330,976(0.03%)#540 |
| 11. | Lakewood | 1,111 | 38,562(2.88%)#11 | 4,330,976(0.03%)#596 |
| 12. | Westminster | 835 | 38,562(2.17%)#12 | 4,330,976(0.02%)#787 |
| 13. | Greenwood Village | 812 | 38,562(2.11%)#13 | 4,330,976(0.02%)#807 |
| 14. | Superior | 686 | 38,562(1.78%)#14 | 4,330,976(0.02%)#914 |
| 15. | Erie | 648 | 38,562(1.68%)#15 | 4,330,976(0.01%)#959 |
| 16. | Arvada | 645 | 38,562(1.67%)#16 | 4,330,976(0.01%)#962 |
| 17. | Lone Tree | 572 | 38,562(1.48%)#17 | 4,330,976(0.01%)#1,053 |
| 18. | Four Square Mile | 452 | 38,562(1.17%)#18 | 4,330,976(0.01%)#1,207 |
| 19. | Inverness | 431 | 38,562(1.12%)#19 | 4,330,976(0.01%)#1,245 |
| 20. | Longmont | 402 | 38,562(1.04%)#20 | 4,330,976(0.01%)#1,287 |
| 21. | Commerce City | 381 | 38,562(0.99%)#21 | 4,330,976(0.01%)#1,335 |
| 22. | Avon | 365 | 38,562(0.95%)#22 | 4,330,976(0.01%)#1,385 |
| 23. | Cherry Creek | 351 | 38,562(0.91%)#23 | 4,330,976(0.01%)#1,423 |
| 24. | Littleton | 349 | 38,562(0.91%)#24 | 4,330,976(0.01%)#1,431 |
| 25. | Sierra Ridge | 331 | 38,562(0.86%)#25 | 4,330,976(0.01%)#1,492 |
| 26. | Castle Pines | 290 | 38,562(0.75%)#26 | 4,330,976(0.01%)#1,600 |
| 27. | Lafayette | 257 | 38,562(0.67%)#27 | 4,330,976(0.01%)#1,726 |
| 28. | Northglenn | 212 | 38,562(0.55%)#28 | 4,330,976(0.00%)#1,935 |
| 29. | Castle Rock | 210 | 38,562(0.54%)#29 | 4,330,976(0.00%)#1,943 |
| 30. | Sheridan | 169 | 38,562(0.44%)#30 | 4,330,976(0.00%)#2,203 |
| 31. | Windsor | 167 | 38,562(0.43%)#31 | 4,330,976(0.00%)#2,210 |
| 32. | Stepping Stone | 162 | 38,562(0.42%)#32 | 4,330,976(0.00%)#2,242 |
| 33. | Meridian | 147 | 38,562(0.38%)#33 | 4,330,976(0.00%)#2,361 |
| 34. | Louisville | 137 | 38,562(0.36%)#34 | 4,330,976(0.00%)#2,426 |
| 35. | The Pinery | 132 | 38,562(0.34%)#35 | 4,330,976(0.00%)#2,470 |
| 36. | Frederick | 125 | 38,562(0.32%)#36 | 4,330,976(0.00%)#2,535 |
| 37. | Gunbarrel | 114 | 38,562(0.30%)#37 | 4,330,976(0.00%)#2,657 |
| 38. | Monument | 108 | 38,562(0.28%)#38 | 4,330,976(0.00%)#2,720 |
| 39. | Montrose | 106 | 38,562(0.27%)#39 | 4,330,976(0.00%)#2,741 |
| 40. | Greeley | 102 | 38,562(0.26%)#40 | 4,330,976(0.00%)#2,783 |
| 41. | Stonegate | 102 | 38,562(0.26%)#41 | 4,330,976(0.00%)#2,790 |
| 42. | Aspen | 101 | 38,562(0.26%)#42 | 4,330,976(0.00%)#2,811 |
| 43. | Englewood | 93 | 38,562(0.24%)#43 | 4,330,976(0.00%)#2,920 |
| 44. | Clifton | 87 | 38,562(0.23%)#44 | 4,330,976(0.00%)#3,017 |
| 45. | Dakota Ridge | 84 | 38,562(0.22%)#45 | 4,330,976(0.00%)#3,056 |
| 46. | Cherry Hills Village | 84 | 38,562(0.22%)#46 | 4,330,976(0.00%)#3,072 |
| 47. | Sherrelwood | 80 | 38,562(0.21%)#47 | 4,330,976(0.00%)#3,119 |
| 48. | Golden | 79 | 38,562(0.20%)#48 | 4,330,976(0.00%)#3,136 |
| 49. | Dove Valley | 78 | 38,562(0.20%)#49 | 4,330,976(0.00%)#3,162 |
| 50. | Pueblo West | 76 | 38,562(0.20%)#50 | 4,330,976(0.00%)#3,182 |
| 51. | Castle Pines Village | 73 | 38,562(0.19%)#51 | 4,330,976(0.00%)#3,243 |
| 52. | Brighton | 58 | 38,562(0.15%)#52 | 4,330,976(0.00%)#3,543 |
| 53. | Fountain | 58 | 38,562(0.15%)#53 | 4,330,976(0.00%)#3,545 |
| 54. | Pueblo | 57 | 38,562(0.15%)#54 | 4,330,976(0.00%)#3,567 |
| 55. | Ken Caryl | 57 | 38,562(0.15%)#55 | 4,330,976(0.00%)#3,569 |
| 56. | Mead | 49 | 38,562(0.13%)#56 | 4,330,976(0.00%)#3,792 |
| 57. | Grand Junction | 48 | 38,562(0.12%)#57 | 4,330,976(0.00%)#3,803 |
| 58. | Wheat Ridge | 44 | 38,562(0.11%)#58 | 4,330,976(0.00%)#3,924 |
| 59. | Steamboat Springs | 42 | 38,562(0.11%)#59 | 4,330,976(0.00%)#3,989 |
| 60. | Berthoud | 38 | 38,562(0.10%)#60 | 4,330,976(0.00%)#4,113 |
| 61. | Edwards | 36 | 38,562(0.09%)#61 | 4,330,976(0.00%)#4,181 |
| 62. | Loveland | 31 | 38,562(0.08%)#62 | 4,330,976(0.00%)#4,372 |
| 63. | Acres Green | 30 | 38,562(0.08%)#63 | 4,330,976(0.00%)#4,449 |
| 64. | Watkins | 30 | 38,562(0.08%)#64 | 4,330,976(0.00%)#4,458 |
| 65. | Federal Heights | 29 | 38,562(0.08%)#65 | 4,330,976(0.00%)#4,471 |
| 66. | Timnath | 29 | 38,562(0.08%)#66 | 4,330,976(0.00%)#4,480 |
| 67. | Towaoc | 29 | 38,562(0.08%)#67 | 4,330,976(0.00%)#4,507 |
| 68. | Applewood | 28 | 38,562(0.07%)#68 | 4,330,976(0.00%)#4,536 |
| 69. | Foxfield | 25 | 38,562(0.06%)#69 | 4,330,976(0.00%)#4,742 |
| 70. | Idledale | 25 | 38,562(0.06%)#70 | 4,330,976(0.00%)#4,746 |
| 71. | Gypsum | 23 | 38,562(0.06%)#71 | 4,330,976(0.00%)#4,838 |
| 72. | Genesee | 23 | 38,562(0.06%)#72 | 4,330,976(0.00%)#4,857 |
| 73. | Security Widefield | 22 | 38,562(0.06%)#73 | 4,330,976(0.00%)#4,883 |
| 74. | Evergreen | 22 | 38,562(0.06%)#74 | 4,330,976(0.00%)#4,903 |
| 75. | Todd Creek | 20 | 38,562(0.05%)#75 | 4,330,976(0.00%)#5,028 |
| 76. | Roxborough Park | 19 | 38,562(0.05%)#76 | 4,330,976(0.00%)#5,079 |
| 77. | Pine Brook Hill | 19 | 38,562(0.05%)#77 | 4,330,976(0.00%)#5,129 |
| 78. | Eaton | 18 | 38,562(0.05%)#78 | 4,330,976(0.00%)#5,164 |
| 79. | Welby | 17 | 38,562(0.04%)#79 | 4,330,976(0.00%)#5,218 |
| 80. | Fort Carson | 16 | 38,562(0.04%)#80 | 4,330,976(0.00%)#5,289 |
| 81. | Johnstown | 16 | 38,562(0.04%)#81 | 4,330,976(0.00%)#5,292 |
| 82. | Glenwood Springs | 16 | 38,562(0.04%)#82 | 4,330,976(0.00%)#5,305 |
| 83. | Rifle | 12 | 38,562(0.03%)#83 | 4,330,976(0.00%)#5,632 |
| 84. | Fairmount | 12 | 38,562(0.03%)#84 | 4,330,976(0.00%)#5,633 |
| 85. | Laporte | 12 | 38,562(0.03%)#85 | 4,330,976(0.00%)#5,689 |
| 86. | Mountain Meadows | 12 | 38,562(0.03%)#86 | 4,330,976(0.00%)#5,715 |
| 87. | Westcliffe | 11 | 38,562(0.03%)#87 | 4,330,976(0.00%)#5,818 |
| 88. | Columbine | 9 | 38,562(0.02%)#88 | 4,330,976(0.00%)#5,967 |
| 89. | Grand View Estates | 9 | 38,562(0.02%)#89 | 4,330,976(0.00%)#6,071 |
| 90. | Durango | 8 | 38,562(0.02%)#90 | 4,330,976(0.00%)#6,092 |
| 91. | Severance | 8 | 38,562(0.02%)#91 | 4,330,976(0.00%)#6,110 |
| 92. | Valmont | 7 | 38,562(0.02%)#92 | 4,330,976(0.00%)#6,340 |
| 93. | Holly Hills | 6 | 38,562(0.02%)#93 | 4,330,976(0.00%)#6,385 |
| 94. | Fort Morgan | 5 | 38,562(0.01%)#94 | 4,330,976(0.00%)#6,474 |
| 95. | Trinidad | 4 | 38,562(0.01%)#95 | 4,330,976(0.00%)#6,614 |
| 96. | Shaw Heights | 3 | 38,562(0.01%)#96 | 4,330,976(0.00%)#6,743 |
| 97. | Niwot | 3 | 38,562(0.01%)#97 | 4,330,976(0.00%)#6,747 |
| 98. | Air Force Academy | 1 | 38,562(0.00%)#98 | 4,330,976(0.00%)#7,048 |
| 99. | Kiowa | 1 | 38,562(0.00%)#99 | 4,330,976(0.00%)#7,116 |
| 100. | Lake City | 1 | 38,562(0.00%)#100 | 4,330,976(0.00%)#7,125 |
Common Questions
What are the Top 10 Cities with the Most Immigrants from South Central Asia in Colorado?
Top 10 Cities with the Most Immigrants from South Central Asia in Colorado are:
#1
5,348
#2
3,720
#3
2,099
#4
1,919
#5
1,798
#6
1,779
#7
1,509
#8
1,376
#9
1,321
#10
1,200
What city has the Most Immigrants from South Central Asia in Colorado?
Aurora has the Most Immigrants from South Central Asia in Colorado with 5,348.
What is the Total Immigrants from South Central Asia in the State of Colorado?
Total Immigrants from South Central Asia in Colorado is 38,562.
What is the Total Immigrants from South Central Asia in the United States?
Total Immigrants from South Central Asia in the United States is 4,330,976.