Cities with the Most Immigrants from France in Pennsylvania
RELATED REPORTS & OPTIONS
France
Pennsylvania
Compare Cities
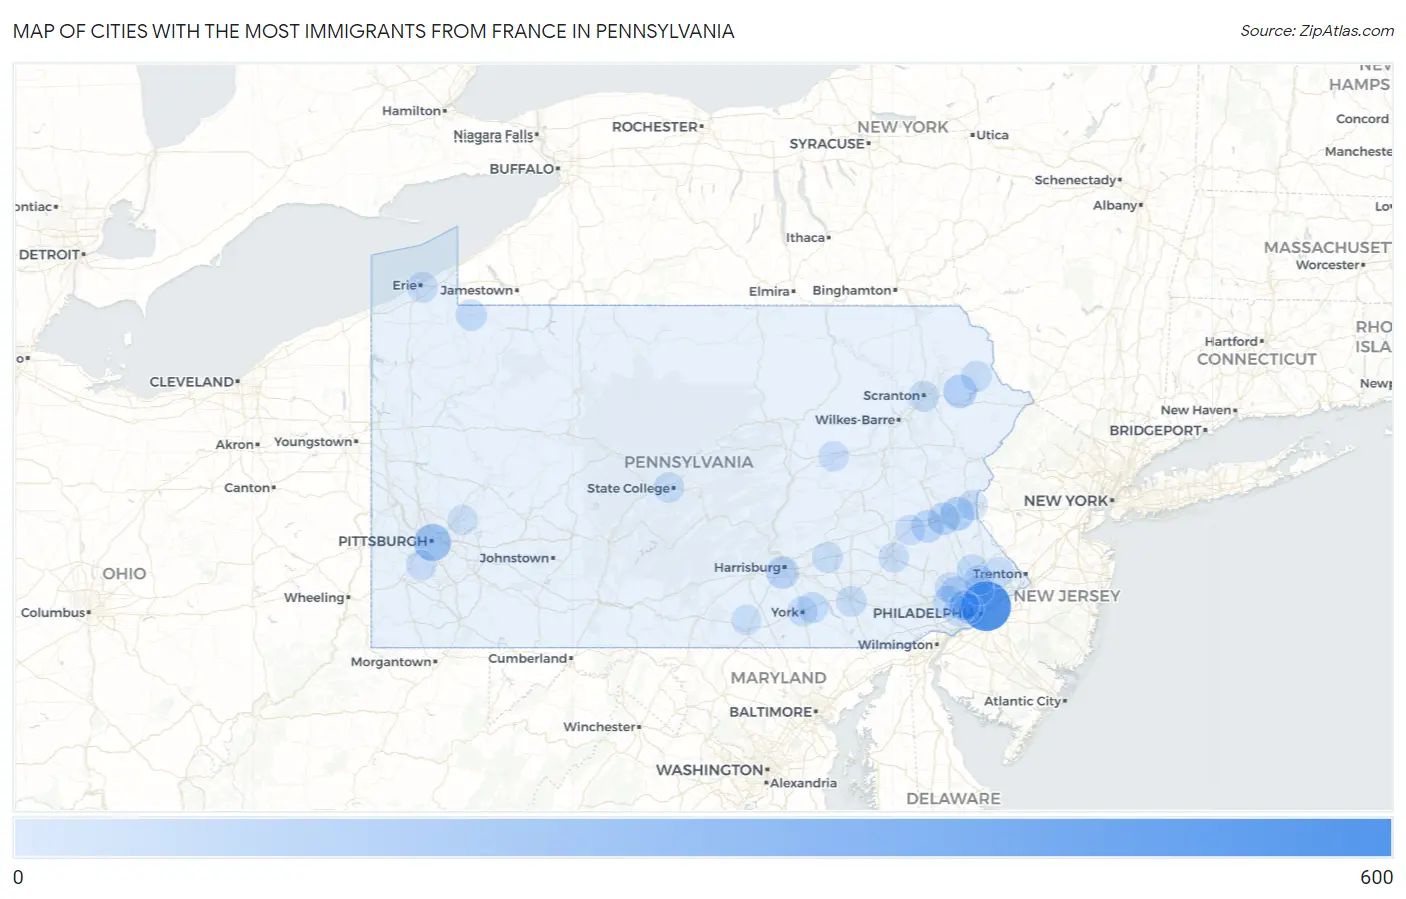
Map of Cities with the Most Immigrants from France in Pennsylvania
0
600
Cities with the Most Immigrants from France in Pennsylvania
| City | France | vs State | vs National | |
| 1. | Philadelphia | 590 | 4,424(13.34%)#1 | 184,998(0.32%)#28 |
| 2. | Pittsburgh | 208 | 4,424(4.70%)#2 | 184,998(0.11%)#101 |
| 3. | State College Borough | 113 | 4,424(2.55%)#3 | 184,998(0.06%)#234 |
| 4. | Bethlehem | 107 | 4,424(2.42%)#4 | 184,998(0.06%)#243 |
| 5. | The Hideout | 101 | 4,424(2.28%)#5 | 184,998(0.05%)#258 |
| 6. | Lower Allen | 76 | 4,424(1.72%)#6 | 184,998(0.04%)#353 |
| 7. | Breinigsville | 73 | 4,424(1.65%)#7 | 184,998(0.04%)#369 |
| 8. | Allentown | 69 | 4,424(1.56%)#8 | 184,998(0.04%)#391 |
| 9. | King Of Prussia | 53 | 4,424(1.20%)#9 | 184,998(0.03%)#521 |
| 10. | Wayne | 48 | 4,424(1.08%)#10 | 184,998(0.03%)#572 |
| 11. | Loretto Borough | 44 | 4,424(0.99%)#11 | 184,998(0.02%)#623 |
| 12. | Montgomeryville | 40 | 4,424(0.90%)#12 | 184,998(0.02%)#681 |
| 13. | Corry | 40 | 4,424(0.90%)#13 | 184,998(0.02%)#683 |
| 14. | Berwyn | 38 | 4,424(0.86%)#14 | 184,998(0.02%)#706 |
| 15. | Hanover Borough | 36 | 4,424(0.81%)#15 | 184,998(0.02%)#744 |
| 16. | Economy Borough | 31 | 4,424(0.70%)#16 | 184,998(0.02%)#844 |
| 17. | Honesdale Borough | 31 | 4,424(0.70%)#17 | 184,998(0.02%)#847 |
| 18. | Huntingdon Borough | 29 | 4,424(0.66%)#18 | 184,998(0.02%)#889 |
| 19. | Yorklyn | 29 | 4,424(0.66%)#19 | 184,998(0.02%)#892 |
| 20. | Carlisle Borough | 28 | 4,424(0.63%)#20 | 184,998(0.02%)#904 |
| 21. | Wyomissing Borough | 27 | 4,424(0.61%)#21 | 184,998(0.01%)#937 |
| 22. | Lititz Borough | 25 | 4,424(0.57%)#22 | 184,998(0.01%)#997 |
| 23. | Bath Borough | 25 | 4,424(0.57%)#23 | 184,998(0.01%)#1,004 |
| 24. | Annville | 24 | 4,424(0.54%)#24 | 184,998(0.01%)#1,042 |
| 25. | Hayti | 24 | 4,424(0.54%)#25 | 184,998(0.01%)#1,049 |
| 26. | Trappe Borough | 23 | 4,424(0.52%)#26 | 184,998(0.01%)#1,078 |
| 27. | White Mills | 23 | 4,424(0.52%)#27 | 184,998(0.01%)#1,082 |
| 28. | Scranton | 22 | 4,424(0.50%)#28 | 184,998(0.01%)#1,086 |
| 29. | Lancaster | 21 | 4,424(0.47%)#29 | 184,998(0.01%)#1,125 |
| 30. | Phoenixville Borough | 20 | 4,424(0.45%)#30 | 184,998(0.01%)#1,178 |
| 31. | Bala Cynwyd | 20 | 4,424(0.45%)#31 | 184,998(0.01%)#1,185 |
| 32. | Erie | 19 | 4,424(0.43%)#32 | 184,998(0.01%)#1,201 |
| 33. | West Chester Borough | 19 | 4,424(0.43%)#33 | 184,998(0.01%)#1,220 |
| 34. | Park Forest Village | 18 | 4,424(0.41%)#34 | 184,998(0.01%)#1,278 |
| 35. | Indiana Borough | 16 | 4,424(0.36%)#35 | 184,998(0.01%)#1,404 |
| 36. | West Reading Borough | 16 | 4,424(0.36%)#36 | 184,998(0.01%)#1,425 |
| 37. | Aldan Borough | 16 | 4,424(0.36%)#37 | 184,998(0.01%)#1,427 |
| 38. | Gettysburg Borough | 15 | 4,424(0.34%)#38 | 184,998(0.01%)#1,479 |
| 39. | East Petersburg Borough | 14 | 4,424(0.32%)#39 | 184,998(0.01%)#1,550 |
| 40. | Kutztown University | 14 | 4,424(0.32%)#40 | 184,998(0.01%)#1,552 |
| 41. | Bradford Woods Borough | 14 | 4,424(0.32%)#41 | 184,998(0.01%)#1,564 |
| 42. | Easton | 11 | 4,424(0.25%)#42 | 184,998(0.01%)#1,735 |
| 43. | Broomall | 11 | 4,424(0.25%)#43 | 184,998(0.01%)#1,758 |
| 44. | Carnegie Borough | 11 | 4,424(0.25%)#44 | 184,998(0.01%)#1,766 |
| 45. | Richboro | 11 | 4,424(0.25%)#45 | 184,998(0.01%)#1,771 |
| 46. | Kutztown Borough | 11 | 4,424(0.25%)#46 | 184,998(0.01%)#1,782 |
| 47. | Mcmurray | 11 | 4,424(0.25%)#47 | 184,998(0.01%)#1,783 |
| 48. | Millersburg Borough | 10 | 4,424(0.23%)#48 | 184,998(0.01%)#1,900 |
| 49. | Bloomsburg | 9 | 4,424(0.20%)#49 | 184,998(0.00%)#1,960 |
| 50. | Forest Hills Borough | 9 | 4,424(0.20%)#50 | 184,998(0.00%)#1,975 |
| 51. | Cornwall Borough | 9 | 4,424(0.20%)#51 | 184,998(0.00%)#1,979 |
| 52. | Ardmore | 8 | 4,424(0.18%)#52 | 184,998(0.00%)#2,057 |
| 53. | Audubon | 8 | 4,424(0.18%)#53 | 184,998(0.00%)#2,070 |
| 54. | Maple Glen | 8 | 4,424(0.18%)#54 | 184,998(0.00%)#2,079 |
| 55. | Laurel Run Borough | 8 | 4,424(0.18%)#55 | 184,998(0.00%)#2,113 |
| 56. | Latrobe Borough | 7 | 4,424(0.16%)#56 | 184,998(0.00%)#2,156 |
| 57. | Marietta Borough | 7 | 4,424(0.16%)#57 | 184,998(0.00%)#2,178 |
| 58. | New Hope Borough | 7 | 4,424(0.16%)#58 | 184,998(0.00%)#2,181 |
| 59. | Bell Acres Borough | 7 | 4,424(0.16%)#59 | 184,998(0.00%)#2,190 |
| 60. | Table Rock | 7 | 4,424(0.16%)#60 | 184,998(0.00%)#2,203 |
| 61. | Reading | 6 | 4,424(0.14%)#61 | 184,998(0.00%)#2,209 |
| 62. | York | 6 | 4,424(0.14%)#62 | 184,998(0.00%)#2,222 |
| 63. | Roslyn | 6 | 4,424(0.14%)#63 | 184,998(0.00%)#2,252 |
| 64. | Oreland | 6 | 4,424(0.14%)#64 | 184,998(0.00%)#2,264 |
| 65. | Macungie Borough | 6 | 4,424(0.14%)#65 | 184,998(0.00%)#2,274 |
| 66. | Penn Wynne | 5 | 4,424(0.11%)#66 | 184,998(0.00%)#2,352 |
| 67. | Yardley Borough | 5 | 4,424(0.11%)#67 | 184,998(0.00%)#2,363 |
| 68. | Canton Borough | 5 | 4,424(0.11%)#68 | 184,998(0.00%)#2,373 |
| 69. | Lower Burrell | 4 | 4,424(0.09%)#69 | 184,998(0.00%)#2,409 |
| 70. | Haverford College | 4 | 4,424(0.09%)#70 | 184,998(0.00%)#2,442 |
| 71. | Houston Borough | 4 | 4,424(0.09%)#71 | 184,998(0.00%)#2,450 |
| 72. | Narberth Borough | 3 | 4,424(0.07%)#72 | 184,998(0.00%)#2,490 |
| 73. | New Britain Borough | 3 | 4,424(0.07%)#73 | 184,998(0.00%)#2,494 |
| 74. | Ben Avon Borough | 3 | 4,424(0.07%)#74 | 184,998(0.00%)#2,510 |
| 75. | Lansdale Borough | 2 | 4,424(0.05%)#75 | 184,998(0.00%)#2,552 |
| 76. | Collegeville Borough | 2 | 4,424(0.05%)#76 | 184,998(0.00%)#2,559 |
| 77. | Trumbauersville Borough | 2 | 4,424(0.05%)#77 | 184,998(0.00%)#2,581 |
| 78. | Valencia Borough | 2 | 4,424(0.05%)#78 | 184,998(0.00%)#2,600 |
| 79. | Glen Osborne Borough | 2 | 4,424(0.05%)#79 | 184,998(0.00%)#2,603 |
| 80. | Lawrenceville Borough | 1 | 4,424(0.02%)#80 | 184,998(0.00%)#2,646 |
| 81. | Rosslyn Farms Borough | 1 | 4,424(0.02%)#81 | 184,998(0.00%)#2,647 |
| 82. | Glendon Borough | 1 | 4,424(0.02%)#82 | 184,998(0.00%)#2,652 |
Common Questions
What are the Top 10 Cities with the Most Immigrants from France in Pennsylvania?
Top 10 Cities with the Most Immigrants from France in Pennsylvania are:
#1
590
#2
208
#3
107
#4
101
#5
76
#6
73
#7
69
#8
53
#9
40
#10
40
What city has the Most Immigrants from France in Pennsylvania?
Philadelphia has the Most Immigrants from France in Pennsylvania with 590.
What is the Total Immigrants from France in the State of Pennsylvania?
Total Immigrants from France in Pennsylvania is 4,424.
What is the Total Immigrants from France in the United States?
Total Immigrants from France in the United States is 184,998.