Cities with the Most Immigrants from Cuba in Illinois
RELATED REPORTS & OPTIONS
Cuba
Illinois
Compare Cities
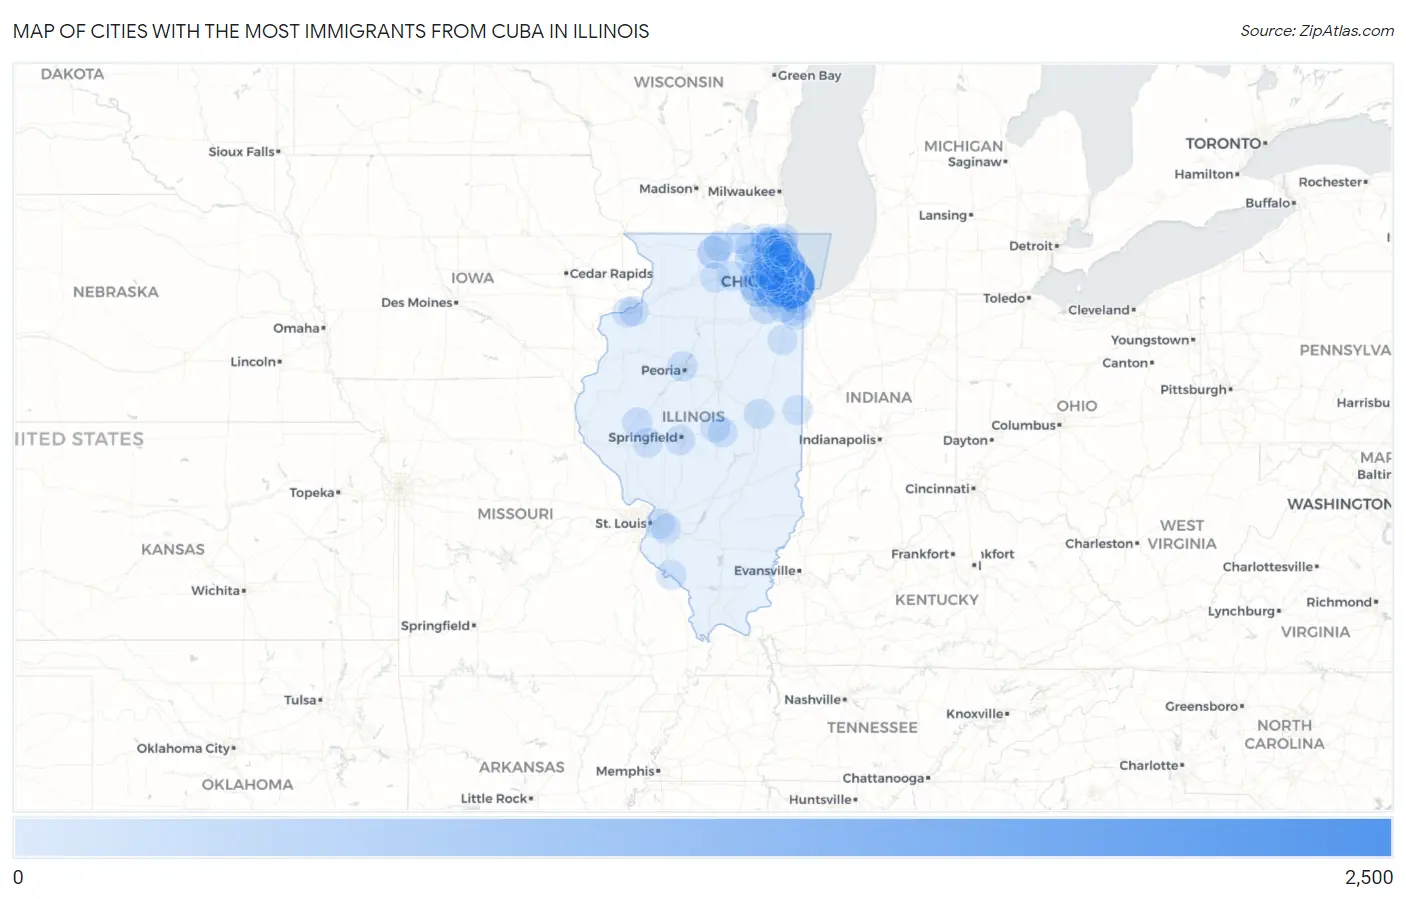
Map of Cities with the Most Immigrants from Cuba in Illinois
0
2,500
Cities with the Most Immigrants from Cuba in Illinois
| City | Cuba | vs State | vs National | |
| 1. | Chicago | 2,419 | 7,171(33.73%)#1 | 1,325,277(0.18%)#73 |
| 2. | Aurora | 420 | 7,171(5.86%)#2 | 1,325,277(0.03%)#246 |
| 3. | Rockford | 306 | 7,171(4.27%)#3 | 1,325,277(0.02%)#293 |
| 4. | Melrose Park | 269 | 7,171(3.75%)#4 | 1,325,277(0.02%)#334 |
| 5. | Skokie | 202 | 7,171(2.82%)#5 | 1,325,277(0.02%)#430 |
| 6. | Hanover Park | 147 | 7,171(2.05%)#6 | 1,325,277(0.01%)#531 |
| 7. | Niles | 143 | 7,171(1.99%)#7 | 1,325,277(0.01%)#539 |
| 8. | Prospect Heights | 117 | 7,171(1.63%)#8 | 1,325,277(0.01%)#630 |
| 9. | Bensenville | 98 | 7,171(1.37%)#9 | 1,325,277(0.01%)#713 |
| 10. | Elmwood Park | 85 | 7,171(1.19%)#10 | 1,325,277(0.01%)#792 |
| 11. | Glenview | 76 | 7,171(1.06%)#11 | 1,325,277(0.01%)#859 |
| 12. | West Chicago | 73 | 7,171(1.02%)#12 | 1,325,277(0.01%)#886 |
| 13. | Harwood Heights | 71 | 7,171(0.99%)#13 | 1,325,277(0.01%)#909 |
| 14. | St Charles | 68 | 7,171(0.95%)#14 | 1,325,277(0.01%)#936 |
| 15. | Naperville | 64 | 7,171(0.89%)#15 | 1,325,277(0.00%)#976 |
| 16. | Joliet | 63 | 7,171(0.88%)#16 | 1,325,277(0.00%)#982 |
| 17. | Wheaton | 61 | 7,171(0.85%)#17 | 1,325,277(0.00%)#1,005 |
| 18. | Evanston | 59 | 7,171(0.82%)#18 | 1,325,277(0.00%)#1,026 |
| 19. | Arlington Heights | 58 | 7,171(0.81%)#19 | 1,325,277(0.00%)#1,042 |
| 20. | Schaumburg | 57 | 7,171(0.79%)#20 | 1,325,277(0.00%)#1,050 |
| 21. | Elmhurst | 56 | 7,171(0.78%)#21 | 1,325,277(0.00%)#1,067 |
| 22. | Waukegan | 54 | 7,171(0.75%)#22 | 1,325,277(0.00%)#1,088 |
| 23. | Cicero | 54 | 7,171(0.75%)#23 | 1,325,277(0.00%)#1,089 |
| 24. | Woodridge | 53 | 7,171(0.74%)#24 | 1,325,277(0.00%)#1,104 |
| 25. | Palatine | 45 | 7,171(0.63%)#25 | 1,325,277(0.00%)#1,227 |
| 26. | Glen Ellyn | 45 | 7,171(0.63%)#26 | 1,325,277(0.00%)#1,231 |
| 27. | Rock Island | 42 | 7,171(0.59%)#27 | 1,325,277(0.00%)#1,279 |
| 28. | Mundelein | 42 | 7,171(0.59%)#28 | 1,325,277(0.00%)#1,280 |
| 29. | Park Ridge | 41 | 7,171(0.57%)#29 | 1,325,277(0.00%)#1,296 |
| 30. | Beardstown | 41 | 7,171(0.57%)#30 | 1,325,277(0.00%)#1,305 |
| 31. | Hainesville | 41 | 7,171(0.57%)#31 | 1,325,277(0.00%)#1,306 |
| 32. | Long Lake | 40 | 7,171(0.56%)#32 | 1,325,277(0.00%)#1,322 |
| 33. | Carol Stream | 39 | 7,171(0.54%)#33 | 1,325,277(0.00%)#1,334 |
| 34. | Berwyn | 38 | 7,171(0.53%)#34 | 1,325,277(0.00%)#1,354 |
| 35. | Springfield | 37 | 7,171(0.52%)#35 | 1,325,277(0.00%)#1,374 |
| 36. | Oak Lawn | 36 | 7,171(0.50%)#36 | 1,325,277(0.00%)#1,394 |
| 37. | Palos Heights | 36 | 7,171(0.50%)#37 | 1,325,277(0.00%)#1,405 |
| 38. | Highland Park | 31 | 7,171(0.43%)#38 | 1,325,277(0.00%)#1,537 |
| 39. | Burbank | 30 | 7,171(0.42%)#39 | 1,325,277(0.00%)#1,564 |
| 40. | Wilmette | 30 | 7,171(0.42%)#40 | 1,325,277(0.00%)#1,565 |
| 41. | Lincolnwood | 28 | 7,171(0.39%)#41 | 1,325,277(0.00%)#1,617 |
| 42. | Peoria | 27 | 7,171(0.38%)#42 | 1,325,277(0.00%)#1,631 |
| 43. | Champaign | 27 | 7,171(0.38%)#43 | 1,325,277(0.00%)#1,633 |
| 44. | Franklin Park | 25 | 7,171(0.35%)#44 | 1,325,277(0.00%)#1,694 |
| 45. | Oak Park | 23 | 7,171(0.32%)#45 | 1,325,277(0.00%)#1,746 |
| 46. | Northbrook | 23 | 7,171(0.32%)#46 | 1,325,277(0.00%)#1,752 |
| 47. | North Chicago | 23 | 7,171(0.32%)#47 | 1,325,277(0.00%)#1,753 |
| 48. | Huntley | 23 | 7,171(0.32%)#48 | 1,325,277(0.00%)#1,754 |
| 49. | Volo | 23 | 7,171(0.32%)#49 | 1,325,277(0.00%)#1,776 |
| 50. | Westchester | 22 | 7,171(0.31%)#50 | 1,325,277(0.00%)#1,803 |
| 51. | Lisle | 21 | 7,171(0.29%)#51 | 1,325,277(0.00%)#1,838 |
| 52. | Burr Ridge | 21 | 7,171(0.29%)#52 | 1,325,277(0.00%)#1,852 |
| 53. | Deer Park | 21 | 7,171(0.29%)#53 | 1,325,277(0.00%)#1,867 |
| 54. | Oak Brook | 20 | 7,171(0.28%)#54 | 1,325,277(0.00%)#1,902 |
| 55. | Caseyville | 19 | 7,171(0.26%)#55 | 1,325,277(0.00%)#1,947 |
| 56. | Northlake | 18 | 7,171(0.25%)#56 | 1,325,277(0.00%)#1,982 |
| 57. | Long Grove | 18 | 7,171(0.25%)#57 | 1,325,277(0.00%)#1,986 |
| 58. | Chester | 18 | 7,171(0.25%)#58 | 1,325,277(0.00%)#1,988 |
| 59. | Des Plaines | 17 | 7,171(0.24%)#59 | 1,325,277(0.00%)#2,013 |
| 60. | Beach Park | 17 | 7,171(0.24%)#60 | 1,325,277(0.00%)#2,028 |
| 61. | Gurnee | 16 | 7,171(0.22%)#61 | 1,325,277(0.00%)#2,070 |
| 62. | Fox Lake | 16 | 7,171(0.22%)#62 | 1,325,277(0.00%)#2,084 |
| 63. | Lansing | 15 | 7,171(0.21%)#63 | 1,325,277(0.00%)#2,118 |
| 64. | Crete | 15 | 7,171(0.21%)#64 | 1,325,277(0.00%)#2,142 |
| 65. | Romeoville | 14 | 7,171(0.20%)#65 | 1,325,277(0.00%)#2,168 |
| 66. | Algonquin | 14 | 7,171(0.20%)#66 | 1,325,277(0.00%)#2,175 |
| 67. | South Elgin | 14 | 7,171(0.20%)#67 | 1,325,277(0.00%)#2,180 |
| 68. | Park Forest | 14 | 7,171(0.20%)#68 | 1,325,277(0.00%)#2,183 |
| 69. | Jacksonville | 14 | 7,171(0.20%)#69 | 1,325,277(0.00%)#2,188 |
| 70. | Shiloh | 14 | 7,171(0.20%)#70 | 1,325,277(0.00%)#2,192 |
| 71. | Barrington | 14 | 7,171(0.20%)#71 | 1,325,277(0.00%)#2,198 |
| 72. | Willow Springs | 14 | 7,171(0.20%)#72 | 1,325,277(0.00%)#2,208 |
| 73. | Warrensburg | 14 | 7,171(0.20%)#73 | 1,325,277(0.00%)#2,221 |
| 74. | Buffalo Grove | 13 | 7,171(0.18%)#74 | 1,325,277(0.00%)#2,233 |
| 75. | Streamwood | 13 | 7,171(0.18%)#75 | 1,325,277(0.00%)#2,234 |
| 76. | Danville | 13 | 7,171(0.18%)#76 | 1,325,277(0.00%)#2,235 |
| 77. | North Aurora | 13 | 7,171(0.18%)#77 | 1,325,277(0.00%)#2,245 |
| 78. | Mount Prospect | 12 | 7,171(0.17%)#78 | 1,325,277(0.00%)#2,299 |
| 79. | Moline | 12 | 7,171(0.17%)#79 | 1,325,277(0.00%)#2,304 |
| 80. | Round Lake Beach | 12 | 7,171(0.17%)#80 | 1,325,277(0.00%)#2,312 |
| 81. | Woodstock | 12 | 7,171(0.17%)#81 | 1,325,277(0.00%)#2,314 |
| 82. | Norridge | 12 | 7,171(0.17%)#82 | 1,325,277(0.00%)#2,323 |
| 83. | Morton Grove | 11 | 7,171(0.15%)#83 | 1,325,277(0.00%)#2,384 |
| 84. | Libertyville | 11 | 7,171(0.15%)#84 | 1,325,277(0.00%)#2,390 |
| 85. | La Grange | 11 | 7,171(0.15%)#85 | 1,325,277(0.00%)#2,394 |
| 86. | Harvard | 11 | 7,171(0.15%)#86 | 1,325,277(0.00%)#2,405 |
| 87. | Glendale Heights | 10 | 7,171(0.14%)#87 | 1,325,277(0.00%)#2,456 |
| 88. | Winnetka | 10 | 7,171(0.14%)#88 | 1,325,277(0.00%)#2,478 |
| 89. | Riverdale | 10 | 7,171(0.14%)#89 | 1,325,277(0.00%)#2,482 |
| 90. | Rochelle | 10 | 7,171(0.14%)#90 | 1,325,277(0.00%)#2,486 |
| 91. | Lincolnshire | 10 | 7,171(0.14%)#91 | 1,325,277(0.00%)#2,487 |
| 92. | Lombard | 9 | 7,171(0.13%)#92 | 1,325,277(0.00%)#2,530 |
| 93. | Vernon Hills | 9 | 7,171(0.13%)#93 | 1,325,277(0.00%)#2,542 |
| 94. | Loves Park | 9 | 7,171(0.13%)#94 | 1,325,277(0.00%)#2,548 |
| 95. | Bloomingdale | 9 | 7,171(0.13%)#95 | 1,325,277(0.00%)#2,551 |
| 96. | Mokena | 9 | 7,171(0.13%)#96 | 1,325,277(0.00%)#2,555 |
| 97. | Lake Forest | 9 | 7,171(0.13%)#97 | 1,325,277(0.00%)#2,557 |
| 98. | Decatur | 8 | 7,171(0.11%)#98 | 1,325,277(0.00%)#2,626 |
| 99. | Dekalb | 8 | 7,171(0.11%)#99 | 1,325,277(0.00%)#2,634 |
| 100. | Kankakee | 8 | 7,171(0.11%)#100 | 1,325,277(0.00%)#2,646 |
Common Questions
What are the Top 10 Cities with the Most Immigrants from Cuba in Illinois?
Top 10 Cities with the Most Immigrants from Cuba in Illinois are:
#1
2,419
#2
420
#3
306
#4
269
#5
202
#6
147
#7
143
#8
117
#9
98
#10
85
What city has the Most Immigrants from Cuba in Illinois?
Chicago has the Most Immigrants from Cuba in Illinois with 2,419.
What is the Total Immigrants from Cuba in the State of Illinois?
Total Immigrants from Cuba in Illinois is 7,171.
What is the Total Immigrants from Cuba in the United States?
Total Immigrants from Cuba in the United States is 1,325,277.