Cities with the Highest Percentage of Immigrants from Northern Africa in Ohio
RELATED REPORTS & OPTIONS
Northern Africa
Ohio
Compare Cities
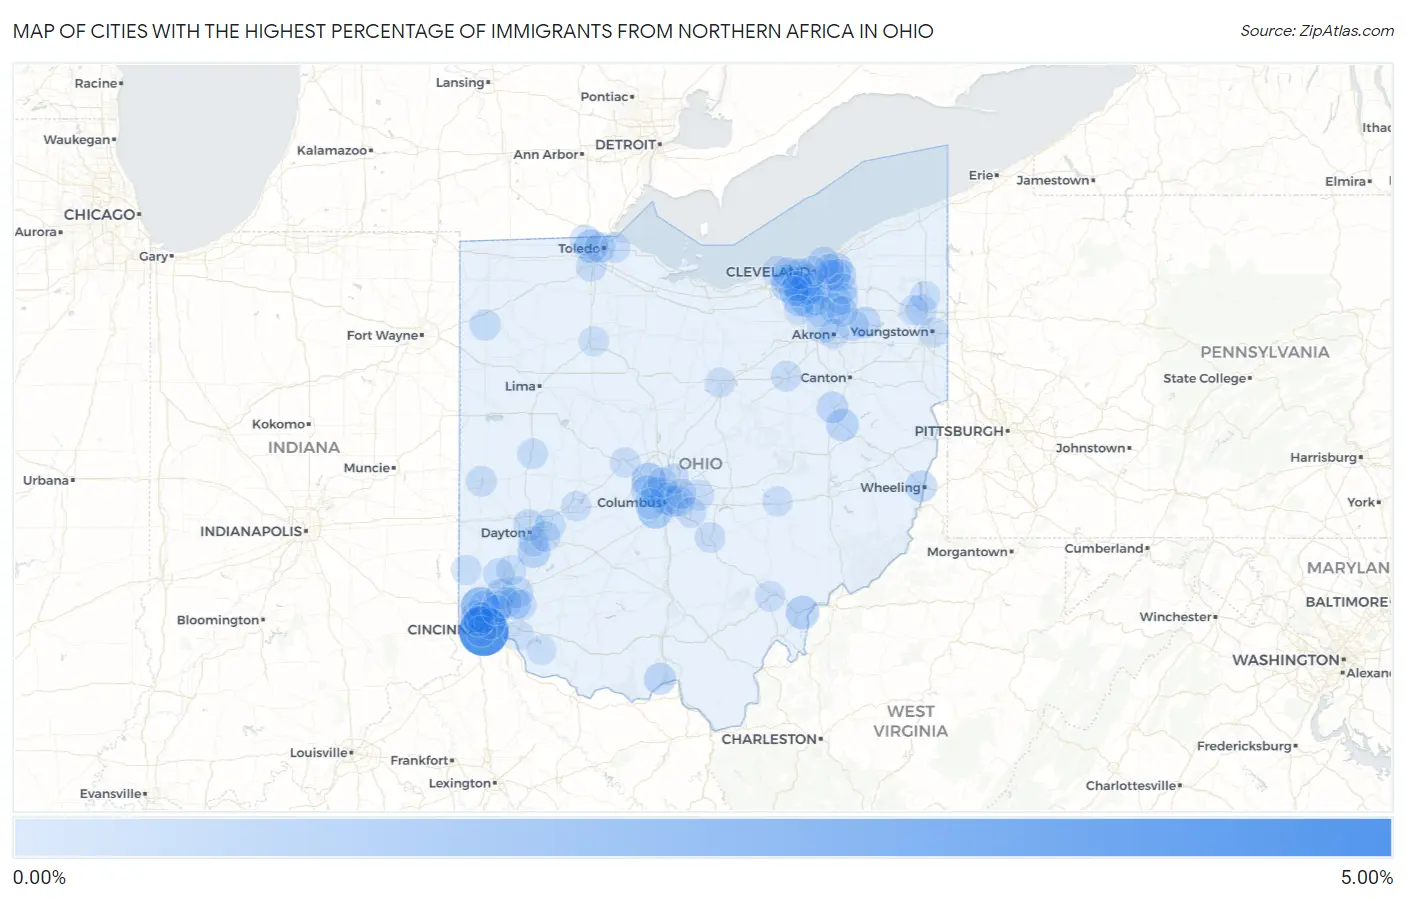
Map of Cities with the Highest Percentage of Immigrants from Northern Africa in Ohio
0.00%
5.00%
Cities with the Highest Percentage of Immigrants from Northern Africa in Ohio
| City | Northern Africa | vs State | vs National | |
| 1. | Delshire | 4.70% | 0.11%(+4.59)#-1 | 0.13%(+4.57)#0 |
| 2. | Dry Ridge | 1.94% | 0.11%(+1.83)#0 | 0.13%(+1.81)#1 |
| 3. | Urbancrest | 1.12% | 0.11%(+1.02)#1 | 0.13%(+0.996)#2 |
| 4. | Dublin | 1.02% | 0.11%(+0.913)#2 | 0.13%(+0.891)#3 |
| 5. | North Royalton | 0.97% | 0.11%(+0.868)#3 | 0.13%(+0.846)#4 |
| 6. | Ottawa Hills | 0.82% | 0.11%(+0.710)#4 | 0.13%(+0.688)#5 |
| 7. | Coolville | 0.81% | 0.11%(+0.707)#5 | 0.13%(+0.686)#6 |
| 8. | North Olmsted | 0.74% | 0.11%(+0.633)#6 | 0.13%(+0.611)#7 |
| 9. | Centerville | 0.70% | 0.11%(+0.592)#7 | 0.13%(+0.570)#8 |
| 10. | New Philadelphia | 0.56% | 0.11%(+0.457)#8 | 0.13%(+0.435)#9 |
| 11. | Hilliard | 0.55% | 0.11%(+0.440)#27 | 0.13%(+0.418)#798 |
| 12. | Lyndhurst | 0.52% | 0.11%(+0.411)#28 | 0.13%(+0.389)#799 |
| 13. | Parma Heights | 0.51% | 0.11%(+0.402)#29 | 0.13%(+0.380)#800 |
| 14. | Pepper Pike | 0.49% | 0.11%(+0.381)#30 | 0.13%(+0.359)#801 |
| 15. | Columbus | 0.47% | 0.11%(+0.365)#31 | 0.13%(+0.343)#802 |
| 16. | Strongsville | 0.47% | 0.11%(+0.362)#32 | 0.13%(+0.340)#803 |
| 17. | Beachwood | 0.45% | 0.11%(+0.342)#33 | 0.13%(+0.320)#804 |
| 18. | Dent | 0.45% | 0.11%(+0.340)#34 | 0.13%(+0.318)#805 |
| 19. | Sixteen Mile Stand | 0.44% | 0.11%(+0.330)#35 | 0.13%(+0.308)#806 |
| 20. | West Portsmouth | 0.43% | 0.11%(+0.328)#36 | 0.13%(+0.306)#807 |
| 21. | Bratenahl | 0.42% | 0.11%(+0.316)#37 | 0.13%(+0.295)#808 |
| 22. | Seven Hills | 0.42% | 0.11%(+0.314)#38 | 0.13%(+0.292)#809 |
| 23. | Bridgeport | 0.41% | 0.11%(+0.309)#39 | 0.13%(+0.287)#810 |
| 24. | Parma | 0.40% | 0.11%(+0.290)#40 | 0.13%(+0.268)#811 |
| 25. | Woodlawn | 0.39% | 0.11%(+0.283)#41 | 0.13%(+0.261)#812 |
| 26. | Strasburg | 0.39% | 0.11%(+0.282)#42 | 0.13%(+0.260)#813 |
| 27. | Kent | 0.38% | 0.11%(+0.279)#43 | 0.13%(+0.257)#814 |
| 28. | Ravenna | 0.37% | 0.11%(+0.265)#44 | 0.13%(+0.244)#815 |
| 29. | Brooklyn | 0.36% | 0.11%(+0.259)#45 | 0.13%(+0.237)#816 |
| 30. | Rocky River | 0.36% | 0.11%(+0.256)#46 | 0.13%(+0.235)#817 |
| 31. | Twinsburg | 0.33% | 0.11%(+0.221)#47 | 0.13%(+0.199)#818 |
| 32. | Westlake | 0.33% | 0.11%(+0.221)#48 | 0.13%(+0.199)#819 |
| 33. | Fairlawn | 0.32% | 0.11%(+0.219)#49 | 0.13%(+0.197)#820 |
| 34. | Dayton | 0.32% | 0.11%(+0.218)#50 | 0.13%(+0.196)#821 |
| 35. | Upper Arlington | 0.32% | 0.11%(+0.212)#51 | 0.13%(+0.190)#1,255 |
| 36. | Mason | 0.31% | 0.11%(+0.208)#52 | 0.13%(+0.186)#1,256 |
| 37. | Middleburg Heights | 0.29% | 0.11%(+0.183)#53 | 0.13%(+0.162)#1,257 |
| 38. | Bexley | 0.29% | 0.11%(+0.183)#54 | 0.13%(+0.161)#1,258 |
| 39. | Macedonia | 0.28% | 0.11%(+0.175)#55 | 0.13%(+0.153)#1,259 |
| 40. | Northgate | 0.27% | 0.11%(+0.162)#56 | 0.13%(+0.140)#1,260 |
| 41. | Paulding | 0.25% | 0.11%(+0.142)#57 | 0.13%(+0.120)#1,261 |
| 42. | Cincinnati | 0.25% | 0.11%(+0.140)#58 | 0.13%(+0.118)#1,262 |
| 43. | Boston Heights | 0.24% | 0.11%(+0.136)#59 | 0.13%(+0.114)#1,263 |
| 44. | Monfort Heights | 0.23% | 0.11%(+0.128)#60 | 0.13%(+0.106)#1,264 |
| 45. | Broadview Heights | 0.22% | 0.11%(+0.117)#61 | 0.13%(+0.095)#1,265 |
| 46. | Whitehall | 0.21% | 0.11%(+0.109)#62 | 0.13%(+0.087)#1,266 |
| 47. | Fairborn | 0.21% | 0.11%(+0.106)#63 | 0.13%(+0.084)#1,267 |
| 48. | Trenton | 0.21% | 0.11%(+0.100)#64 | 0.13%(+0.078)#1,268 |
| 49. | Beckett Ridge | 0.20% | 0.11%(+0.097)#65 | 0.13%(+0.075)#1,269 |
| 50. | Lincoln Village | 0.20% | 0.11%(+0.093)#66 | 0.13%(+0.071)#1,270 |
| 51. | Richfield | 0.19% | 0.11%(+0.083)#67 | 0.13%(+0.061)#1,271 |
| 52. | Shaker Heights | 0.19% | 0.11%(+0.080)#68 | 0.13%(+0.058)#1,272 |
| 53. | Pataskala | 0.18% | 0.11%(+0.079)#69 | 0.13%(+0.058)#1,273 |
| 54. | Sylvania | 0.18% | 0.11%(+0.078)#70 | 0.13%(+0.056)#1,274 |
| 55. | Delhi Hills | 0.18% | 0.11%(+0.071)#71 | 0.13%(+0.049)#1,275 |
| 56. | Howland Center | 0.18% | 0.11%(+0.070)#72 | 0.13%(+0.048)#1,276 |
| 57. | Sharonville | 0.16% | 0.11%(+0.058)#73 | 0.13%(+0.037)#1,277 |
| 58. | Kettering | 0.16% | 0.11%(+0.057)#74 | 0.13%(+0.035)#1,278 |
| 59. | Cleveland | 0.16% | 0.11%(+0.051)#75 | 0.13%(+0.029)#1,279 |
| 60. | Beavercreek | 0.15% | 0.11%(+0.049)#76 | 0.13%(+0.027)#1,390 |
| 61. | Solon | 0.15% | 0.11%(+0.048)#77 | 0.13%(+0.026)#1,391 |
| 62. | Lakewood | 0.15% | 0.11%(+0.047)#78 | 0.13%(+0.025)#1,392 |
| 63. | Sidney | 0.15% | 0.11%(+0.042)#79 | 0.13%(+0.020)#1,393 |
| 64. | Greenville | 0.14% | 0.11%(+0.035)#80 | 0.13%(+0.014)#1,394 |
| 65. | Wooster | 0.14% | 0.11%(+0.035)#81 | 0.13%(+0.013)#1,395 |
| 66. | Perrysburg | 0.14% | 0.11%(+0.031)#82 | 0.13%(+0.009)#1,396 |
| 67. | Westerville | 0.13% | 0.11%(+0.023)#83 | 0.13%(+0.001)#1,397 |
| 68. | Lancaster | 0.13% | 0.11%(+0.022)#84 | 0.13%(+0.001)#1,398 |
| 69. | Avon Lake | 0.13% | 0.11%(+0.021)#85 | 0.13%(-0.001)#1,399 |
| 70. | Toledo | 0.13% | 0.11%(+0.021)#86 | 0.13%(-0.001)#1,400 |
| 71. | Hudson | 0.12% | 0.11%(+0.016)#87 | 0.13%(-0.006)#1,401 |
| 72. | Bay Village | 0.12% | 0.11%(+0.013)#88 | 0.13%(-0.009)#1,402 |
| 73. | Loveland | 0.11% | 0.11%(+0.000)#89 | 0.13%(-0.022)#1,403 |
| 74. | Oregon | 0.11% | 0.11%(=0.000)#90 | 0.13%(-0.022)#1,404 |
| 75. | Athens | 0.093% | 0.11%(-0.013)#91 | 0.13%(-0.035)#1,405 |
| 76. | Bridgetown | 0.089% | 0.11%(-0.017)#92 | 0.13%(-0.039)#1,406 |
| 77. | Gahanna | 0.087% | 0.11%(-0.018)#93 | 0.13%(-0.040)#1,407 |
| 78. | Brook Park | 0.081% | 0.11%(-0.025)#94 | 0.13%(-0.046)#1,408 |
| 79. | Wyoming | 0.080% | 0.11%(-0.025)#95 | 0.13%(-0.047)#1,409 |
| 80. | Cortland | 0.071% | 0.11%(-0.035)#96 | 0.13%(-0.057)#1,410 |
| 81. | Springfield | 0.067% | 0.11%(-0.039)#97 | 0.13%(-0.061)#1,411 |
| 82. | Marysville | 0.066% | 0.11%(-0.040)#98 | 0.13%(-0.062)#1,412 |
| 83. | Middletown | 0.061% | 0.11%(-0.044)#99 | 0.13%(-0.066)#1,413 |
| 84. | Pickerington | 0.060% | 0.11%(-0.045)#100 | 0.13%(-0.067)#1,414 |
| 85. | Oxford | 0.054% | 0.11%(-0.051)#101 | 0.13%(-0.073)#1,415 |
| 86. | Berea | 0.049% | 0.11%(-0.057)#102 | 0.13%(-0.079)#1,416 |
| 87. | Worthington | 0.047% | 0.11%(-0.059)#103 | 0.13%(-0.081)#1,417 |
| 88. | Akron | 0.043% | 0.11%(-0.062)#104 | 0.13%(-0.084)#1,418 |
| 89. | Withamsville | 0.038% | 0.11%(-0.067)#105 | 0.13%(-0.089)#1,419 |
| 90. | Bethel | 0.038% | 0.11%(-0.068)#106 | 0.13%(-0.089)#1,420 |
| 91. | Cleveland Heights | 0.038% | 0.11%(-0.068)#107 | 0.13%(-0.090)#1,421 |
| 92. | Zanesville | 0.036% | 0.11%(-0.069)#108 | 0.13%(-0.091)#1,422 |
| 93. | Brunswick | 0.028% | 0.11%(-0.077)#109 | 0.13%(-0.099)#1,423 |
| 94. | Findlay | 0.027% | 0.11%(-0.078)#110 | 0.13%(-0.100)#1,424 |
| 95. | Warren | 0.015% | 0.11%(-0.090)#111 | 0.13%(-0.112)#1,425 |
| 96. | Mansfield | 0.010% | 0.11%(-0.095)#112 | 0.13%(-0.117)#1,426 |
| 97. | Youngstown | 0.0083% | 0.11%(-0.097)#113 | 0.13%(-0.119)#1,427 |
Common Questions
What are the Top 10 Cities with the Highest Percentage of Immigrants from Northern Africa in Ohio?
Top 10 Cities with the Highest Percentage of Immigrants from Northern Africa in Ohio are:
#1
4.70%
#2
1.94%
#3
1.12%
#4
1.02%
#5
0.97%
#6
0.82%
#7
0.81%
#8
0.74%
#9
0.70%
#10
0.56%
What city has the Highest Percentage of Immigrants from Northern Africa in Ohio?
Delshire has the Highest Percentage of Immigrants from Northern Africa in Ohio with 4.70%.
What is the Percentage of Immigrants from Northern Africa in the State of Ohio?
Percentage of Immigrants from Northern Africa in Ohio is 0.11%.
What is the Percentage of Immigrants from Northern Africa in the United States?
Percentage of Immigrants from Northern Africa in the United States is 0.13%.