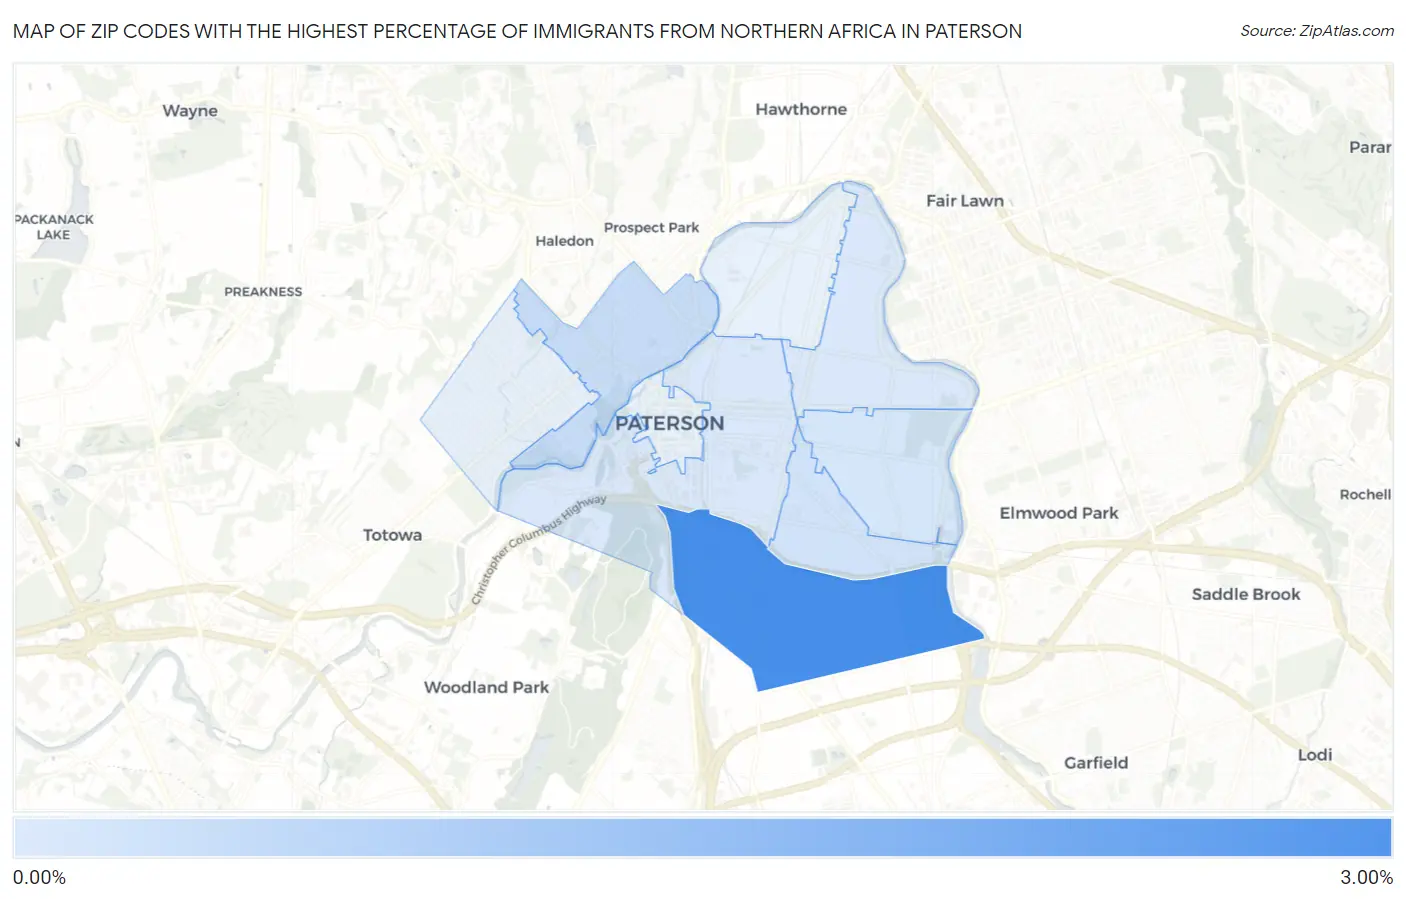
Zip Codes with the Highest Percentage of Immigrants from Northern Africa in Paterson, NJ
RELATED REPORTS & OPTIONS
Northern Africa
Paterson
Compare Zip Codes
Map of Zip Codes with the Highest Percentage of Immigrants from Northern Africa in Paterson
0.031%
2.87%

Zip Codes with the Highest Percentage of Immigrants from Northern Africa in Paterson, NJ
| Zip Code | Northern Africa | vs State | vs National | |
| 1. | 07503 | 2.87% | 0.46%(+2.41)#-1 | 0.13%(+2.75)#0 |
| 2. | 07522 | 0.39% | 0.46%(-0.072)#0 | 0.13%(+0.261)#1 |
| 3. | 07513 | 0.23% | 0.46%(-0.235)#1 | 0.13%(+0.098)#2 |
| 4. | 07504 | 0.12% | 0.46%(-0.345)#2 | 0.13%(-0.011)#3 |
| 5. | 07514 | 0.065% | 0.46%(-0.396)#3 | 0.13%(-0.062)#4 |
| 6. | 07501 | 0.031% | 0.46%(-0.430)#4 | 0.13%(-0.096)#5 |
1
Common Questions
What are the Top 5 Zip Codes with the Highest Percentage of Immigrants from Northern Africa in Paterson, NJ?
Top 5 Zip Codes with the Highest Percentage of Immigrants from Northern Africa in Paterson, NJ are:
What zip code has the Highest Percentage of Immigrants from Northern Africa in Paterson, NJ?
07503 has the Highest Percentage of Immigrants from Northern Africa in Paterson, NJ with 2.87%.
What is the Percentage of Immigrants from Northern Africa in Paterson, NJ?
Percentage of Immigrants from Northern Africa in Paterson is 0.45%.
What is the Percentage of Immigrants from Northern Africa in New Jersey?
Percentage of Immigrants from Northern Africa in New Jersey is 0.46%.
What is the Percentage of Immigrants from Northern Africa in the United States?
Percentage of Immigrants from Northern Africa in the United States is 0.13%.